
Mining Linguistic Summaries in Traffic
Jhonny Pincay
a
, Edy Portmann
b
and Luis Ter
´
an
Human-IST Institute, University of Fribourg, Boulevard de P
´
erolles 90, Fribourg, Switzerland
Keywords:
Linguistic Summaries, Traffic Data, Fuzzy Logic, Smart Cities, Smart Logistics.
Abstract:
This case study article presents details about the implementation of an artifact that uses traffic data databases
to mine linguistic summaries. The linguistic summaries are obtained and validated to ease the understanding
of the data and to help users to convey information quickly and effectively. Through a web application that
makes use of maps and accompanies them with the summaries, it was found that users with no experience
in traffic analysis, do perceive that the mined linguistic summarizations helped them to understand data that
would be rather complex even through figures and statistical measures. Nevertheless, although the linguistic
summaries were perceived as useful, some users also found that they could provide some more details and
have a finer granularity.
1 INTRODUCTION
Human smart cities are aimed at enhancing the city
services to improve the quality of life and inclusion
of people living or working there. Informing citizens
and stakeholders is thus a crucial aspect towards
developing solutions that answer to the needs of the
people (Colombo et al., 2020a,b). The large amounts
of data that are being generated day to day, however,
bring challenges when communicating to an
audience that does not necessarily have technical
knowledge but that needs to be informed.
Linguistic summaries (LSs) allow verbalizing
information by quantified sentences and are an
alternative to address the aforementioned issue. They
are based on the fuzzy set theory and thus adjectives
and adverbs can be used more thoroughly when
verbalizing information (Zadeh et al., 1996; Hudec,
2019). For instance, the sentence about half of young
citizens have a high interest in traffic topics, could be
easier to understand than providing figures and
numbers.
Through linguistic summarization it is possible to
extract abstract knowledge from numerical and
categorical data in a straightforward manner. It has
received significant attention from diverse areas
including decision support systems, social networks,
recommender systems, traffic analysis, and smart
cities (Boran et al., 2016).
a
https://orcid.org/0000-0003-2045-8820
b
https://orcid.org/0000-0001-6448-1139
Traffic-related data can particularly be difficult,
to examine and understand given their heterogeneity
and volume (Pincay et al., 2020b). Moreover,
Transportation and traffic parameters are defined in
uncertain, imprecise, ambiguous, and subjective
terms (Aftabuzzaman, 2007; Pincay et al., 2020a). At
the same time, traffic-related information is of
interest to the vast majority of people using the roads
for transportation.
Linguistic summaries are a suitable option for
providing compact but useful descriptions of the
data. Certainly, LSs might not provide a fully clear
image of a certain situation but they can be a
valuable tool to explain problems and behaviors and
make, for instance, more citizens participants in the
development of smart solutions.
This research effort presents the development and
results of a case study whose goal is to obtain
linguistic summarizations from two databases that
contain data related to traffic incidents and their
duration. Through the development of an artifact and
with a trandisciplinary approach, it is intended to
provide notions about how to integrate
heterogeneous traffic data and to convey information
to users that do not necessarily have a wide
understanding of traffic analysis.
This article is structured as follows: section 2
introduces the concepts and related works on which
this research work is grounded. Then, the methods
followed in the design of the linguistic mining
artifact are described in section 3. section 4 presents
Pincay, J., Portmann, E. and Terán, L.
Mining Linguistic Summaries in Traffic.
DOI: 10.5220/0010650100003063
In Proceedings of the 13th International Joint Conference on Computational Intelligence (IJCCI 2021), pages 169-176
ISBN: 978-989-758-534-0; ISSN: 2184-3236
Copyright © 2023 by SCITEPRESS – Science and Technology Publications, Lda. Under CC license (CC BY-NC-ND 4.0)
169

the results of the implementation of the project.
Lastly, section 5 closes the curtains of this research
with a summary and concluding remarks.
2 THEORETICAL BACKGROUND
This section presents the theories applied in the
development of this research effort.
2.1 Linguistic Summaries
Linguistic summaries were first introduced by Yager
(1982) as a way of summarizing data based on fuzzy
theories. They respond to the need of providing
summarized knowledge from data to users in an
understandable manner through the use of linguistic
terms (Yager, 1982; Hudec, 2016).
Certainly, statistic measures such as mean,
median, and standard deviation help people to
convey information; nevertheless, they limit the
audience to a smaller set of specialized people.
Formally, a linguistic summary or summarizer S
is expressed as:
Qx(P(x)) (1)
where Qx corresponds to a linguistic quantifier
and P(x) is a predicate describing evaluated
attributes (Hudec, 2016; Hudec et al., 2020b).
The aforementioned can be illustrated with the
sentence Most traffic accidents produce long time
delays. The term most is a linguistic quantifier,
referring in this case to the majority of accidents; on
the other hand, long is the predicate that described
the attribute time delay.
However, it is crucial to measure the validity of
such sentences when mining them from large
datasets. To that end, the validity (truth value) of a
linguistic summary is defined as (Kacprzyk and
Zadrozny, 2009):
v(Qx(P(x))) = µ
Q
(
1
n
n
∑
i=1
µ
S
(x
i
)) (2)
where n is the cardinality of a set, the expression
1
n
∑
n
i=1
µ
S
(x
i
) is the proportion of entities that meet the
predicate P; µ
Q
and µ
P
on the other hand, formalize
the quantifier Q and predicate P through membership
functions. The validity v(Qx(P(x))) is thus a value
between 0 and 1.
Linguistic summaries are being widely used in
smart city solutions as a way of informing citizens
and not specialized audiences about the development
of aspects in their cities. They constitute a promising
way of extracting knowledge in an efficient fashion,
that fits in a better way how human beings think and
express themselves (Boran et al., 2016; Hudec,
2019).
Moreover and from a technical perspective, data
summarization is one of the basic capabilities that
any intelligent system must have (Kacprzyk and
Zadrozny, 2009) and thus, their inclusion as
enhancement of applications of any kind is coherent.
2.2 Linguistic Summaries for Traffic
Alvarez-Alvarez et al. (2012) designed an
application that generates linguistic descriptions of
evolving traffic behavior to assist traffic managers in
decision-making tasks. To this effect, the researchers
applied concepts of computing with words and fuzzy
rules to extract summaries from real and simulated
traffic reports. The approach was validated by
generating linguistic descriptions from input data
derived through image processing techniques from a
video stream. The authors found that it was possible
to obtain a variety of linguistic reports that can be
customized to the users’ needs.
In the work of Trivino et al. (2010), details about
the implementation of a system that generates
sentences to describe traffic perceptions in natural
language are presented. Through computer vision
techniques, features from traffic images of a
roundabout were extracted; these features then are
the input of a linguistic model capable of spawning
text descriptions of the observed phenomena. Fuzzy
logic techniques were then used to compute the
validity of the linguistic descriptions. As per the
experimental results of the study, it was found that
the text descriptions produced by the system were
comparable to the descriptions that a human being
could provide. However, the researchers also
manifested that their implementation needs further
tuning.
Another relative initiative is the research effort of
Popek et al. (2011). The authors provided an
overview of a distributed agent-based system that
delivers summaries of city traffic in a textual form.
Their system was capable of dealing with incomplete
data collected through traffic sensors and provides
descriptions of traffic states with auto-epistemic
operators of possibility, belief, and knowledge. The
summaries generated by each agent are then
aggregated to provide summaries for a region.
Contrary to the aforementioned related work, this
initiative pretends to ease the understanding of
heterogeneous traffic data to common users.
Following a transdisciplinary approach and with the
FCTA 2021 - 13th International Conference on Fuzzy Computation Theory and Applications
170
implementation of an artifact that spawns meaningful
linguistic summaries, it is expected to provide
notions to researchers on how applying fuzzy
methods to large and diverse datasets enables helping
people to convey information quickly and effectively.
3 METHOD AND ARTIFACT
DESIGN
This research work was conducted following the
guidelines of the design science research for
information systems (Hevner and Chatterjee, 2010)
in conjunction with a transdisciplinary approach (i.e.,
incorporating practical experiences into the solution
process (Hadorn et al., 2008)).
This methodology was selected given that its
application leads to the development of artifacts that
enable the extension of existing knowledge (Hevner
and Chatterjee, 2010). Furthermore, this project was
conducted in collaboration with an industrial partner
interested in the practical results of this research
effort.
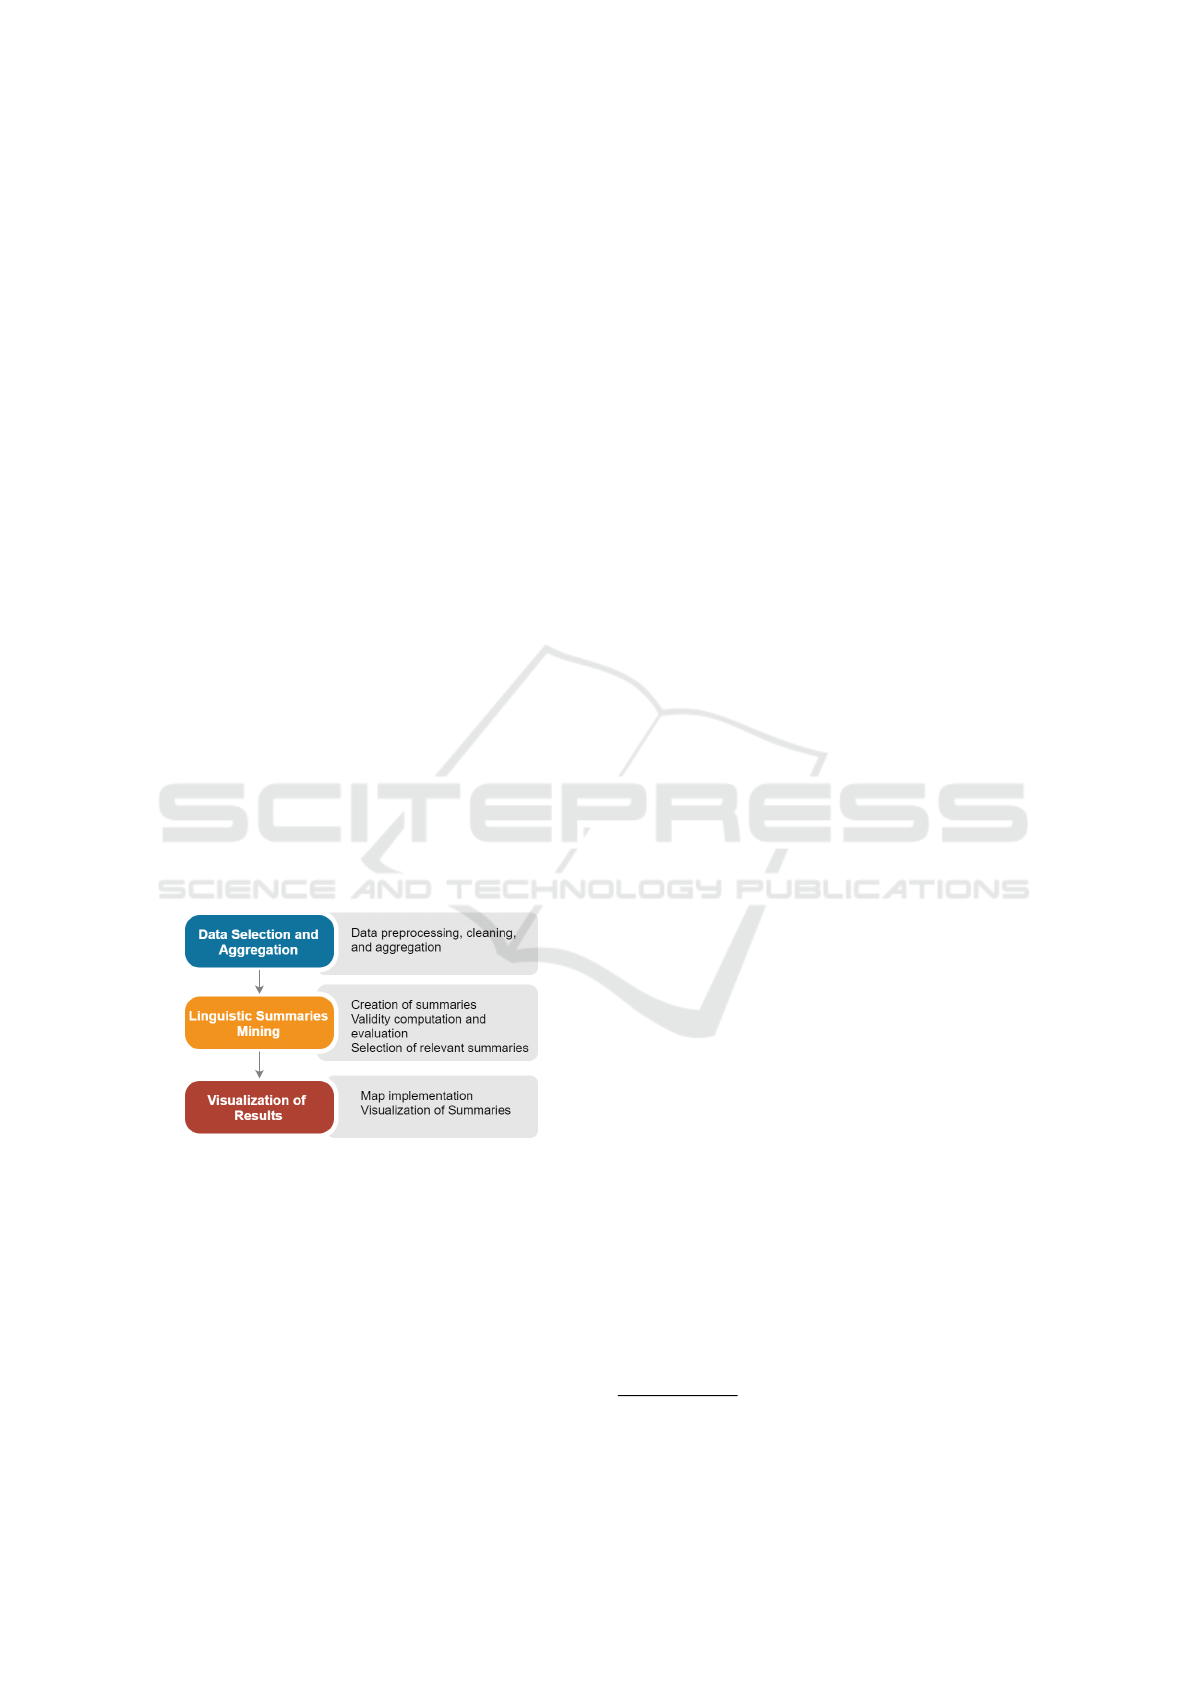
The development of the artifact that enables
mining linguistic summaries from traffic data
consisted of three main stages: i) data selection and
aggregation; ii) linguistic summaries mining; and,
iii) visualization of results. Figure 1 outlines the
method followed in the artifact design and the main
steps conducted in each stage.
Figure 1: Method followed in the development of the
artifact.
Details about such stages and intermediate
operations are presented in the following sections.
3.1 Data Selection and Aggregation
Two data sources were used in the development of the
artifact:
1. DB
1
- Traffic Message Channel-based records:
The first data source is formed by traffic
messages delivered through the Traffic Message
Channel (TMC) technology (GAO and WEN,
2007) and processed by the Swiss national
competence center for traffic, during 2020. Such
messages record a variety of incidents that may
cause traffic anomalies (e.g., traffic congestion,
accidents, road works, and events) and they are
reported to the competence center for traffic by
traffic monitoring responsible (e.g., road police
and municipalities).
Given the large number of recorded messages,
the following steps were conducted to select the
records of interest.
(a) Entries whose description included the
following words (translated from German)
were selected: traffic, stagnant, heavy traffic,
lost time, waiting time, and speed is limited.
(b) Events that lasted more than one day (e.g.,
constructions on the road) were neglected.
(c) Only events that took place on the main
highways of Switzerland
1
were considered
(i.e., A1 - A9, A12 - A14, A16, A18, A21,
A22, and A40).
(d) The reasons for the traffic anomalies were also
deducted from the text descriptions. The
reasons of interest of our partner were:
construction site, accident, fire, storm, and
overload.
(e) The duration in hours of the traffic anomalies
was computed according to the guidelines
provided by the data partner.
2. DB
2
- Traffic Criticality Score: This is a database
derived from a type-2 fuzzy logic inference
system. This system uses TMC messages and
GPS floating data to provide a score between 0
and 1; this score depicts the traffic criticality of
zones (i.e., not critical, low critical, critical, and
highly critical) that belong to the city of Bern,
Switzerland.
This data source was the result of a previous
effort of the authors (Pincay et al. (2021)
forthcoming). The whole available database was
used for this work.
3.2 Linguistic Summaries Mining
According to Maybury (1999), summarization
consists of determining the most relevant parts of
information from a source to produce a version of it
that is of interest to a user. In this research effort, the
linguistic summaries were created following a
1
https://www.astra.admin.ch/astra/de/home/themen/
nationalstrassen/nationalstrassennetz/neb.html
Mining Linguistic Summaries in Traffic
171
data-driven approach. This means that summaries
were generated according to a set of predefined
quantifiers and predicates, and selected according to
their validity.
The linguistic summaries research task was
defined as (Liu, 2011; Hudec, 2016):
f ind Q, S, R
sub ject to
Q ∈
¯
Q, R ∈
¯
R, S ∈
¯
S, v(Q, S, R) ≥ β (3)
where
¯
Q is a set of quantifiers of interest,
¯
R and
¯
S
are sets of relevant linguistic expressions for
restriction and summarizer respectively, and β is
threshold value from the (0, 1] interval. Each of the
possible solutions creates a linguistic summary of the
form (Q
∗
, R
∗
are S
∗
).
For the DB
1
, the objective was to unveil all
relevant LSs over the duration of all the traffic
incidents. The quantifier set
¯
Q was defined with the
linguistic terms few, about half, and most. On the
other hand, the summarizers of the normalized
duration in hours
¯
S were short, medium, long, and
very long.
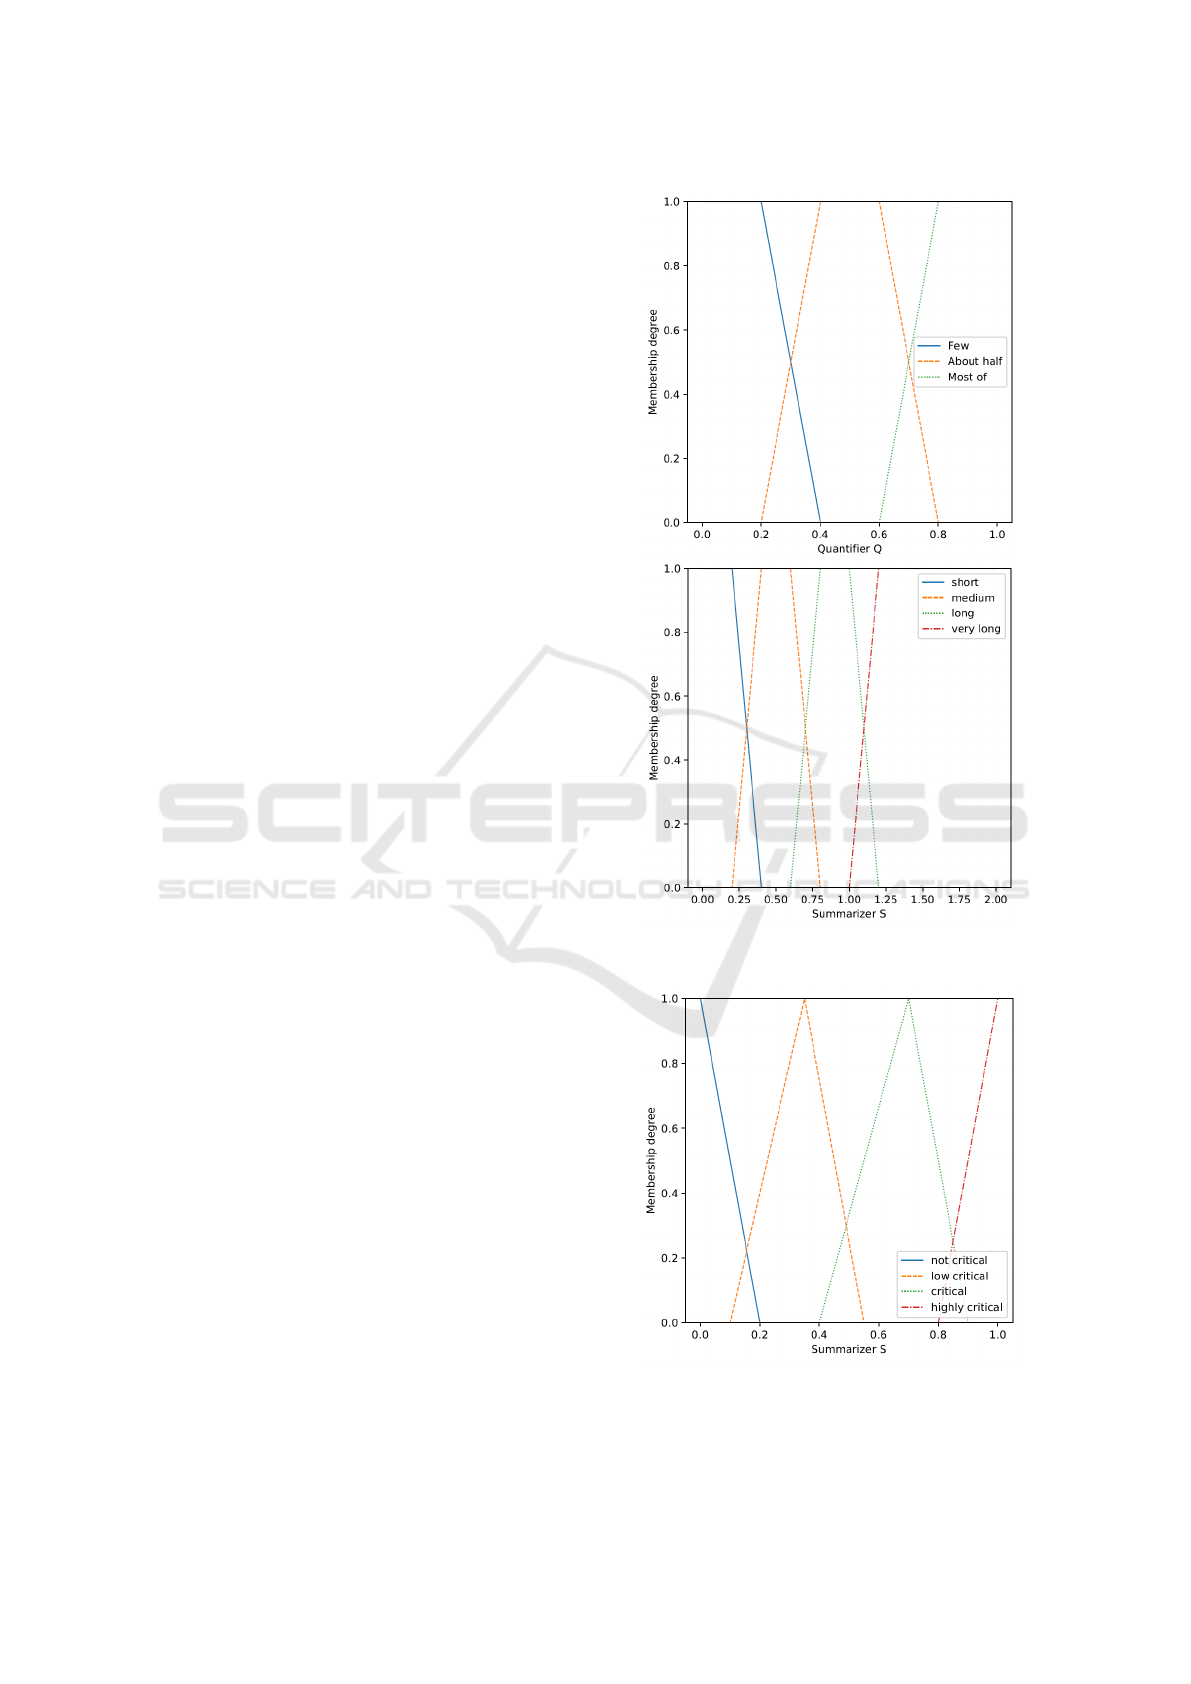
For the sake of this work, the the linguistic
expressions for restriction
¯
R were not taken into
consideration as they did not add value. Figure 2
presents a plot of the quantifiers and summarizers
used to mine the LSs from DB
1
.
For DB2 the same quantifier as the previous case
was used. For the traffic criticality score, the terms
set of summarizers
¯
S were not critical, low critical,
critical, and highly critical. Figure 3 depicts the plot
of summarizers used to mine the LSs from DB2.
Furthermore, all LSs resulting from the
combination of the quantifiers and summarizers were
generated and their validity was computed (see
Equation 2). Ultimately, only the summaries with
validity greater or equal to 0.6 (β ≥ 0.6) were
considered as relevant and therefore selected. The
value of 0.6 was chosen given the results obtained
from the data and after consultation with our data
partners about how the traffic incidents occur, based
on their experience.
3.3 Visualization of Results
Maps were generated using the geospatial
information of DB
1
and DB
2
. The most relevant
summaries accompanied the maps besides the
absolute numbers of the traffic anomalies duration
and criticality score.
The maps and the summaries were later used to
perform evaluations with users. The resulting
visualizations are presented in subsection 4.3.
Figure 2: Plot of the term sets for the quatifiers and
summarizers of DB
1
.
Figure 3: Plot of the term sets for summarizers of DB
2
.
FCTA 2021 - 13th International Conference on Fuzzy Computation Theory and Applications
172

4 RESULTS
The implementation results of the artifact built upon
the methods explained in Section 3 are presented next.
The Python programming language was used to
perform the data selection and the framework
Django was used to build a functional web
application to display the maps and the summaries to
the users. The library Simpful (Spolaor et al., 2020),
a Python library for fuzzy logic reasoning, was used
to define the linguistic variables for the quantifiers
¯
Q
and summarizers
¯
S (see subsection 3.2) and to
perform the evaluations over the data. Finally, the
library Folium was used to create the maps.
4.1 Data Selection and Aggregation
After the data selection and aggregation process was
completed, the DB
1
had 68 7644 sampling records.
Each of the records was described in terms of 15
fields among which there were timestamps of the
start and end of the event, geographical coordinates
and names of the start and end locations, duration,
description of the event, and the cause of the traffic
anomaly.
On the other hand, the DB
2
had 67 643 records
and their fields contained the GPS coordinates of the
zones with information available, timestamps, and
criticality scores.
Moreover, the data of DB
1
and DB
2
were
integrated into a single PostgreSQL database to
make it a available to the Django web application.
4.2 Linguistic Summaries Mining
Through the functions of the library Simpful, the
linguistic values depicting the quantifiers and
summarizers defined in subsection 3.2 were
implemented in Python. Furthermore, the validity of
all the potential summaries (i.e., a combination of all
summarizers and quantifiers) was computed to
discover the ones that are valid and relevant.
This process was executed for DB
1
and DB
2
.
Table 1 presents the validity results for all possible
LSs that could be obtained from the duration of all
traffic anomalies existing in DB1, however, only the
ones in bold (i.e., with validity greater or equal than
0.6) are relevant and thus are the ones that describe
the database properly.
Moreover, given that DB
1
contained information
at finer granularity (i.e., causes of the traffic incident
and name of the highways), further summaries were
mined. For instance, for the highway A12, the
following summaries were obtained:
Table 1: Validity values of LSs created from the linguistic
terms sets from the duration of all traffic incidents of DB
1
.
Linguistic Summary v(Qx(P(x)))
Few of the incidents had a
short duration
0
Few of the incidents had a
medium duration
0.19
Few of the incidents had a
long duration
0.45
Few of the incidents had a
very long duration
0.75
About half of the incidents had a
short duration
0.72
About half of the incidents had a
medium duration
0.43
About half of the incidents had a
long duration
0.37
About half of the incidents had a
very long duration
0.25
Most of of the incidents had a
short duration
0
Most of of the incidents had a
medium duration
0
Most of of the incidents had a
long duration
0
Most of of the incidents had a
very long duration
0
• Few of the incidents were caused by road works,
validity: 1
• most of the incidents were caused by congestion,
validity: 0.64
• Few of the incidents were caused by accidents,
validity: 0.63
For the entire DB
2
, four valid summaries were
obtained. For instance, one of them was Few of the
traffic zones are highly critical which had a validity
of 0.9346. Moreover, given that this database was
smaller than DB
1
and that it only covered the city of
Bern, it was decided to split the dataset by dayparts
(i.e., morning, midday, afternoon, evening, and
night) and mine LSs from each subset. However, the
valid summaries were almost the same for each
daypart.
4.3 Visualization of Results
Map visualizations with the data of both databases
and the valid linguistic summaries were created.
Through a web application, the users were able to
visualize the total amount of hours over the year
2020 when more traffic anomalies occurred.
Moreover, the users were able to visualize the results
Mining Linguistic Summaries in Traffic
173
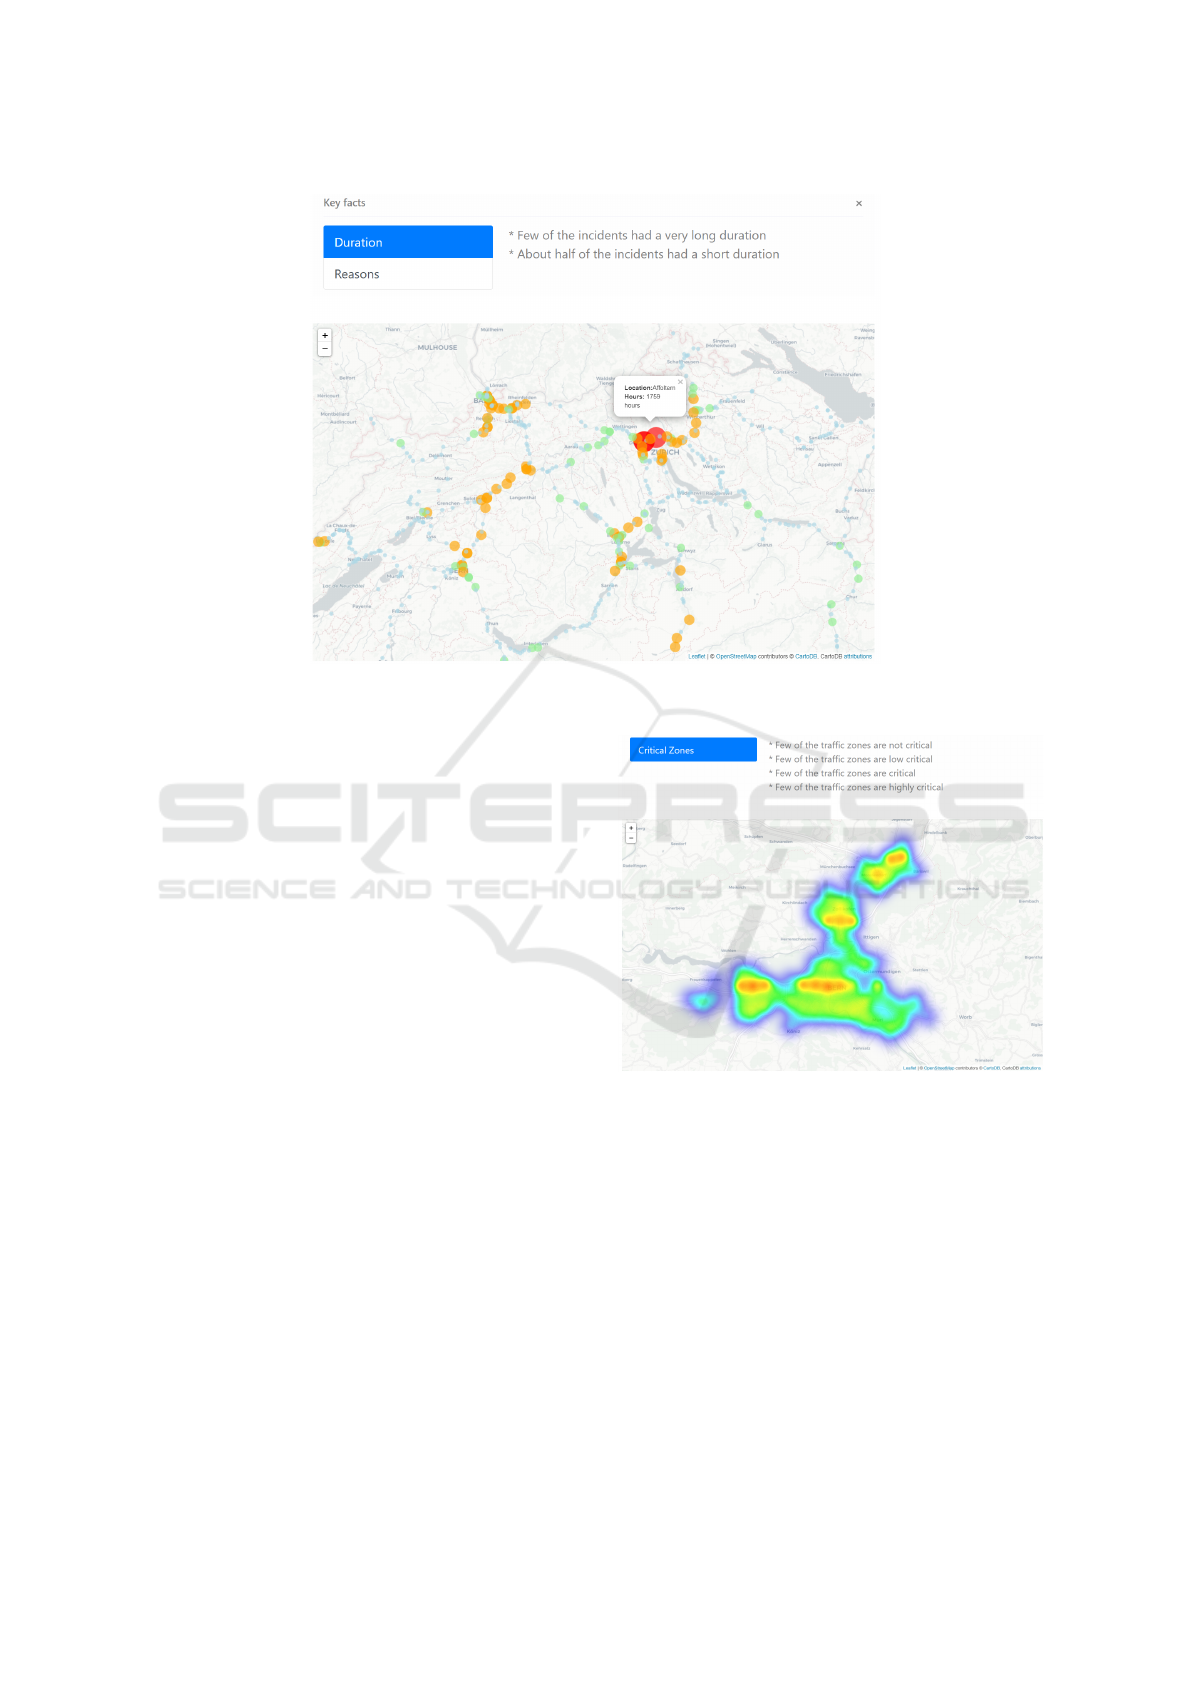
Figure 4: Example of the visualization results and linguistic summaries for the data of DB
1
. The color of the circles depicts
the total time of the traffic events and the size of the number of records on the specific location.
of all the highways (see subsection 3.1) or to show
results given a previous selection. It was also
possible for the users to filter the results by the cause
of the incident.
For the DB
1
two interfaces were created. The first
one displays the summary of the total hours together
with a map and the second one shows Key facts
which correspond to the mined linguistic
summarizations. Figure 4 shows an example of the
visualization presented to the user, in the upper part
the valid summaries for the whole network are
presented as Key facts and in the lower part the map
with the zones where there are traffic anomalies; The
color of the circles depicts the total time of the traffic
events and the size of the number of records on the
specific location..
Additionally, both interfaces were later used to
evaluate the perceived utility of the linguistic
summaries (see subsection 4.4).
A similar process was implemented for the data
of the DB
2
, however, only one interface was
implemented as the data was of a different nature and
it represented a more abstract concept than traffic
anomalies duration. Figure 5 depicts an example of
the way the data of this database was displayed. For
this case, a heatmap depicting the areas with higher
criticality was implemented. Moreover, users were
able to select the daypart from where they wanted to
observe the critical areas.
Figure 5: Example of the visualization results and linguistic
summaries for the data of DB
2
.
4.4 User’s Evaluations
Aiming to validate how useful users with no
experience in traffic analysis find the mined
summaries, a survey was conducted.
The survey was answered by 20 people. Among
them, 72% had some interest or were interested in
traffic information and facts. Moreover, 95% of them
considered that they had no experience with traffic
data analysis.
The respondents were asked to observe the
visualizations for the data of DB
1
and DB
2
with and
without the summaries. Around 63% of the people
FCTA 2021 - 13th International Conference on Fuzzy Computation Theory and Applications
174

manifested that having the key facts or summaries
helped them to understand what the map was about
in the case of the data of DB
1
. For the visualization
of the DB
2
, 90% found the summaries useful to
understand the map. However, 72% manifested that
the concept of traffic criticality was not clear enough
and a similar number specified that these summaries
were not that informative enough. Moreover, around
82% of the respondents answered that having the
summaries contributed to understanding in an easier
fashion the data displayed.
Despite the encouraging results, around 60% of
the respondents manifested that the summaries were
rather basic and that they could be more informative
if they were more detailed. This led to infer that the
obtained summaries were perceived as useful but not
enough to offer the users a comprehensive
explanation of the information provided.
5 SUMMARY AND LESSONS
LEARNED
This research effort presents the results of a case
study that seeks to ease the understanding of
heterogeneous traffic data. Through the mining of
linguistic summaries, this endeavor aims at providing
straightforward descriptions of traffic anomalies
duration and events to inform citizens in a more
effective manner.
Three main stages constituted the method that
guided this development: i) data selection and
aggregation; ii) linguistic summaries mining; and,
iii) visualization of results. The data selection and
aggregation allowed us to obtain the subset of
messages of interest coming from a larger TMC
system and to obtain the duration in hours over the
year 2020 of the events related to traffic anomalies of
the main highways of Switzerland. Moreover, a
dataset that scores the traffic criticality of different
locations of the city of Bern was also used. The
linguistic summaries mining process enabled
identifying and validating linguistic summaries
obtained from the data. With the visualization of
results, it was possible to present to users map
visualizations of the databases alongside key facts or
summaries obtained from the data to facilitate the
comprehension of the information provided.
The visualizations and summaries were
implemented through a Python-based web
application and several users evaluated the perceived
usefulness of the summaries provided. It was found
that the summaries were perceived as helpful to
understand the information in a seamless manner but
that they were not detailed enough to have a deep
understanding of the whole data.
As per the lessons learned, special attention
should be given to the validation process of the
summaries. Given that the goal of using LSs is to
convey meaningful information, the LSs need to be
meaningful themselves. Moreover, the mining
process has to be optimized from the implementation
perspective too, since evaluating and aggregating
large databases requires considerable computation
power. Furthermore, we consider that LSs are also a
convenient alternative when it comes to exchange
data that could be sensitive.
Despite the related work, this research efforts
project distinguishes itself given its praxis-oriented
nature, transdisciplinarity, and real-life data used in
the implementation. Furthermore, this initiative
contributes to being leveraged towards making
information more comprehensive to all citizens and
not only those with technical knowledge. The results
obtained in this work can be further be used as a
basis to develop solutions in the field of green
logistics, urban planning, and traffic control. Future
work will focus on improving the visualization tool
and obtaining summaries with finer granularity;
another aspect that is going to be studied is how to
combine the validity of the summaries and existing
quality measures to improve the perceived utility of
the obtained summaries (as studied in Hudec et al.
(2020a)). Additionally, given the data distribution, it
might be necessary to study the validity of the
summaries by regions to understand if the data
distribution causes skewed summaries or the likes of
it.
ACKNOWLEDGEMENT
The authors would like to thank the members of the
Human-IST Institute at the University of Fribourg for
contributing with valuable thoughts and comments.x
We especially thank Viasuisse and the Secretariat
of High Education, Science, Technology, and
Innovation (SENESCYT) of Ecuador, for their
support to conduct this research.
REFERENCES
Aftabuzzaman, M. (2007). Measuring traffic congestion-
a critical review. In 30th Australasian Transport
Research Forum.
Alvarez-Alvarez, A., Sanchez-Valdes, D., Trivino, G.,
S
´
anchez,
´
A., and Su
´
arez, P. D. (2012). Automatic
Mining Linguistic Summaries in Traffic
175

linguistic report of traffic evolution in roads. Expert
Systems with Applications, 39(12):11293–11302.
Boran, F. E., Akay, D., and Yager, R. R. (2016). An
overview of methods for linguistic summarization
with fuzzy sets. Expert Systems with Applications,
61:356–377.
Colombo, M., Hurle, S., Portmann, E., and Sch
¨
afer,
E. (2020a). A framework for a crowdsourced
creation of smart city wheels. In 2020 Seventh
International Conference on eDemocracy &
eGovernment (ICEDEG), pages 305–308. IEEE.
Colombo, M., Nguyen, M. T., and Pincay, J. (2020b).
Tutorial: Towards human-centered smart city
solutions. In 2020 Seventh International Conference
on eDemocracy & eGovernment (ICEDEG), pages
3–5. IEEE.
GAO, Y. and WEN, H.-m. (2007). Technique and
standardization research of radio data system-traffic
message channel (rds-tmc). Journal of Transportation
Systems Engineering and Information Technology, 3.
Hadorn, G. H., Biber-Klemm, S., Grossenbacher-Mansuy,
W., Hoffmann-Riem, H., Joye, D., Pohl, C.,
Wiesmann, U., and Zemp, E. (2008). The emergence
of transdisciplinarity as a form of research. In
Handbook of transdisciplinary research, pages 19–39.
Springer.
Hevner, A. and Chatterjee, S. (2010). Design science
research in information systems. In Design research
in information systems, pages 9–22. Springer.
Hudec, M. (2016). Fuzziness in information systems.
Springer International Publishing, pages 67–99.
Hudec, M. (2019). Possibilities for linguistic summaries in
cognitive cities. In Designing Cognitive Cities, pages
47–84. Springer.
Hudec, M., Bedn
´
arov
´
a, E., and Holzinger, A. (2020a).
Augmenting statistical data dissemination by short
quantified sentences of natural language. Journal of
Official Statistics (JOS), 36(4).
Hudec, M., Vu
ˇ
ceti
´
c, M., and
ˇ
Cerm
´
akov
´
a, I. (2020b). The
synergy of linguistic summaries, fuzzy functional
dependencies and land coverings for augmenting
informativeness in smart cities. In 2020 28th
Telecommunications Forum (TELFOR), pages 1–4.
IEEE.
Kacprzyk, J. and Zadrozny, S. (2009). Protoforms of
linguistic database summaries as a human consistent
tool for using natural language in data mining.
International Journal of Software Science and
Computational Intelligence (IJSSCI), 1(1):100–111.
Liu, B. (2011). Uncertain logic for modeling human
language. Journal of Uncertain Systems, 5(1):3–20.
Maybury, M. (1999). Advances in automatic text
summarization. MIT press.
Pincay, J., Mensah, A. O., Portmann, E., and Ter
´
an,
L. (2020a). Forecasting travel times with space
partitioning methods. In GISTAM, pages 151–159.
Pincay, J., Portmann, E., and Ter
´
an, L. (2020b). Towards a
computational intelligence framework to smartify the
last-mile delivery. POLIBITS, 62:85–91.
Pincay, J., Portmann, E., and Ter
´
an, L. (2021). Fuzzifying
geospatial data to identify critical traffic areas.
Popek, G., Kowalczyk, R., and Katarzyniak, R. P. (2011).
Generating descriptions of incomplete city-traffic
states with agents. In Foundations of Intelligent
Systems, pages 105–114. Springer.
Spolaor, S., Fuchs, C., Cazzaniga, P., Kaymak, U.,
Besozzi, D., and Nobile, M. S. (2020). Simpful:
A user-friendly python library for fuzzy logic.
International Journal of Computational Intelligence
Systems, 13(1):1687–1698.
Trivino, G., Sanchez, A., Montemayor, A. S., Pantrigo,
J. J., Cabido, R., and Pardo, E. G. (2010). Linguistic
description of traffic in a roundabout. In International
Conference on Fuzzy Systems, pages 1–8. IEEE.
Yager, R. R. (1982). A new approach to the summarization
of data. Information Sciences, 28(1):69–86.
Zadeh, L. A., Klir, G. J., and Yuan, B. (1996). Fuzzy
sets, fuzzy logic, and fuzzy systems: selected papers,
volume 6. World Scientific.
FCTA 2021 - 13th International Conference on Fuzzy Computation Theory and Applications
176
