
Continuous Parameter Control in Genetic Algorithms using Policy
Gradient Reinforcement Learning
Alejandro de Miguel Gomez
1 a
and Farshad Ghassemi Toosi
2 b
1
Just Eat Takeaway.com, Madrid, Spain
2
Department of Computer Science, Munster Technological University, Cork, Ireland
Keywords:
Reinforcement Learning, Genetic Algorithms.
Abstract:
Genetic Algorithms are biological-inspired optimization techniques that are able to solve complex problems by
evolving candidate solutions in the search space. Their evolutionary features rely on parameterized stochastic
operators that are sensitive to changes and, ultimately, determine the performance of the algorithms. In recent
years, Reinforcement Learning has been proposed for online parameter control in contrast to traditional fine-
tuning, which inevitably leads to suboptimal configurations found through extensive trial-and-error. In this
regard, the current literature has focused on value-based Reinforcement Learning controllers for Genetic Al-
gorithms without exploring the advantages of policy gradient methods in such environments. In this study, we
propose a novel approach to leverage the continuous nature of the latter with agents that learn a behavior pol-
icy and enhance the performance of Genetic Algorithms by tuning their operators dynamically at runtime. In
particular, we look at Deep Deterministic Policy Gradient (DDPG) and Proximal Policy Optimization (PPO).
The resulting hybrid algorithms are tested on benchmark combinatorial problems and performance metrics are
discussed in great detail considering the existing work based on Q-Learning and SARSA.
1 INTRODUCTION
Since the late 1990s, parameter calibration in Evo-
lutionary Algorithms has gained increasing attention
from researchers for a key reason (Eiben et al., 1999)
- the optimal performance of any metaheuristic opti-
mization technique is highly dependent on parameter
settings. Over the years, the literature has converged
to a concrete classification of strategies (Karafotias
et al., 2014b) that can be pursued in order to accom-
plish this part of the development work: i) Parameter
tuning consist in setting parameters and operators be-
fore running an algorithm and keep them frozen dur-
ing the run. Alternatively, ii) parameter control is
aimed at updating the parameters and operators dy-
namically at runtime according to the current state of
the search.
Parameter tuning in Evolutionary Algorithms still
remains the typical approach for most applications.
However, it is time consuming and requires exten-
sive trial-and-error experimentation. Additionally,
the parameter performance landscape is not static,
a
https://orcid.org/0000-0002-5327-6436
b
https://orcid.org/0000-0002-1105-4819
thus a given set of parameters may not be appro-
priate for all the stages of the search process. This
has been empirically shown in several studies (Eiben
et al., 1999), (Karafotias et al., 2014b) and (Aleti and
Moser, 2016). On the other hand, parameter con-
trol methodologies use deterministic rules and adap-
tive feedback mechanisms for adjusting the param-
eters during the optimization. These techniques are
prone to take short-sighted decisions as they are built
on top of immediate estimations of the results ob-
tained (Sakurai et al., 2010). Moreover, they represent
very specific models applied to concrete parameters
that are hard to fit into the broader field.
Over the last decade, a number of surveys around
this area (Karafotias et al., 2014b) highlighted the
lack of effective general-purpose strategies for cali-
brating Evolutionary Algorithms. Nevertheless, it is
becoming clear that the answer could be found in
automated systems capable of understanding the op-
timization’s evolutionary dynamics and guiding the
search accordingly. In this regard, Reinforcement
Learning techniques have been proposed as an univer-
sal alternative to the existing parameter control mech-
anisms (Drugan, 2019). The design of these algo-
de Miguel Gomez, A. and Toosi, F.
Continuous Parameter Control in Genetic Algorithms using Policy Gradient Reinforcement Learning.
DOI: 10.5220/0010643500003063
In Proceedings of the 13th International Joint Conference on Computational Intelligence (IJCCI 2021), pages 115-122
ISBN: 978-989-758-534-0; ISSN: 2184-2825
Copyright
c
2021 by SCITEPRESS – Science and Technology Publications, Lda. All rights reserved
115

rithms allow them to learn a decision policy by maxi-
mizing the expected value of a reward function in the
long-run. This makes them appropriate controllers for
overseeing the internals of Evolutionary Algorithms
and focus on the success of a dynamic optimization
process by taking optimal decisions at each time step.
In this paper, we are going to assess the per-
formance of a novel approach for continuous pa-
rameter control in Genetic Algorithms using two
widely-known policy gradient Reinforcement Learn-
ing methods in the context of combinatorial optimiza-
tion problems. In particular, we are going to answer
the following research questions:
• RQ1: Do DDPG and PPO policy gradient
methods outperform the existing Q-Learning and
SARSA value-based controllers?
• RQ2: How does the learning overhead of DDPG
and PPO policy gradient algorithms compare
to value-based methods with Q-Learning and
SARSA?
• RQ3: What is the performance gain from using
policy gradient continuous parameter control as
opposed to offline parameter tuning?
• RQ4: Can DDPG and PPO policy gradient con-
trollers generalize to larger instances of the same
optimization problem?
2 DESIGN AND
IMPLEMENTATION
The main components of Reinforcement Learning
problems with respect to the task of parameter con-
trol are:
• Agent: A Reinforcement Learning algorithm.
• Environment: A genetic algorithm for solving an
optimization problem.
• State: The set of features that describe the status
of the optimization at a particular time step.
• Action: The probability of crossover and muta-
tion applied in the environment at a particular time
step.
• Reward: A function that provides feedback to the
agent based on the effect of its actions on the en-
vironment.
In this study, the implementation of the agents fol-
lows the original design proposed by the authors of
DDPG (Lillicrap et al., 2015), PPO (Schulman et al.,
2017), Q-Learning (Dayan and Watkins, 1992) and
SARSA (Rummery and Niranjan, 1994).
2.1 Optimization Problems
Three benchmark problems are selected for running
experiments. Please note they all fall under the cat-
egory of NP and consequently their optimal solution
can be verified in polynomial time.
2.1.1 N-Queen
In the game of chess, the queen is one of the most ver-
satile pieces that can move horizontally, vertically and
diagonally all across the board. The N-Queen puzzle
is a classic constraint satisfaction problem in Com-
puter Science and Evolutionary Algorithms, in which
the goal is to place N queens on a NxN chessboard
so that no queens attack each other by being on the
same column, row or diagonal. Originally, it was in-
troduced by chess composer Bezzel (Olson, 1993) in
1848 as the 8-queen problem, and later extended to N
queens.
2.1.2 OneMax
OneMax (H
¨
ohn and Reeves, 1996) is an extensively
studied test problem for Evolutionary Computation.
The goal is to maximize the number of ones in a
bit string or list of length N. The task is very well
suited for Genetic Algorithms as the binary encoding
of the candidate solutions matches the expected chro-
mosome representation directly.
2.1.3 Password Cracker
The Password Cracker is a combinatorial problem
inspired by the Infinite Monkey Theorem, which
is a proposition that was firstly conceptualized by
Borel (E.Borel, 1913) and became a popular example
to illustrate simple concepts of probability.
Standard modern computers can produce 96
unique ASCII character codes that range from 32 to
127 - including uppercase and lowercase letters, dig-
its, punctuation marks and various symbols. There-
fore, a password can be represented as a list of inte-
gers of length equal to the number of characters in a
given string, and, consequently, it is possible to use
this encoding for chromosome representation in an
evolutionary optimizer. The goal is to maximize the
number of ASCII codes matching the target password
through evolution, paying attention to the order of the
characters in the text.
2.2 Genetic Operators
The design of the optimizer follows closely the de-
fault configuration implemented in PyGAD (Pygad,
ECTA 2021 - 13th International Conference on Evolutionary Computation Theory and Applications
116

2021). The operators that are responsible for the dy-
namics of the environment regardless of the parame-
ter control strategy applied to the algorithm are: ran-
dom initialization, roulette-wheel selection, single-
point crossover and flip-bit mutation.
2.3 State Space
The state representation of the environment encapsu-
lates enough information for an agent to learn a pol-
icy. The literature around parameter control for Ge-
netic Algorithms has largely adopted a set of three in-
dicators that seemingly matches this definition (Dru-
gan, 2019).
Firstly, average fitness of the population
¯
f is cal-
culated across the existing individuals in the most re-
cent generation. Secondly, the best population fit-
ness score is simply the best candidate solution to
the problem max( f ) in the current generation. Lastly,
entropy-based population diversity H( f ) is a measure
of fitness heterogeneity in the population using Shan-
non’s entropy from information theory. Ultimately,
the goal is to obtain a quantitative indicator of the
fitness distribution, so that the entropy is minimized
when all the individuals in the population are equally
fitted, and maximized when the fitness scores are uni-
formly distributed.
H( f ) = −
N
∑
i=1
P( f
i
)logP( f
i
)
This environment has been designed to work with
both continuous and discrete state spaces. In the for-
mer, an agent receives a set of real-valued features.
For the latter, it requires a preprocessing step to cre-
ate a finite number of states. For this purpose, we
have simply followed the most common approach in
the literature and created equally sized bins for all the
features (Karafotias et al., 2014a).
2.4 Action Space
Reinforcement Learning agents are expected to learn
optimal values for two fundamental parameters in
Evolutionary Computation according to the state of
the optimization: the crossover and mutation prob-
ability. We have developed an environment that is
able to handle continuous and discrete actions so that
learning algorithms of different nature can be trained
on the same task. For the former, the action space con-
siders the full range of valid crossover and mutation
rates from 0 to 1. Alternatively, in the discrete action
space setup, the agent chooses among a finite num-
ber of actions that have been discretized in advance.
Following the literature’s design choice (Karafotias
et al., 2014a), we firstly create equally sized bins of
crossover and mutation probabilities, and these are
applied to the environment by uniformly sampling a
float number from the interval of values the agent’s
selected bin or action belongs to.
2.5 Reward
One of the main challenges in Reinforcement Learn-
ing applications concerns the design of the reward
function. The agent adapts its behavior based on feed-
back provided by the environment and this is expected
to be informative enough to guide the learning algo-
rithm towards the goal. In the context of parameter
control in Genetic Algorithms, it is required to answer
the following question: “How do Genetic Algorithms
optimize the best?”.
The existing literature has widely focused on a
reward definition based on the relative improvement
from the best parent of the previous generation to
the best child in the current one. This definition
overcomes the credit assignment problem in Rein-
forcement Learning (Dulac-Arnold et al., 2015) but
it is prone to return misleading cumulative rewards
throughout the episode due to the nature of the calcu-
lation - that is the sum of immediate relative improve-
ments over time.
Nevertheless, a simpler reward function that takes
into account the impact on cumulative rewards, and
the one we implemented for this work, could be just
the average fitness of the resulting population
¯
f
t
af-
ter performing an action. Thus, the agent will try to
increase the average fitness at each generation, which
eventually leads to the problem’s optimal solution. In
fact, this answers the question we stated earlier: Ge-
netic Algorithms optimize the best by maximizing the
average fitness of the population.
2.6 Measuring Performance
We propose three tasks for each benchmark problem
that range from easily solvable to highly constrained
environments with respect to the search space.
Firstly, baseline configurations are set according
to the population size and number of generations that
a vanilla genetic algorithm with default parameters
has a probability of finding the optimal solution in the
90th percentile. We then create two extra configura-
tions of larger instances that have to be solved under
the same population and generations conditions. Con-
sequently, these are more challenging problems as the
search space has increased while the sample size, it-
erations and memory available is limited to the initial
scenario.
Continuous Parameter Control in Genetic Algorithms using Policy Gradient Reinforcement Learning
117

Table 1: Experimental configurations of environments
for measuring performance and runtime of Reinforcement
Learning controllers. Population size and number of gener-
ations are set to 100 and 1,000, respectively, for each exper-
iment.
Problem Size Search Space
N-Queen 8, 12, 15 n
n
OneMax 30, 35, 40 2
n
Password Cracker 8, 10, 12 96
n
We test the performance of two value-based meth-
ods, Q-Learning and SARSA, and two policy gra-
dient agents, DDPG and PPO. These algorithms are
benchmarked against the genetic algorithm with de-
fault crossover and mutation rate to measure the per-
formance gain from using intelligent systems for pa-
rameter control. The role of the default values is to
set the baseline results from an effort-less run without
fine tuning. In this regard, we follow the approach of
popular software such as MATLAB and Simulink
1
,
which mutation and crossover rates default to 1% and
80%, respectively.
After training Reinforcement Learning algorithms
on each configuration shown in Table 1, agents are
then evaluated on 100 runs to account for the stochas-
tic component in the population initialization step.
The training and testing environments are seeded dif-
ferently to make sure the behavior policy can be ap-
plied on unseen but similar conditions. The results
are aggregated in the form of performance metrics by
taking the average of the following indicators:
• Success Rate: Percentage of times the optimal
solution was found.
• Steps: Number of generations to find the optimal
solution.
• Best Fitness: Fitness value of the best individual
found at the last generation.
• Trajectory: Total number of generations per run.
• Policy Processing Time: Percentage of system
and user CPU time the algorithm spent processing
a state and selecting an action for the environment.
This is also referred to as learning overhead.
• Runtime: Total amount of system and user CPU
time measured in seconds per run.
We measure CPU processing time instead of wall time
to exclude other non process-wide computations in
the background. Similarly, we differentiate between
steps and trajectory to evaluate the episodes where the
optimal solution was found in isolation from unsuc-
cessful runs.
1
https://es.mathworks.com/help/gads/genetic-
algorithm-options.html.
2.7 Evaluating Scalability
In the field of Machine Learning, models are usually
evaluated based on their ability to generalize to new
data of which the underlying distribution is represen-
tative of the training distribution. Similarly, in Evo-
lutionary Computation, generalization can be under-
stood as the ability to behave optimally on different,
larger optimization landscapes - also known as scal-
ability. It is common sense that in this scenario the
distribution of the training data no longer matches the
task and it’s expected to see a drop in the performance
of Reinforcement Learning algorithms.
Table 2: Experimental configurations for evaluating scal-
ability in Reinforcement Learning controllers. Population
size and number of generations are set to 100 and 1,000,
respectively, for each experiment.
Problem Training Test
N-Queen 8 [8, 15]
OneMax 30 [30, 40]
Password Cracker 8 [8, 12]
We evaluate the rate of success of controllers
trained on the smallest instance of each task on larger
search spaces of the same problem - Table 2 shows
the problem sizes used for test and training. This is
benchmarked against a genetic algorithm with default
parameter values of 80% and 1% for crossover and
mutation rate, respectively, to measure the unfitness
of the policies as the size of the tasks increases. The
results are aggregated over a 100 tests runs to mitigate
the stochastic component in the algorithms.
3 EVALUATION AND RESULTS
This section is aimed at providing a clear overview
around the performance and scalability of policy gra-
dient and value-based algorithms for parameter con-
trol on the benchmark problems introduced earlier.
3.1 N-Queen
Reinforcement Learning controllers have outper-
formed the vanilla genetic algorithm on every con-
figuration of the N-Queen problem overall, show-
ing higher success rate and faster convergence - see
Table 3. As the search space increases, there is a
clear degradation in performance in spite of the con-
troller applied. Regardless, DDPG has managed to
learn policies that reported significantly better results
(RQ1).
Policy gradient agents spent 8% to 12% of the run-
time processing the state and selecting an action for
ECTA 2021 - 13th International Conference on Evolutionary Computation Theory and Applications
118
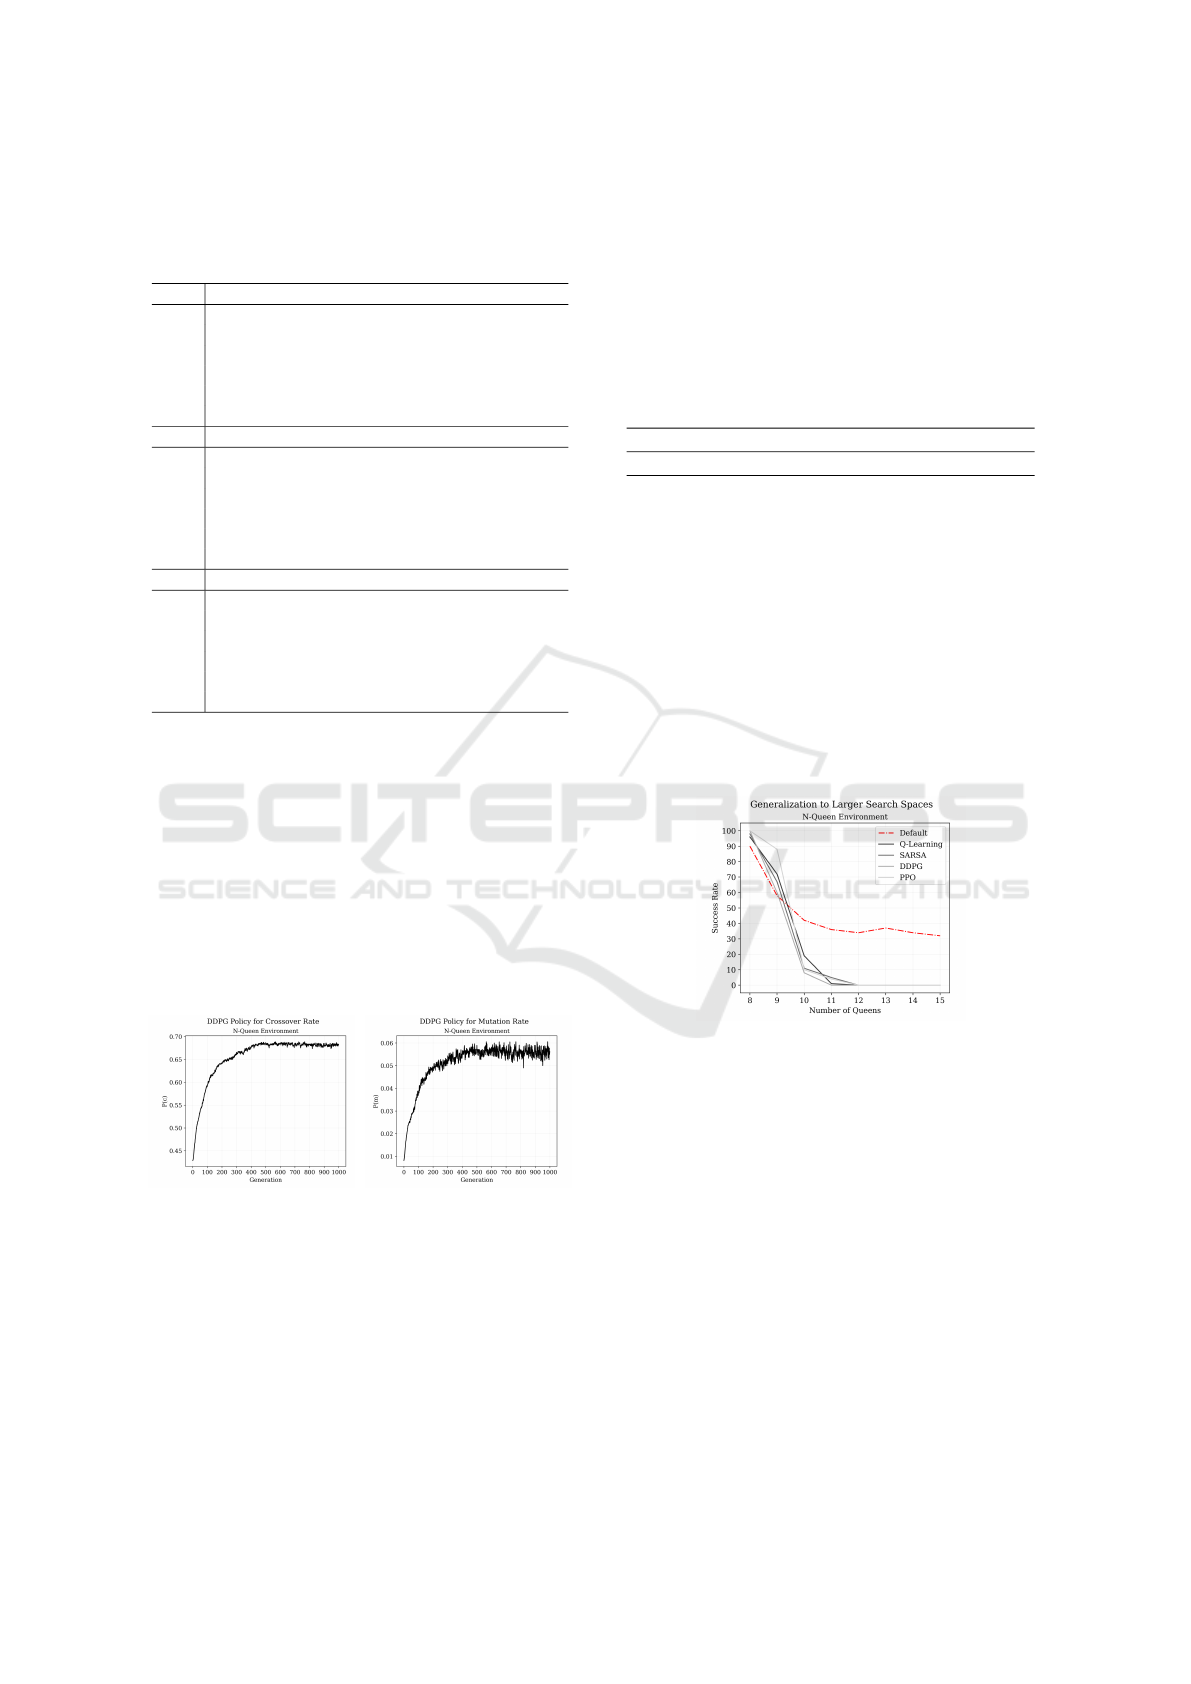
Table 3: Averaged performance results across 100 randomly
initialized test instances of the N-Queen problem for sizes
8, 12 and 15. SR: Success Rate, S: Steps, BF: Best Fitness,
PPT: Policy Processing Time, RT: Runtime.
S8 Default Q-L SARSA DDPG PPO
SR 90% 96% 98% 100% 100%
S 124.4 165.1 114.4 144.3 128.5
BF 85% 98% 99% 100% 100%
T 387.1 198.4 132.2 144 128.5
PPT 0.0% 0.2% 0.2% 10.1% 12.7%
RT 1.0s 1.3s 0.9s 1.0s 0.9s
S12 Default Q-L SARSA DDPG PPO
SR 34% 62% 68% 84% 66%
S 382.9 300.4 304.9 330.7 300.4
BF 67.0% 81.0% 84.0% 92.0% 83.0%
T 790.2 566.3 527.3 437.8 538.2
PPT 0.0% 0.1% 0.1% 8.4% 6.35%
RT 6.7s 4.0s 3.5s 3.3s 4.9s
S15 Default Q-L SARSA DDPG PPO
SR 32% 50% 59% 67% 60%
S 393.8 458.6 435.7 457.8 350.2
BF 65.5% 74.83% 79.1% 83.5% 80.0%
T 806.0 729.3 667.0 636.7 610.1
PPT 0.0% 0.1% 0.1% 8.7% 7.1%
RT 13.1s 7.3s 6.1s 6.0s 6.5s
the environment. This highlights the computational
cost of querying a neural network as opposed to tab-
ular methods, which action selection represents be-
tween 0.17% and 0.24% of the total runtime (RQ2).
Still, DDPG produces faster runs on average than the
rest of configurations thanks to the higher success
rate.
The policy of the best performing algorithm,
DDPG, can be visualized by averaging the crossover
and mutation probability at each generation of the 100
randomly initialized test runs on the largest N-Queen
problem - see Figures 1 and 2.
Figure 1: DDPG’s crossover
policy on 15-Queen.
Figure 2: DDPG’s mutation
policy on 15-Queen.
There is a clear pattern in the agent’s behavior in-
dicating that both parameters need to be adjusted in
the same direction as if they were determined by a
logarithmic function. Assuming this is the optimal
policy to the problem, we could state that an appro-
priate set of fixed parameters for a vanilla genetic al-
gorithm are the average mutation and crossover rate
of the policy. For this particular case, the crossover
probability is 65.64% and the mutation probability
is 5.11%. Towards measuring the performance gain
from applying Reinforcement Learning for contin-
uous parameter control, the baseline genetic algo-
rithm with default parameters can be updated with the
average crossover and mutation rate extracted from
DDPG’s policy.
Table 4: Parameter tuning on 15-Queen using DDPG’s av-
erage crossover (65.64%) and mutation (5.11%) rate.
SR S BF T PPT RT
55% 520.6 75.33% 736.3 0.0% 7.2s
The results in Table 4 suggest that controlling the
parameters of a genetic algorithm in an online fashion
contributes positively to enhancing the overall per-
formance of the optimizer on the N-Queen problem
(RQ3). Additionally, it also confirms that the ini-
tial default crossover and mutation rates of 80% and
1% are not optimal for this problem - the success
rate of the genetic algorithm increased from 32% to
55%. Despite the additional computational resources
required for querying the neural network’s policy, the
optimizer using DDPG for continuous control has
proven to run faster than the configuration with tuned
parameters.
Figure 3: Success rate of Reinforcement Learning con-
trollers trained on the N-Queen problem of size 8 and tested
on instances up to 15.
With regard to the agents’ generalization ability,
we have observed that the controllers trained on the
8-queen problem failed considerably at solving in-
stances of larger sizes (RQ4) - see Figure 3.
One can infer that a policy can not be extended
to search spaces other than the one it was origi-
nally trained. This not only showcases how well
control policies can fit a specific problem but also
highlights the limitations of Reinforcement Learn-
ing agents with respect to developing applications at
scale.
Continuous Parameter Control in Genetic Algorithms using Policy Gradient Reinforcement Learning
119
3.2 OneMax
The OneMax problem has shown to be a task that
is highly sensitive to crossover and mutation rates
for different problem sizes. The genetic algorithm
with default parameters drastically reduced its perfor-
mance on larger instances of the problem while the
controllers maintained a reasonable level of conver-
gence - the results are presented in Table 5.
These experiments have also shined some light on
the improved performance of policy gradient meth-
ods over value-based algorithms. Specifically, both
DDPG and PPO have performed significantly better
than Q-Learning and SARSA overall, showing higher
rates of success and taking fewer steps to find the op-
timal solution (RQ1). In this regard, PPO is the most
suited controller for this task.
Table 5: Averaged performance results across 100 randomly
initialized test instances of the OneMax problem for sizes
30, 35 and 40. SR: Success Rate, S: Steps, BF: Best Fitness,
PPT: Policy Processing Time, RT: Runtime.
S30 Default Q-L SARSA DDPG PPO
SR 99% 99% 100% 100% 100%
S
266.2 238.6 211.9 257.7 249.8
BF 99.9% 99.9% 100% 100% 100%
T 273.6 243.3 211.9 257.7 249.8
PPT 0.0% 0.2% 0.2% 8.3% 10.9%
RT 2.1s 2.1s 2.0s 2.3s 2.1s
S35 Default Q-L SARSA DDPG PPO
SR 63% 83% 85% 91% 96%
S 486.7 477.1 441.3 486.2 432.2
BF 98.9% 99.5% 99.6% 99.7% 99.8%
T 676.6 589.1 571.2 501.6 454.8
PPT 0.0% 0.1% 0.1% 8.1% 9.3%
RT 5.9s 5.3s 5.0s 4.8s 4.1s
S40 Default Q-L SARSA DDPG PPO
SR 6% 61% 53% 66% 78%
S 397.7 510.4 492.6 460.9 522.7
BF 96.6% 98.7% 98.1% 98.8% 99.3%
T 963.9 723.4 756.3 698.1 627.7
PPT 0.0% 0.1% 0.1% 6.4% 10.2%
RT 9.3s 7.9s 8.4s 7.1s 6.9s
The policy processing time of controllers using
function approximation ranges values between 6%
and 10% depending on the problem size and algo-
rithm (RQ2). In larger environments, the operators
are expected to process more genetic information,
consequently, the relative time spent selecting an ac-
tion gets progressively reduced. Nevertheless, our re-
sults show that PPO has the lowest runtimes and high-
est rates of success, followed by DDPG.
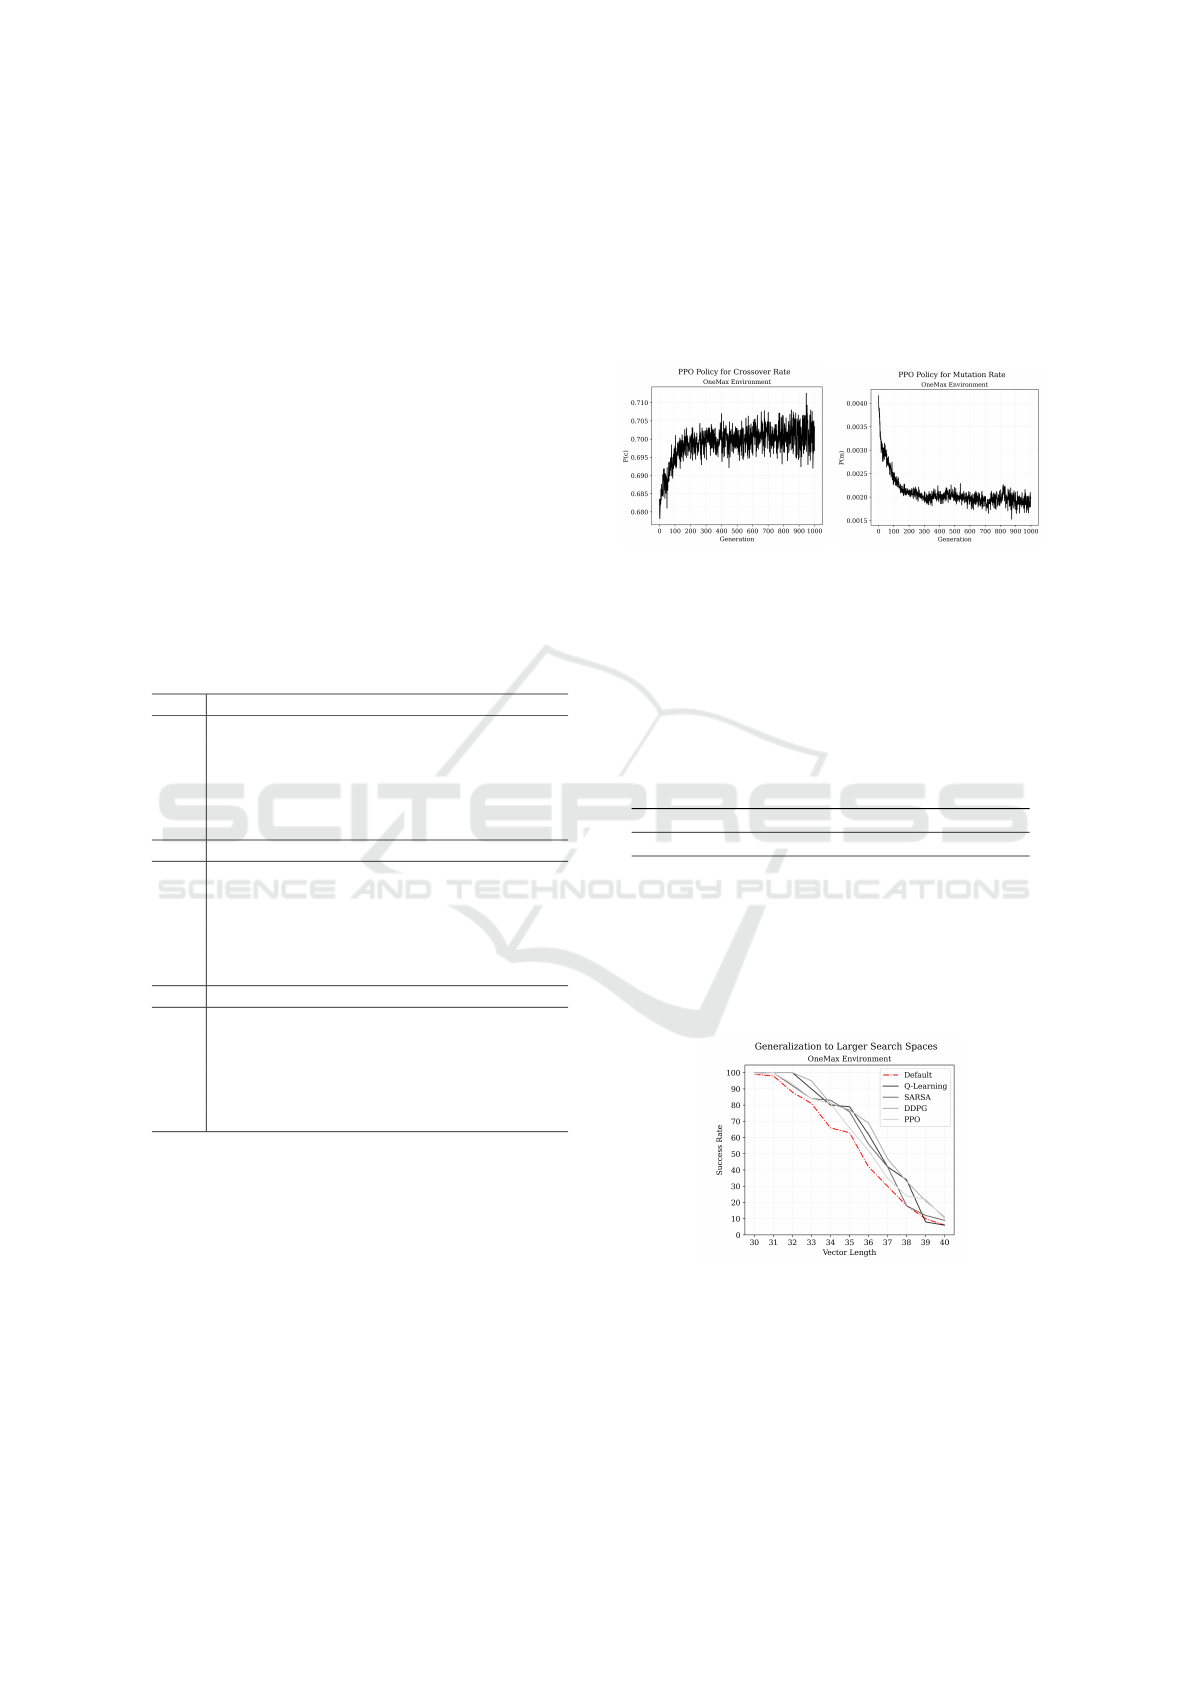
PPO’s policy can be approximated by averaging
the crossover and mutation rate for each time step of
the 100 test runs performed on the OneMax problem
of largest size - see Figure 4 and 5.
The agent updates both parameters in opposite di-
rections following a different strategy from the one
we described in the previous section. In this case,
the mutation rate shows exponential decay while the
crossover rate experiences logarithmic growth. The
overall average of these parameters are 0.20% and
60.89%, respectively.
Figure 4: PPO’s crossover
policy on OneMax-40.
Figure 5: PPO’s mutation
policy on OneMax-40.
Assuming these are the optimal fine tuned values
for a genetic algorithm without parameter control, we
can compare the performance of the traditional ap-
proach to the hybrid optimizer enhanced with Rein-
forcement Learning.
Table 6: Parameter tuning on OneMax-40 using PPO’s av-
erage crossover (60.89%) and mutation (0.20%) rate.
SR S BF T PPT RT
69% 533.8 99.2% 637.6 0.0% 6.2s
The results in table Table 6 indicate that this new
set of parameters are better suited for the task - the
rate of success of the genetic algorithm increased con-
siderably from 6% to 69%. Still, it doesn’t outperform
the algorithm using PPO for online parameter control,
which finds the optimal solution more frequently with
little added runtime (RQ3).
Figure 6: Success rate of Reinforcement Learning con-
trollers trained on the OneMax problem of size 30 and
tested on instances up to 40.
From the scalability stand point, according to the
results in Figure 6, the policies learnt for the smallest
task were not able to successfully solve larger opti-
mization landscapes (RQ4). Nevertheless, as opposed
ECTA 2021 - 13th International Conference on Evolutionary Computation Theory and Applications
120
to the N-Queen problem, the genetic algorithm with
default parameters experienced a similar drop in per-
formance to the controllers.
3.3 Password Cracker
The Password Cracker is the task with the largest
search space among the benchmark problems pro-
posed
2
.
Table 7: Averaged performance results across 100 randomly
initialized test instances of the Password Cracker problem
for sizes 8, 10 and 12. SR: Success Rate, S: Steps, BF: Best
Fitness, PPT: Policy Processing Time, RT: Runtime.
S8 Default Q-L SARSA DDPG PPO
SR 95% 100% 100% 100% 100%
S 456.3 143.2 211.6 303.6 176.5
BF 99.2% 100% 100% 100% 100%
T 483.5 143.2 211.6 303.6 176.5
PPT 0% 0.3% 0.3% 13.7% 15.3%
RT 2.2s 0.4s 0.5s 1.7s 1.0s
S10 Default Q-L SARSA DDPG PPO
SR 48% 90% 73% 93% 90%
S 680.1 480.0 610.6 429.6 557.9
BF 93.5% 98.4% 97.3% 99.3% 98.9%
T 849.6 532.0 715.7 469.6 606.6
PPT 0.0% 0.3% 0.3% 13.0% 14.6%
RT 4.4s 3.0s 3.5s 2.8s 3.7s
S12 Default Q-L SARSA DDPG PPO
SR 21% 37% 12% 44% 50%
S 796.5 645.6 757.7 726.2 640.4
BF 90.2% 93.4% 92.2% 94.0% 94.8%
T 957.3 868.9 970.9 879.5 820.2
PPT 0.0% 0.2% 0.2% 12.3% 12.6%
RT 5.4s 5.0s 5.0s 5.6s 5.4s
From the very first configuration of size 8, the
vanilla genetic algorithm performs comparably worse
than the algorithms enhanced with Reinforcement
Learning - see Table 7. Additionally, most parame-
ter control policies resulted in less than 50% rate of
success on the largest problem size except for PPO
(RQ1). It is also worth mentioning that SARSA is
the worst performing controller on this problem. In
fact, the genetic algorithm with default parameters re-
ported better results than SARSA on the 12-character
long password.
The state and action processing steps by policy
gradient algorithms takes around 12% to 15% of the
total runtime (RQ2). This is the highest contribution
recorded so far considering the benchmark problems
presented earlier. The reason is the reduced number of
2
The target passwords for the experiments were gen-
erated randomly using an online generator at https://
passwordsgenerator.net/.
computations performed by the genetic operators due
to the smaller chromosome size for this specific task,
which makes the learning overhead relatively more
costly.
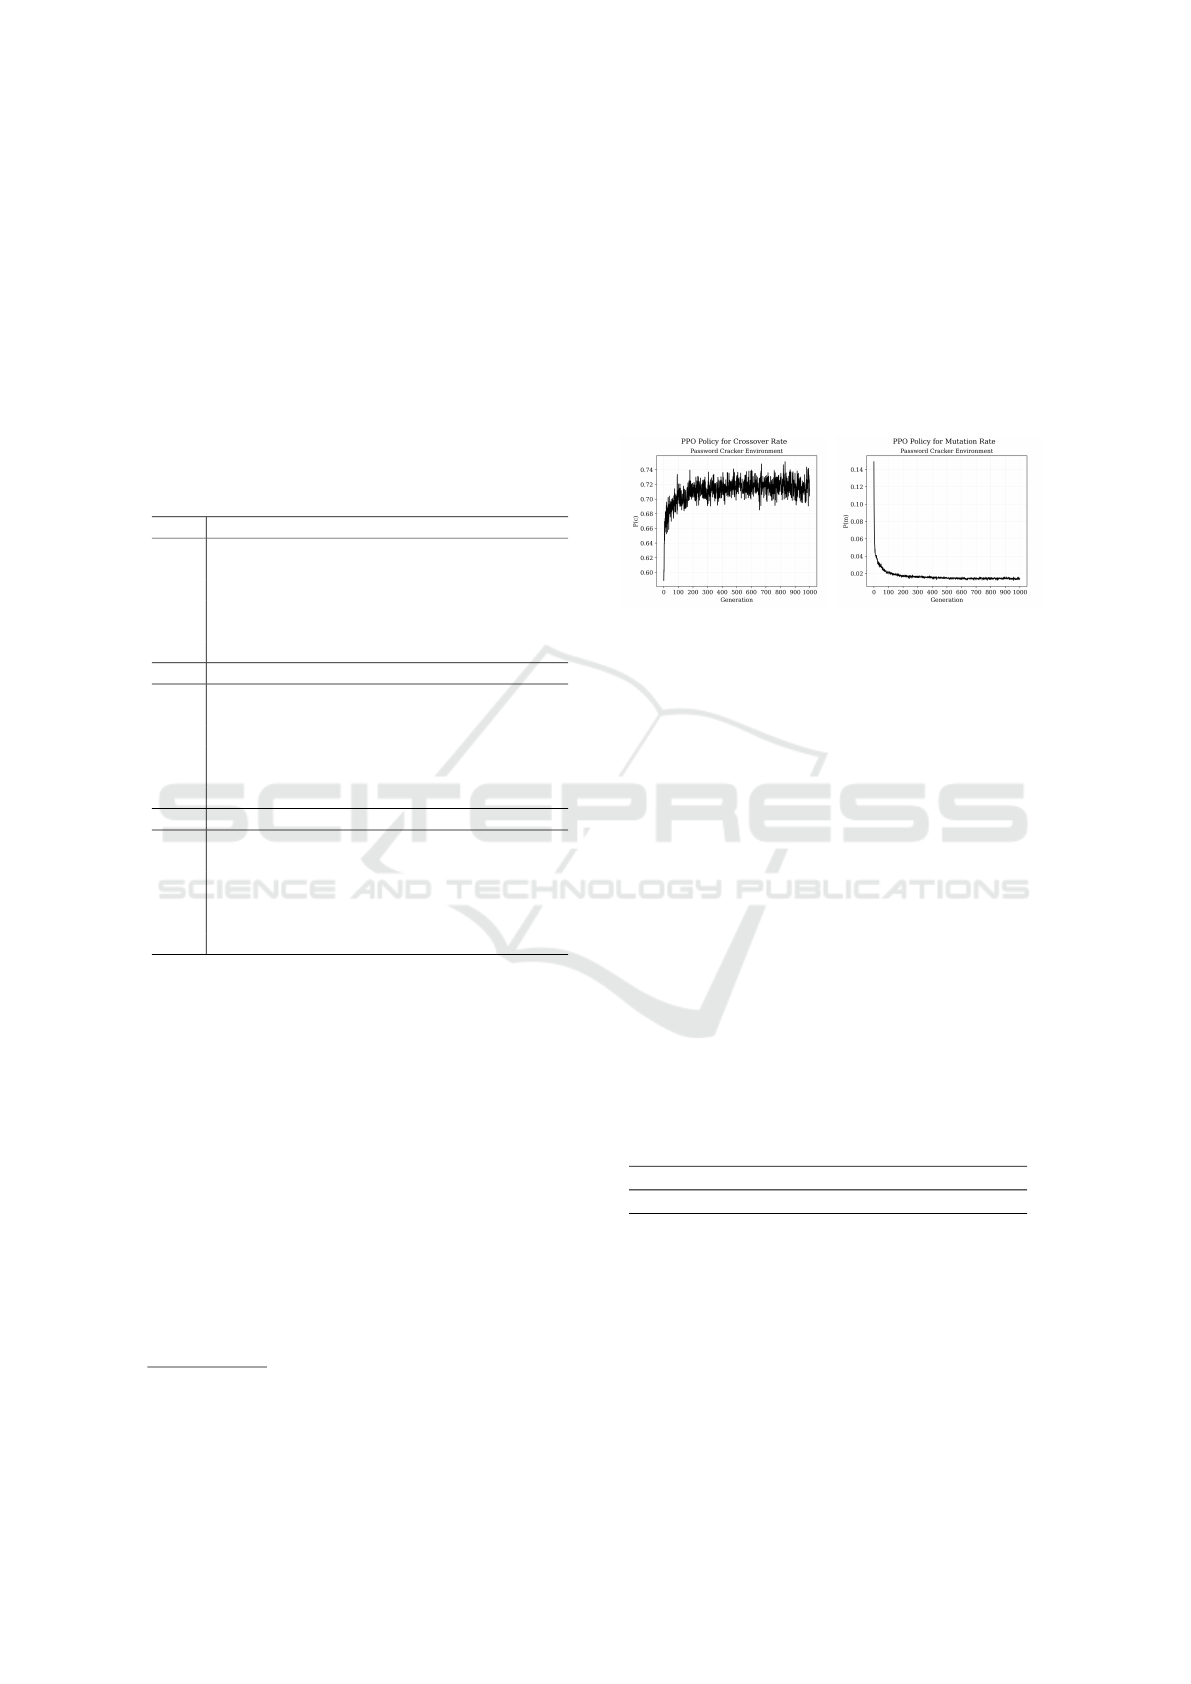
In the light of the results, PPO is considered the
best performing controller on the Password Cracker.
Consequently, we evaluate further the policy that was
applied to the largest problem by computing the aver-
age of the crossover and mutation rate at each gener-
ation across 100 test runs - see Figures 7 and 8.
Figure 7: PPO’s crossover
policy on Password-12.
Figure 8: PPO’s mutation
policy on Password-12.
The agent sets lower crossover rates and higher
mutation probabilities at the beginning of the op-
timization to build diversity within the population.
As new generations of individuals are created, it re-
duces the probability of mutation exponentially and
increases the rate of crossover logarithmically. This
translates into more candidate solutions generated by
chromosomes recombination and less stochasticity in
the environment. Ultimately, the algorithm is trying
to balance the level of exploration and exploitation at
each time step.
The average parameter values extracted from the
policy for crossover and mutation rate are 71.19% and
1.70%, respectively. As it has been shown on pre-
vious sections, running the vanilla genetic algorithm
on this set of values can reveal information about the
controller’s contribution to the performance of the op-
timizer.
Table 8: Parameter tuning on Password-12 using PPO’s av-
erage crossover (71.19%) and mutation (1.70%) rate.
SR S BF T PPT RT
32% 684.2 93.2% 898.9 0.0% 5.1s
Considering the results in Table 8, PPO’s control
policy handles the optimization process more effec-
tively than parameter tuning (RQ3). Moreover, run-
time statistics show that it does not achieve such per-
formance at the cost of substantial longer runs, but
rather improves the algorithm’s search strategy. The
agent’s ability to generalize has been assessed us-
ing the shortest password containing 8 characters for
training and applying the resulting policy on larger in-
Continuous Parameter Control in Genetic Algorithms using Policy Gradient Reinforcement Learning
121

stances up to 12 characters including - see Figure 9.
Figure 9: Success rate of Reinforcement Learning con-
trollers trained on the Password Cracker problem of size 8
and tested on instances up to 12.
The performance degradation of Reinforcement
Learning controllers (RQ4) strengthens the idea that
small changes in the search space greatly contribute
to the dynamics of the environment, which are usu-
ally described as problem-dependent. It also demon-
strates that policy gradient algorithms driven by func-
tion approximation aren’t especially useful for ex-
panding policies to new optimization landscapes.
4 CONCLUSIONS
Reinforcement Learning controllers have proven to be
effective methods for boosting the rate at which Ge-
netic Algorithms find the optimal solution to a given
problem, resulting in hybrid optimizers with reduced
running times and faster convergence. This is par-
ticularly noticeable in our novel contribution with
DDPG and PPO continuous policy gradient algo-
rithms, which outperformed Q-Learning and SARSA
discrete value-based approaches in the vast majority
of test environments despite the associated learning
overhead of querying a neural network. Moreover,
this work also suggested that even a fine tuned ge-
netic algorithm with appropriate crossover and muta-
tion rates may not perform optimally as long as these
remain fixed throughout the generations.
Lastly, this study highlighted the fact that Rein-
forcement Learning agents do not generalize well to
larger instances of the problem they were initially
trained on. Conversely, a genetic algorithm with de-
fault parameter values performed comparatively bet-
ter on larger search spaces of the same task. Regard-
less, with respect to the traditional approach to param-
eter control, the successful application of continuous
policy gradient methods opens the door to a branch
of hybrid optimization algorithms that can deal with
the dynamics of a stochastic process optimally in an
effortless manner, bringing together two fields of Ar-
tificial Intelligence that could determine the next gen-
eration of Evolutionary Algorithms.
REFERENCES
Aleti, A. and Moser, I. (2016). A systematic literature re-
view of adaptive parameter control methods for evolu-
tionary algorithms. ACM Computing Surveys (CSUR),
49(3):1–35.
Dayan, P. and Watkins, C. (1992). Q-learning. Machine
learning, 8(3):279–292.
Drugan, M. M. (2019). Reinforcement learning versus
evolutionary computation: A survey on hybrid al-
gorithms. Swarm and evolutionary computation,
44:228–246.
Dulac-Arnold, G., Evans, R., van Hasselt, H., Sunehag,
P., Lillicrap, T., Hunt, J., Mann, T., Weber, T., De-
gris, T., and Coppin, B. (2015). Deep reinforcement
learning in large discrete action spaces. arXiv preprint
arXiv:1512.07679.
E.Borel (1913). M
´
ecanique statistique et irr
´
eversibilit
´
e.
pages 189–196.
Eiben,
´
A. E., Hinterding, R., and Michalewicz, Z. (1999).
Parameter control in evolutionary algorithms. IEEE
Transactions on evolutionary computation, 3(2):124–
141.
H
¨
ohn, C. and Reeves, C. (1996). The crossover landscape
for the onemax problem.
Karafotias, G., Eiben, A. E., and Hoogendoorn, M. (2014a).
Generic parameter control with reinforcement learn-
ing. Proceedings of the 2014 Annual Conference on
Genetic and Evolutionary Computation.
Karafotias, G., Hoogendoorn, M., and Eiben,
´
A. E. (2014b).
Parameter control in evolutionary algorithms: Trends
and challenges. IEEE Transactions on Evolutionary
Computation, 19(2):167–187.
Lillicrap, T. P., Hunt, J. J., Pritzel, A., Heess, N., Erez, T.,
Tassa, Y., Silver, D., and Wierstra, D. (2015). Contin-
uous control with deep reinforcement learning. arXiv
preprint arXiv:1509.02971.
Olson, A. T. (1993). The eight queens problem. Journal
of Computers in Mathematics and Science Teaching,
12(1):93–102.
Pygad (2021). pygad Module — PyGAD 2.13.0 documen-
tation.
Rummery, G. A. and Niranjan, M. (1994). On-line Q-
learning using connectionist systems, volume 37. Uni-
versity of Cambridge, Department of Engineering
Cambridge, UK.
Sakurai, Y., Takada, K., Kawabe, T., and Tsuruta, S. (2010).
A method to control parameters of evolutionary algo-
rithms by using reinforcement learning. pages 74–79.
IEEE.
Schulman, J., Wolski, F., Dhariwal, P., Radford, A., and
Klimov, O. (2017). Proximal policy optimization al-
gorithms. arXiv preprint arXiv:1707.06347.
ECTA 2021 - 13th International Conference on Evolutionary Computation Theory and Applications
122
