
Is It Possible to Recognize Apple Employees by Their LinkedIn Profile
Picture?
Thanakij Wanavit
a
and Leslie Klieb
b
Business and Technology, Webster University Thailand, 1 Empire Tower, Sathorn Rd., Bangkok 10120, Thailand
Keywords:
Convolutional Neural Networks, Emotion Recognition, Employment at Apple, EmoPy, Random Forest
Classifier, Classifying Employment from Emotions.
Abstract:
Samples of images from the portraits on the profiles of members of the social media site LinkedIn who live in
the Bay Area of San Francisco were collected and analyzed by the EmoPy package for the presence of seven
emotions. A Random Forest classifier used these probabilities to predict if the members were employed by
Apple or not. Accuracy reached around 62% compared with a naive error rate of 50%. An error analysis shows
that this result is significant and robust. A connection between the data and Apple’s organizational culture is
pointed out.
1 INTRODUCTION
Is it possible to find out from profile pictures on a so-
cial network where people work? This position pa-
per will suggest that the use of neural networks and
machine learning can indeed accomplish this in some
circumstances. Employment at one of the FAANG
(Facebook, Apple, Amazon, Netflix, Google) compa-
nies as a software developer is surrounded by an aura
of mystique. The Internet abounds with people, es-
pecially computer science students, searching for an-
swers to the question of how to get hired by one of
those prestigious companies. Most answers on the
Internet focus on skill sets, ability to answer inter-
view questions, and other cognitive advantages. The
research question of this work tries to answer a re-
lated question focusing on non-cognitive differences.
Is it possible to find differences between male soft-
ware engineers working for Apple, Inc. and those
working for other companies in the San Francisco
Bay Area that are sufficient to classify those employ-
ees as Apple or non-Apple employees, and that have
no connection with background, skills, or other obvi-
ous cognitive characteristics? In order to answer that
question, a sample of LinkedIn profiles was scraped
from the LinkedIn website searching for current em-
ployment at Apple or not Apple, and for location in
the Bay Area. No other information was collected
a
https://orcid.org/0000-0001-7291-394X
b
https://orcid.org/0000-0002-0881-5330
or retained. As an example of a characteristic that is
not cognitive, the research uses machine learning and
neural network technologies to determine a numeri-
cal estimate of the emotional content present in the
photographs. Note that those images are photographs
chosen by the employees themselves with the pur-
pose to present a professional look that is, in com-
bination with the other content in the profile, attrac-
tive for headhunters and others interesting in hiring
developers. The Random Forest statistical algorithm
is trained on a set of those images. It is found that the
software is indeed able to make classifications with a
small but significant success rate.
2 WHY APPLE?
An experiment like this has only a chance to succeed
when a few conditions are met. The core of employ-
ees must be in some sense sufficiently distinct from
the employees at other companies. This is in the Bay
Area true for Apple.
Firstly, Apple is sufficiently large that a reason-
ably size random sample could be collected. That is
not true for smaller companies.
Secondly, the company is focused on innovation
(Podolny and Hansen, 2020). It renews its products
offerings every one or two years. Steve Jobs estab-
lished for this purpose a culture of competition be-
tween groups inside the company. This is a large dif-
Wanavit, T. and Klieb, L.
Is It Possible to Recognize Apple Employees by Their LinkedIn Profile Picture?.
DOI: 10.5220/0010642300003063
In Proceedings of the 13th International Joint Conference on Computational Intelligence (IJCCI 2021), pages 277-284
ISBN: 978-989-758-534-0; ISSN: 2184-3236
Copyright © 2023 by SCITEPRESS – Science and Technology Publications, Lda. Under CC license (CC BY-NC-ND 4.0)
277

ference with other companies with more established
products. It will attract a special kind of developer.
Thirdly, working for the Apple company is glam-
orous and they can pick their staff to a much higher
degree than smaller software companies can do. Dif-
ferently from what might be thought, Apple does not
dominate the software developing industry in Silicon
Valley. There are less developers working at Apple
than at Google in the Bay Area. It was estimated that
in May 2016 there were 41,490 application software
developers and 28,670 systems software developers in
the Bay Area. An estimate for the number of software
developers at Apple is around 12,000-16,000. There-
fore it is possible for Apple to be picky in who they
hire, not only in skills but also as fit to a quite different
company culture. (Anonymous, 2017)
3 PROCESS OVERVIEW
In this short section an overview of the analysis pro-
cess is given. Details and references are in the
Methodology section. The steps are the following:
• Collect LinkedIn profile pictures of three different
samples
– Male Apple employees in the Bay Area of San
Francisco with occupation computer software
(Apple=true, Control=false)
– Male non-Apple employees in the Bay Area of
San Francisco, same occupation (Apple =false,
Control=false)
– Male employees, any occupation, from the
USA ( Apple=false, Control = true)
Those three categories are shown in Table 2.
• The EmoPy package provides in one package ob-
ject detection and recognition of seven emotions:
anger, fear, calm, sadness, happiness, surprise,
and disgust
• Statistical analysis of the differences between the
three samples
4 LITERATURE OVERVIEW
Every company depends for its survival on a steady
stream of new personnel that via a process of on-
boarding will become a good fit in skills, character,
motivation, assimilation of the organizational culture,
and other traits. It is therefore to be expected that
there are differences between employees who work
for a company like Apple and for other companies.
The selection will start already at the reading of the
resumes and looking at LinkedIn profiles, and can
lead to differences in the two groups that are ampli-
fied at every stage, from interview and hiring deci-
sion, to turnover and retention (Marsden, 1994) Im-
plicit or explicit biases might be present that influence
this process (Bendick and Nunes, 2012).
Social media profiles have been found to repre-
sent the personality of individuals (Back et al., 2010).
Relationships between characteristics of pictures and
personality were found in Facebook profile pictures
by (Celli et al., 2014). As different companies can
attract different types of people and those differences
can be discernible by AI in the profile pictures on So-
cial Media, it is an interesting issue to see if in the
reverse direction, the profile pictures are sufficiently
distinct so that it is possible to classify the employees
according to the company.
5 METHODOLOGY
Sampling was automated using Selenium. It was car-
ried out by searching LinkedIn from an apparent lo-
cation in the USA at the “search for people” tab with
filter “company: Apple, location: San Francisco Bay
Area, occupation: computer software, sex: male”,
and keeping every second result. Similarly, results
were collected for non-Apple employees in the Bay
Area with the same filter but not working for Ap-
ple. A control group had as filter “is in the United
States” and not working for Apple. The search rou-
tine stored the profile picture, occupation, and com-
pany but no other information. There were 851 Apple
employees, 416 non-Apple employees, and 517 “con-
trol” LinkedIn members in the sample.
The freely available open source EmoPy package
(Perez, 2017) from Thoughtworks (Perez, 2018b),
(Perez, 2018a) was the main tool to extract emotions
from the LinkedIn image set. Extraction of the deeper
information in an image is possible using a combina-
tion of a trained object detection Convolutional Neu-
ral Network (CNN) followed by classification CNN.
This is demonstrated by an emotion extraction pack-
age such as EmoPy (Perez, 2018c). EmoPy uses ma-
chine learning to recognize the presence and strength
of the expression of seven universal (not depending
on cultural artifacts) standard emotions (anger, fear,
calm, sadness, happiness, surprise, and disgust) in ev-
ery image. The tool itself consists of a number of
CNN layers interspersed with pooling layers that de-
crease the amount of information when it gets too
large. The EmoPy package comes with a series of
default pre-trained models. One of the pre-trained
NCTA 2021 - 13th International Conference on Neural Computation Theory and Applications
278

Table 1: EmoPy parameters.
Layer (type) Output Shape Param
conv2d 1 (Conv2D) (None, 61, 61, 10) 170
conv2d 2 (Conv2D) (None, 58, 58, 10) 1610
maxpooling 2d 1 (None, 58, 29, 5) 0
(Maxpooling2)
conv2d 3 (Conv2D) (None, 55, 26, 10) 810
conv2d 4 (Conv2D) (None, 52, 23, 10) 1610
maxpooling 2d 2 (None, 52, 11, 5) 0
(Maxpooling2)
flatten 1 (Flatten) (None, 2860) 0
dense 1 (Dense) (None, 3) 0
Total parameters: 12,873
Trainable parameters: 12,873
Non-trainable parameters: 0
models available in EmoPy is the Facial Expression
Recognition (FER) model which is a CNN trained
on the FER dataset (Barsoum et al., 2016), which is
based on the FER2013 image set (Perez, nd). A mod-
ified model was made to enable that the model pre-
dicts seven outputs instead of four, a limitation of the
version used here. To fix, the scores of each emotion
of nine models with 2, 3 or 4 emotions were aver-
aged: Model 1: (a)nger, (f)ear, (su)rprise, (c)alm; 2:
(h)appiness, (d)isgust, (su); 3: (a),(f),(su); 4: (a), (f),
(c); 5: (a), (h), (c); 6: (a), (f), (d), 7: (c), (d), (su); 8:
(sa), (d), (su); 9: (a), (h). A new update to the EmoPy
packages seems to make this currently unnecessary.
This was not available at the time of this work. Also a
classifier layer was added. A description of the design
is in (Wanavit, 2021).
Table 1 shows Emopy parameters used in the
runs. All other parameters were kept at default (Pe-
dregosa et al., 2011). Before emotions can be rec-
ognized, the system must first separate the face itself
from the surrounding background. A CNN used by
Emopy uses the same concepts as were proposed in
the well-known YOLO Paper (Redmon et al., 2016)
to recognize objects with four methods simultane-
ously, namely pose-robust feature extraction, multi-
view subspace learning, face synthesis based on 2D
methods, and face synthesis based on 3D methods, all
in one fast pass. A CNN like EmoPy can do these
simultaneously together with the emotion recognition
in YOLO mode (combining the face recognition itself
and the emotion recognition) in one pass while using
the Graphics Processor Unit for speed. The Python
code ran in a Jupyter notebook in a virtual machine
provided by Google Colab (Colaboratary, nd). The
data inside Google Colab is automatically backed up
on Google Drive and is available publicly.
Each of the seven emotional features in each
LinkedIn picture is assessed by the CNN and gets a
score which indicates the strength of that emotion.
These scores are normalized so that they sum to 100.
This happens at the end of the pipeline in a flattening
layer. Collectively, the strength of those emotional
features should summarize all the useful information
taken into account from the image in this research
while reducing the amount of data fed into the final
layer of image classifier. The last layer is a fully con-
nected layer (Perez, 2018a), and converts the strength
of the found emotions into probabilities, with their
sum per image equal to 100% via a SoftMax activa-
tion function.
so f tmax(z
i
) =
exp(z
i
)
∑
k
j=1
exp(z
j
)
, (1)
where k is the number of classes, 7 in this case, i=1...k,
and weights and bias have been neglected because
they are difficult to assess here. The SoftMax func-
tion is a generalization into more dimensions of the
sigmoid function from logistic regression that makes
sure that the total probability is smaller than 1. z
i
is
the strength of emotion i.
Also, the Keras-Tensorflow library of low-level
and high-level API routines was used in this research.
Tensorflow also uses the GPU and Colab.
The research photos and temporary data logs of
this work were stored in the S3 object store, a ser-
vice from Amazon Web Service which allows user to
store and distribute files stored into folder-like buck-
ets. S3 has multiple advanced feature which are ben-
eficial to this type of research including data redun-
dancy, version control, accelerated data transfer, high-
speed web hosting, and permission control. The Dy-
namoDB database service from Amazon was used to
store all data, also the non-structured data. The ser-
vice is low cost and the performance is sufficient for
real time data processing used by the Python code
in this research. The database is highly redundant
with safety measures built-in to prevent accidental
data losses. All forecasts data from EmoPy and other
binary algorithms are stored in DynamoDB within S3
(Amazon, n d), (Sivasubramanian, 2012)
6 ANALYSIS
The output of EmoPy is passed in its last layer
through the SoftMax activation function in order to
convert the scores of the emotion feature set into a
probability. The input for the binary classifier is the
output of the EmoPy neural network which consist of
the probability of each of the seven emotions in each
image. The output of the binary classifier is the pre-
dicted probability of the person working for Apple or
Is It Possible to Recognize Apple Employees by Their LinkedIn Profile Picture?
279
not. This is a number between 0 and 1. 0 means the
person is predicted as certainly not working for Apple
and 1 means the person is predicted with certainty to
work for Apple. If the output is 0.5 or higher, then
this predicts that the person is working for Apple, just
like in binary logistic regression methods. If the result
is correct, then the algorithm gets 1 point for making
the correct prediction and if incorrect, zero points.
The quality of a forecast is usually given by the
confusion matrix (Markham, 2014) and by its accu-
racy. The best performing algorithm was Random
Forest. This is a meta estimator (Breiman, 2001) that
is fitting some decision tree classifiers on various sub-
samples of the data set. It uses averaging to improve
the accuracy of the prediction and for control of over-
fitting. For a few other methods see Appendix A.
The Random Forest model was implemented us-
ing source code from scikit-learn (Pedregosa et al.,
2011) available via (Anonymous, ndc).
The analysis was always done by comparing two
sets of data only, Apple versus non-Apple or Apple
versus Control, and not by attempting to classify all
three sets of data simultaneously. Because we were in
charge of the data collection and the choice was made
to do only binary classifications, it was advantageous
to avoid the accuracy-paradox and balance the sam-
ples so that the base accuracy always was 50%. This
balancing is not always strictly required by all used
algorithms but is recommended (Anonymous, ndb).
The sample set was kept balanced by randomly re-
moving some Apple cases from the 851 collected im-
ages for Apple so that the total number of cases fed to
the model is 416 for the Apple, non-Apple and Con-
trol sets. The group of in total 2 * 416 = 832 Ap-
ple and non-Apple employees was divided randomly
into 666 training cases and 166 test cases (a ratio of
80% versus 20%). This training set of 666 cases was
kept at 50% Apple and 50% non-Apple, so that the
test set was also balanced. An estimate of the error
in the forecast was made by repeating this procedure
1000 times. For each of the 1000 runs, 416 Apple
images were randomly chosen from the whole group
of 851 collected Apple images and then divided ran-
domly into 666 balanced training and 166 balanced
test cases. The model is then trained and made to
make another forecast. Results are plotted and dif-
ferences analyzed using the z-test to see whether the
prediction is significantly higher than the 50% base-
line that results from equal-size sample sets and its
improvement over baseline is a reliable estimate.
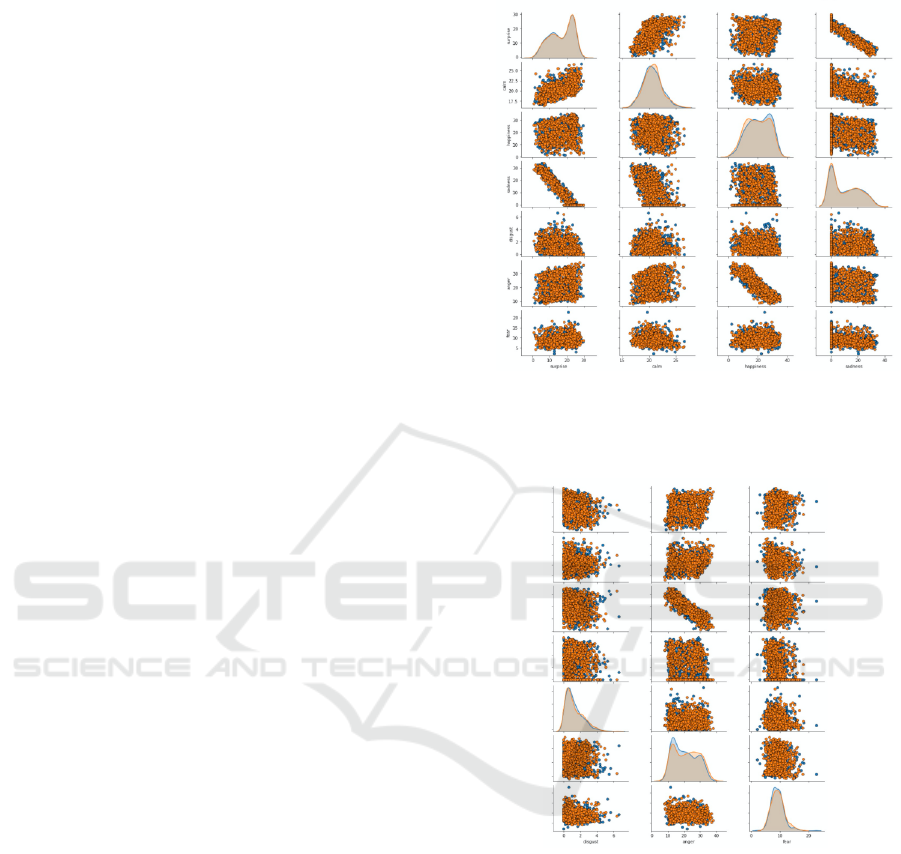
Figures 1 and 2 show a scatter diagram of the bi-
nary relationships between each pair of emotions for
Control=false. The orange colors are for Apple em-
ployees and the blue colors for non-Apple employees
who are also computer engineers
Figure 1: Correlation of the seven emotions for Apple and
non-Apple. Y-axis (from top to bottom) is surprise, calm,
happiness, sadness, disgust, anger and fear. X-axis is from
left to right surprise, calm, happiness and sadness.
Figure 2: Correlation of the seven emotions for Apple and
non-Apple. Y-axis (from top to bottom) is surprise, calm,
happiness, sadness, disgust, anger and fear. X-axis is from
left to right disgust, anger and fear.
Visual inspection of binary relationships between
all emotions does not show any obviously different
pattern for Apple and non-Apple Control employees.
A negative linear relationship is visible in the plots
between sadness and surprise and between happiness
and anger for both groups. The latter relationship is
intuitively clear, but there is no clear explanation for
the first relationship.
Figures 3 and 4 show 3D plots of Apple and non-
Apple employees. There is a suggestion in these plots
that Apple hires more people who score outside the
NCTA 2021 - 13th International Conference on Neural Computation Theory and Applications
280
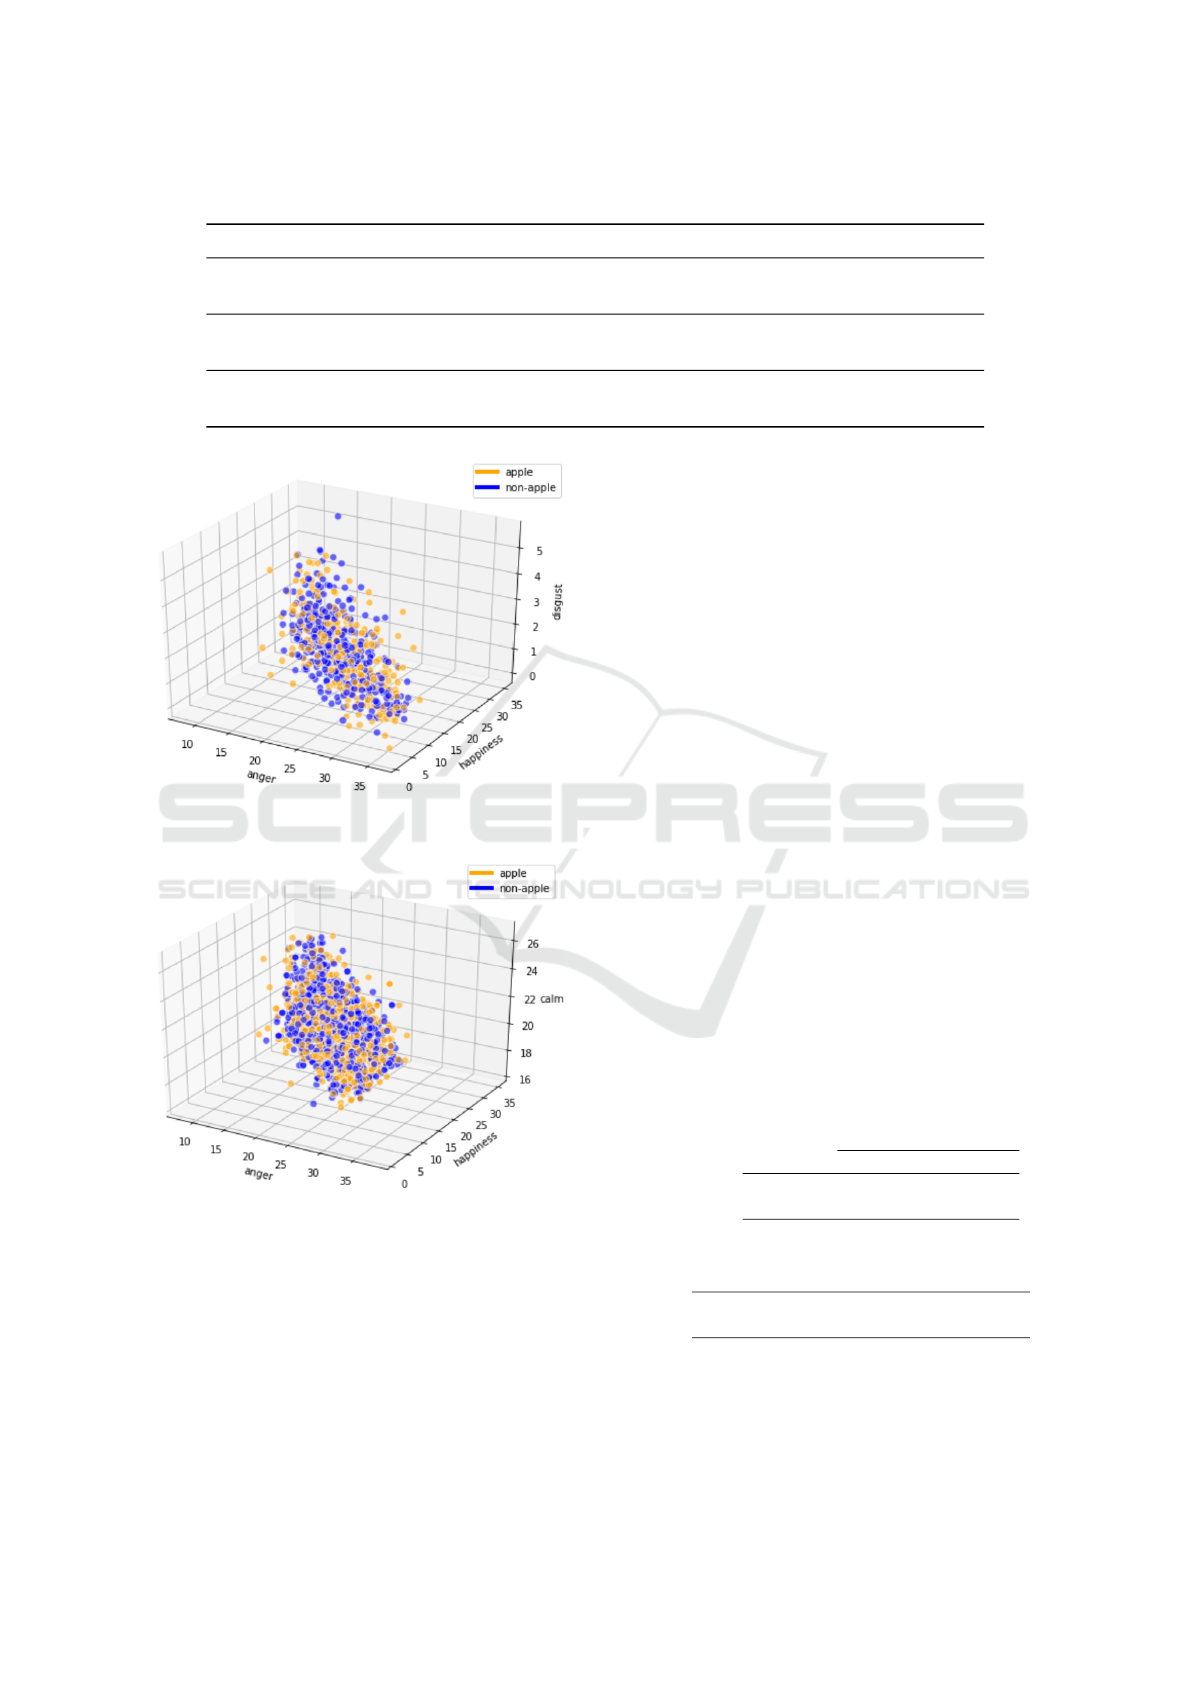
Table 2: Mean and Standard Deviations Probabilities for all samples.
Apple Control surprise calm happiness sadness disgust anger fear
False False Mean 17.08 20.72 21.23 10.37 1.28 20.29 9.03
SD 6.71 1.67 7.55 10.38 1.00 6.94 2.20
False True Mean 16.67 20.61 20.56 10.98 1.24 20.76 9.19
SD 6.83 1.69 7.80 10.44 1.02 7.26 2.31
True False Mean 17.01 20.73 19.83 10.25 1.29 21.58 9.32
SD 6.86 1.73 7.80 10.33 1.05 7.50 2.36
Figure 3: 3D scatter plot for anger, happiness and disgust,
for Apple and non-Apple employees.
Figure 4: 3D scatter plot for anger, happiness and calm, for
Apple and non-Apple employees.
average. The edges of the 3-dimensional clouds con-
tain mostly Apple employees. One could speculate
that Apple, as a company that depends on innovation
and therefore creativity for its success, is willing to
employ people that are less conformist.
Table 2 gives the mean and standard deviation of
the probabilities for each emotion for all samples. It
is seen that only “calm” has a narrow peak (small
standard deviation relative to the mean) and that dis-
gust and sadness have a very wide shape, with a stan-
dard deviation of the same order of magnitude as the
mean. Differences in averages between Apple and
non-Apple employees are minimal. This makes clas-
sifying difficult. However, the standard deviations
for all emotions are larger for Apple employees than
for non-Apple employees, consistent with the wider
range of emotions that can be seen for Apple em-
ployees in the 3D plots. This supports the idea that
Apple is willing to hire a more diverse range or peo-
ple. This was confirmed by a One-Way ANOVA test
in SPSS between Apple and non-Apple employees.
The p-value for the difference between the means are
p=0.003 for anger and p=0.037 for fear, significant at
the 5% level. Both are higher with Apple employees.
Much more interesting, the variances (square of the
standard deviations) are also significantly larger, p=
0.005 for anger and p= 0.043 for fear.
One of the 1000 runs yielded, as an example, the
confusion matrix in Table 3. This is a more or less
random, average, example. Its accuracy is very simi-
lar to the most frequent score, as can be seem in Fig-
ure 5. There is no way to find the most accurate pre-
diction without trying them all out and getting an idea
of the distribution of the accuracy scores.
Table 3: Confusion Matrix for one of the runs. The accuracy
score is 0.620481.
Ground Truth
Positive Negative
Prediction
Positive 50 33
Negative 30 53
(a) Confusion matrix
precision recall f1-score support
False 0.62 0.60 0.61 83
True 0.62 0.62 0.62 83
(b) Report
166 balanced testing cases, 83 from Apple and 83
from non-Apple software engineers, Random Forest
Is It Possible to Recognize Apple Employees by Their LinkedIn Profile Picture?
281
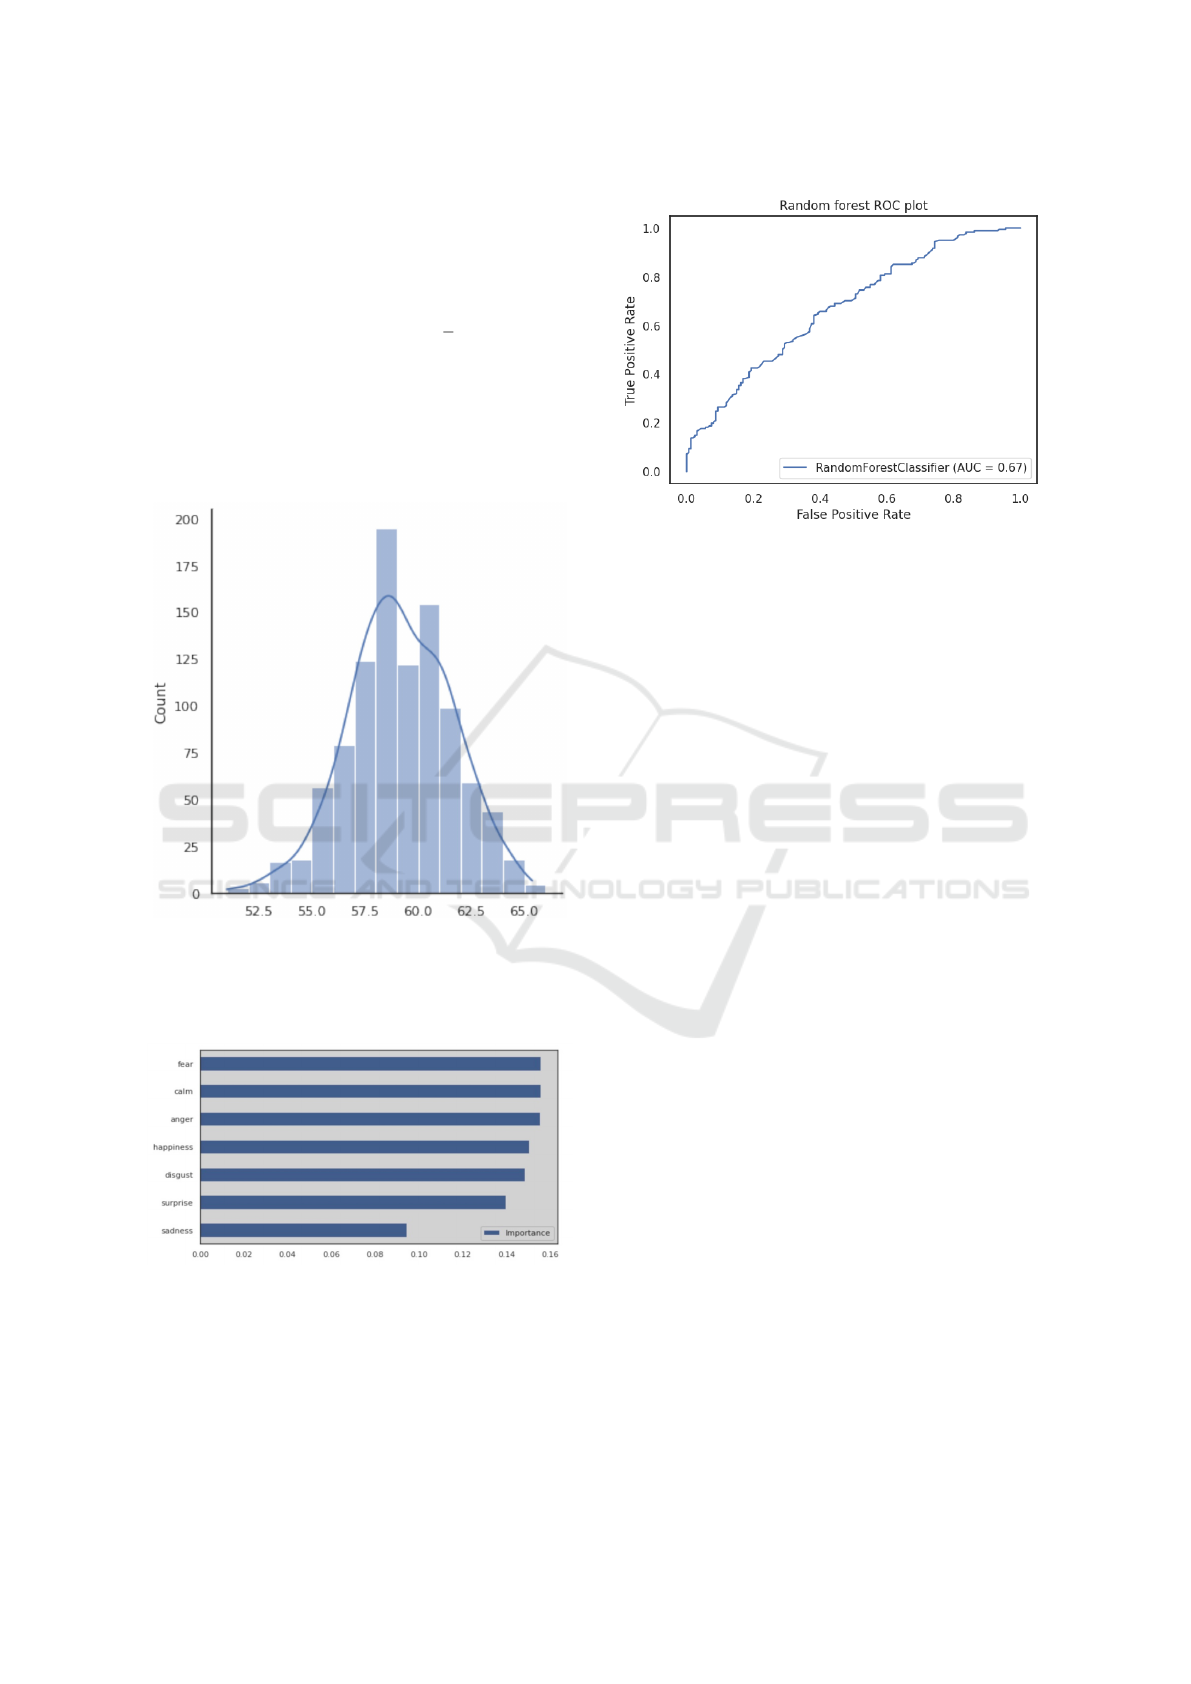
gave a forecast of 50 true positives, 53 true negatives,
30 false negative, and 33 false positives. For the thou-
sand runs, the lowest accuracy was 51.03%, the high-
est 65.4%, the 25th percentile was at 57.48%, the me-
dian at 59.24%, and the 75th percentile at 61.00%.
The average was 59.18% with a standard deviation of
2.46% and a standard error of σ/
√
n, using a sam-
ple size of 1000, of 0.078. The z-score of the mean
compared with the base rate of 50% is then incredibly
large and the null hypothesis that the Random Forest
method has a 50% base rate impossible for any rea-
sonable level of significance. The histogram in Figure
5 shows the Gaussian shape
Figure 5: Accuracy in 1000 runs with the Random Forest
model.
The various emotions contributed in the following
way to the classification as in Figure 6.
Figure 6: Contribution of each emotion to the Random For-
est model.
As another metric of the quality of the forecast,
the ROC and AUC are shown for the same run as in
the Confusion Matrix in Figure 7
A comparison of Apple-employees with the con-
trol group gives similar results. There is not much dif-
Figure 7: ROC and AUC for one of the runs.
ference between the Control group and the non-Apple
group. This provides an argument not to handle this
as a classification problem between all three groups.
7 DISCUSSION AND
CONCLUSIONS
Only sadness is of less importance in the classifica-
tion of the Random Forest model, further all emo-
tions seem to play a role, see Figure 6. It is tempt-
ing to speculate about the connection of the emotions
in the images and the personal characteristics that can
make a difference in hiring and retention at Apple.
Given that fear and anger seem to make the largest
contributions, consistent with the One-Way ANOVA
test, this points to a connection with Apple’s inter-
nal competition-driven organizational culture. Both
emotions have psychological links with aggression
and perceptions of being attacked or threatened via
the fight or flight (hyperarousal) response. Links be-
tween this response and anxiety and aggression have
been studied extensively by psychologists, especially
in children (Kunimatsu and Marsee, 2012).
Whether this is true or not, this work has shown
that there is a definite connection between the ex-
pressiveness of emotions in the LinkedIn profile pic-
tures and employment with Apple or others. How-
ever, exploration is made complicated because there
is no simple linear relationship between the probabil-
ity of the emotions as uncorrelated independents and
the probability to work at Apple. If there would have
been, then binary logistic regression analysis would
have worked, but it did not. We don’t know if there are
higher-dimensional “islands” of emotions with cer-
tain probabilities that are connected with a higher or
lower chance to work at Apple, or if the reasons are
NCTA 2021 - 13th International Conference on Neural Computation Theory and Applications
282

even deeper. It is, however, possible that such “is-
lands” reflect psychological constructs or biases like
age or race more than a bias towards people showing
certain emotions.
As this is a position paper, we point out that
the data are consistent with an organizational cul-
ture at Apple that is fairly aggressive (anger, fear
and calm are the most discriminating emotions) and
in accordance with ideas from Complexity Science
about companies that are successful in thwarting at-
tacks from their competition and in attacking their
competition. Complexity Science as applied to busi-
ness borrows ideas from the physics of systems far
from equilibrium and from the biology of evolution.
Successful companies operate at the “edge of chaos”,
where interactions with employees and outside con-
tacts are neither too sparse (so that the company is
not cohesive enough) or too tight (which would make
the company ungovernable). This diversity in its em-
ployees and the preponderance of weak links with
people with a different background enable innova-
tion and quick responses to changing circumstances
(Beinhocker, 1997). The wider range of emotions
reflect a larger proportion of “not so average” em-
ployees, who in turn are more perceptive of devel-
opments in parts of society and the globe that are
missed in more conventional companies. (Podolny
and Hansen, 2020) describes in detail the type of man-
agement structure needed so that such employees are
still able to influence the internal debate but also are
independent enough that they can keep functioning as
an antenna for external developments. This is a type
of diversity that goes beyond the inclusion of minori-
ties (Anonymous, nda)
The research focused only on the emotions and
did not collect any other data about the people on the
photographs. In future work we hope to explore if
the enhanced labeling of the FER+ image data set can
improve the classification and if the formalism can be
applied to other situations.
ACKNOWLEDGMENTS
The authors want to extend their thanks to Dr. Pin
Pin Tea-makorn for helpful discussions and to the
anonymous reviewers for their suggestions for im-
provement.
REFERENCES
Amazon (n. d.). Amazon s3. https://amazon.com/s3/. In-
formation Page.
Anonymous (August 19, 2017). How many software en-
gineers are currently employed in the Silicon Valley
Bay area? https://askwonder.com/research/software-
engineers-currently-employed-silicon-valley-bay-
area-ran93oji9.
Anonymous (n.da). Inclusion & diversity.
https://www.apple.com/diversity/.
Anonymous (n.db). knn and unbalanced classes.
https://stats.stackexchange.com/questions/341/knn-
and-unbalanced-classes.
Anonymous (n.dc). Random Forest Classifiers.
https://scikit-learn.org/stable/modules/generated/
sklearn.ensemble.RandomForestClassifier.html.
Back, M. D., Stopfer, J. M., Vazire, S., Gaddis, S.,
Schmukle, S., Egloff, B., and Gosling, S. (2010).
Facebook Profiles Reflect Actual Personality, Not
Self-Idealization. Psychological Science, 21(3):372–
374.
Barsoum, E., Zhang, C., Ferrer, C. C., and Zhang, Z. (Oc-
tober 2016). Training deep networks for facial ex-
pression recognition with crowd-sourced label distri-
bution. In Proceedings of the 18th ACM Interna-
tional Conference on Multimodal Interaction, page
279–283.
Beinhocker, E. (1997). Strategy at the edge of chaos. The
McKinsey Quarterly, 1:24–39.
Bendick, M. and Nunes, A. P. (2012). Developing the Re-
search Basis for Controlling Bias in Hiring. Journal
of Social Issues, 68(2):238–262.
Breiman, L. (2001). Random Forests. Machine Learning,
45(3):5–32.
Celli, F., Bruni, E., and Lepri, B. (2014). Automatic Per-
sonality and Interaction Style Recognition from Face-
book Profile Pictures. In MM ’14: Proceedings of the
22nd ACM international conference on Multimedia,
page 1101–1104.
Colaboratary (n.d.). Frequently asked questions.
https://research.google.com/colaboratory/faq.html.
Google Colaboratory.
Kunimatsu, M. M. and Marsee, M. A. (2012). Examining
the presence of anxiety in aggressive individuals: The
illuminating role of fight-or-flight mechanisms. Child
Youth Care Forum.
Markham, K. (March 25, 2014). Simple
guide to confusion matrix terminology.
https://www.dataschool.io/simple-guide-to-
confusion-matrix-terminology/. Terminology.
Marsden, P. (1994). The Hiring Process: Recruit-
ment Methods. American Behavioral Scientist,
37(7):979–991.
Pedregosa, F., Varoquaux, G., Gramfort, A., Michel, V.,
Thirion, B., Grisel, O., Blondel, M., Prettenhofer,
P., Weiss, R., Dubourg, V., Vanderplas, J., Passos,
A., Cournapeau, D., Brucher, M., Perrot, M., and
Duchesnay, E. (2011). Scikit-learn: Machine learning
in Python. Journal of Machine Learning Research,
12:2825–2830.
Perez, A. (2017). Emopy (0.0.5).
https://github.com/thoughtworksarts/EmoPy. Pack-
age.
Is It Possible to Recognize Apple Employees by Their LinkedIn Profile Picture?
283

Perez, A. (2018a). Emopy: a machine learn-
ing toolkit for emotional expression.
https://www.thoughtworks.com/insights/articles
/recognizing-human-facial-expressions-machine-
learning. Thoughtworks Arts [blog].
Perez, A. (2018b). Recognizing human fa-
cial expressions with machine learning.
https://www.thoughtworks.com/insights/articles/
recognizing-human-facial-expressions-machine-
learning. [blog].
Perez, A. (n.d.). Fer2013 image data set for emopy.
https://github.com/thoughtworksarts/EmoPy/tree
/master/EmoPy/models. Package.
Podolny, J. M. and Hansen, M. T. (2020). How apple is
organized for innovation. Harvard Business Review.
Redmon, J., Divvala, S., Girshic, R., and Farhadi, A.
(2016). You Only Look Once: Unified, Real-Time
Object Detection. In Proceedings of the IEEE Con-
ference on Computer Vision and Pattern Recognition
(CVPR) , pages 779–788.
Sivasubramanian, S. (May 2012). Amazon dynamodb: a
seamlessly scalable non-relational database service.
In SIGMOD ’12: Proceedings of the 2012 ACM SIG-
MOD International Conference on Management of
Data, page 729–730.
Wanavit, T. (August, 2021). Emopy and classifier diagram.
https://github.com/thanakijwanavit/
emotionExtractionUsingEmopy/tree/
43117fdad2a69c032f5d1b0cff77c2f8a53f7e70.
APPENDIX
Results in the main text were based on the Random
Forest classifier. Here are results for some less well
performing classifier methods. K-Nearest Neighbors
is worst. All results were obtained via the classifier
layer, not with a program like SPSS.
Table 4: Confusion Matrix for XGBoost. The accuracy
score is 0.5722891.
Ground Truth
Positive Negative
Prediction
Positive 50 37
Negative 34 45
(a) Confusion matrix
precision recall f1-score support
False 0.60 0.57 0.58 87
True 0.55 0.57 0.56 79
(b) Report
Table 5: Confusion Matrix for Perceptron. The accuracy
score is 0.51204819.
Ground Truth
Positive Negative
Prediction
Positive 70 17
Negative 64 15
(a) Confusion matrix
precision recall f1-score support
False 0.52 0.80 0.63 87
True 0.47 0.19 0.27 79
(b) Report
Table 6: Confusion Matrix for Support Vector Machines.
The accuracy score is 0.56024096.
Ground Truth
Positive Negative
Prediction
Positive 53 34
Negative 39 40
(a) Confusion matrix
precision recall f1-score support
False 0.58 0.61 0.59 87
True 0.54 0.51 0.52 79
(b) Report
Table 7: Confusion Matrix for K-Nearest Neighbors. The
accuracy score is 0.506024096.
Ground Truth
Positive Negative
Prediction
Positive 39 48
Negative 34 45
(a) Confusion matrix
precision recall f1-score support
False 0.53 0.45 0.49 87
True 0.48 0.57 0.52 79
(b) Report
Table 8: Confusion Matrix for Logistic Regression. The
accuracy score is 0.55421686.
Ground Truth
Positive Negative
Prediction
Positive 49 38
Negative 36 43
(a) Confusion matrix
precision recall f1-score support
False 0.58 0.56 0.57 87
True 0.53 0.54 0.54 79
(b) Report
NCTA 2021 - 13th International Conference on Neural Computation Theory and Applications
284
