
Support in Policymaking: A Systematic Exploration of the
Policymaking Process
Daniel Guzman Vargas
1,2
and Sidharta Gautama
1,2
1
Department of Industrial Systems Engineering and Product Design, Ghent University,
Technologiepark 46, 9052 Gent-Zwijnaarde, Belgium
2
Flanders Make, B-3920 Lommel, Belgium
Keywords: Decision Support Systems, Urban Vehicle Access Regulations, Wicked Problems, Evidence-based
Policymaking.
Abstract: Nearly all the public policy issues focus on complex social problems (sometimes referred to as ‘wicked’
problems). Failing to address such complexity may result in a weak formulation of the problem at hand and
consequently to policy failure. A decision support system (DSS) appropriate for handling `wicked' problems
in policymaking should help decision-makers cope with the problem's complexity, facilitate the assessing of
multiple alternatives, and favour a discussion towards a common agenda. Making use of the above
requirements, we present in this paper a methodology for a DSS that feeds from a frame representation of
both expert knowledge and policy-related evidence to support decision-makers in the policymaking process.
The application of the methodology in a specific use case suggests the methodology could be applied in a
DSS for the identification of patterns and trends in policy-relevant data, the identification of possible policy
configurations, and the drafting of alternative scenarios based on the possible configurations.
1 INTRODUCTION
The design of policies as effective solutions to social
problems requires, from a policy science perspective,
of sophisticated analysis on the facts with strong
foundations on logic, knowledge, and experience
rather than on political interests or the bargaining of
conflicting interest groups. A weak analysis, and
consequently failure to incorporate complexity, in the
design and formulation of policies may lead to the
failure of such policies (Howlett, 2012; Howlett et al.,
2015; Schneider & Ingram, 2017), or to the ‘creation
of poor, even harmful, policies’ (Cohn, 2004).
Complex social problems, sometimes referred to
as ‘wicked’ problems, lack the sense of clarity that
most of the problems in science or engineering have,
where a problem statement can be clearly defined.
These problems include nearly all of the public policy
issues (Rittel & Webber, 1973), and a general
conclusion seems to be that ‘the methods for problem
handling appropriate to pacified conditions do not
transfer to more turbulent and problematic
environments’ generally ascribed to wicked problems
(Rosenhead, 1996). Rosenhead (1996) suggests that
when dealing with ‘wicked problems’, decision-
makers are more likely to use a method and find it
useful if it (a) accommodates multiple alternative
perspectives, (b) can facilitate negotiating a joint
agenda, (c) functions through interaction and
iteration, and (d) generates ownership of the problem
formulation and its action implications through
transparency of representation. These requirements
outline the specifications of a decision support system
(DSS) appropriate to wicked problems.
According to Rosenhead (1996) the technical
attributes of such a system include, the capability of
representing the problem complexity graphically
rather than algebraically or in tables of numerical
results – to facilitate participation, allow for a
systematic exploration of the solution space – ‘lay
people can generally express their judgments more
meaningfully by choosing between discrete
alternatives rather than across continuous variables’,
focus on the identification of relevant possibilities
rather than estimation numerical probabilities, and the
assessment of alternative scenarios instead of future
forecasts.
In spite of the multitude of studies on policy
analysis, policy failure, and policy transfer (Howlett
et al., 2009), the authors have found no research
120
Guzman Vargas, D. and Gautama, S.
Support in Policymaking: A Systematic Exploration of the Policymaking Process.
DOI: 10.5220/0010641600003064
In Proceedings of the 13th International Joint Conference on Knowledge Discovery, Knowledge Engineering and Knowledge Management (IC3K 2021) - Volume 2: KEOD, pages 120-127
ISBN: 978-989-758-533-3; ISSN: 2184-3228
Copyright
c
2021 by SCITEPRESS – Science and Technology Publications, Lda. All rights reserved

focused on the development of such DSS. Making use
of the above requirements, we present in this paper a
methodology for a DSS that feeds from a frame
representation of both expert knowledge and policy-
related evidence to support decision-makers in the
policymaking process.
The remainder of this paper consists of 4 parts.
First, we develop a methodology for the systematic
exploration of the solution space. Next, we apply the
methodology to a specific use case; the development
and implementation of Urban Vehicle Access
Regulations (UVARs). We perform a small-scale
experiment of 8 city case implementations, and
finally, we present the conclusions from our findings
and lay down possibilities for future work.
2 METHODOLOGY
The list of technical attributes in (Rosenhead, 1996)
frames the design of the framework proposed in this
paper. For this, our framework takes a systematic
approach to define the solution space, guided, and
supported by expert knowledge and policy-relevant
information captured in city case studies.
Case studies can be used to assess a phenomenon
(in this case the policy process) and its contextual
conditions, relying on multiple sources of evidence to
provide ‘rich, thick description and analytic
generalization’ (Vogel & Henstra, 2015).
Case study research applied to policy processes
relies on a large variety of sources such as official
policy documents, meeting transcripts, council
minutes, committee papers, etc. These data sources
are rich in evidence to support the documentation of
the different elements of the policy process (Vogel &
Henstra, 2015), but at the same time pose a challenge
to the researcher: ‘case data is rich in qualitative
detail’. As a result, the presentation of the empirical
evidence in case study research is usually descriptive.
However, as the number of cases increases, making a
contrast between emergent theory, and a complete
unbroken rendering of each case's story becomes
infeasible (Eisenhardt & Graebner, 2007).
Additionally, a larger number of cases may
drastically increase the volume of data which hinders
researchers in the assessment and identification of
important relationships.
These characteristics pose both a challenge and a
motivation for the use of a decision support system.
A DSS that could help policymakers draw relevant
conclusions from the empirical evidence could
support a large collection of multiple case studies.
But how can a DSS best find “patterns” from the
textual description of the empirical evidence? For
this, we take some inspiration from content analysis,
‘a research method for the subjective interpretation of
the content of text data through the systematic
classification process of coding and identifying
themes or patterns.’ Consequently, the successful
identification of patterns and relationships is highly
dependent on the coding process (Hsieh & Shannon,
2005). The novelty of our framework is on
developing a useful representation that could
facilitate the identification of patterns in the
description of empirical evidence, supported by
expert knowledge, and working as a rubric for the
collection of case data.
The methodology for the coding process consists
of two main steps, the parametrization of the solution
space, and the definition of the Policy Life Cycle.
These two steps provide the coding categories, and
their corresponding operational definitions, that
provide non-binding guidance in the collection of
case data, and that allow for a systematic
interpretation of the empirical evidence, facilitating
the identification of patterns, and underlying
relationships, both within and across case analysis.
2.1 Parameterizing the Solution Space
In first instance, the relevant factors that interact in
the development of a policy solution to a specific
policy problem are identified and defined. Here three
types of parameters should be considered: contextual,
control and time.
Contextual parameters reflect the environment in
which the policy problem is framed, the factors that
can influence governmental decisions, and the
elements that policymakers aim to influence with
their decisions – these parameters define the context
in which the policy problems take place. Control
parameters refer to all the relevant factors that
policymakers could control to implement their
policies – these factors shape the overall policy from
a strategic point of view. The third category refers to
a single parameter: time. Social systems are dynamic,
and so are policies (Hom, 2018). Time and timing in
politics are a big deal. Timing can be a strategic tool
(Djourelova & Durante, 2019); it can constraint the
opportunity for the development of a policy – ‘policy
window’ (Kingdon, 2014); and it defines the life-span
of a policy – policy cycle (Howlett et al., 2009; Jann
& Wegrich, 2017). Time helps define the dynamics
of the policy process, providing coherence and logic
to its narrative (Massey, 2017). Policymakers make
decisions that affect and mould social systems, and
consequently, this new state of the affairs demands a
Support in Policymaking: A Systematic Exploration of the Policymaking Process
121

reaction from policymakers. This never-ending series
of discrete events describes both the path taken by the
policymakers in solving a policy problem and its
implications and effects on the system.
The definition of the parameters is achieved
through expert knowledge. A commission of experts
consisting of academics, policy consultants, and other
practitioners immerse in the implementation and
development of such policies is put together to find a
consensus on the parameters relevant to the policy
process. Their input consists of the set of categorical
parameters that best describe the policy context
(contextual parameters) and the elements of the
policy strategy (control parameters). The quality of
the outcome of the methodology is therefore
dependent on the quality of the expert's commission.
2.2 Definition of the Policy Life Cycle
In the process of defining the parameters of the
solution space, the group of experts should be asked
to think about the different stages that comprise the
development of the policy strategy from its
conception until after its implementation. For this, we
refer the participants to the policy cycle for
inspiration. The policy cycle intends to simplify the
policy process by deconstructing it into discrete
stages that describe the chronology of the policy
process, starting with the Agenda Setting, where a
problem is defined and recognized, and the need for
intervention is expressed, passing onto Policy
Formulation, where the objectives of a subsequent
policy are defined and alternatives for action are
considered. This is followed by the Decision-making
stage, where the final adoption (final course of action)
is formally set. Next, the Implementation phase,
where the adopted policy is executed or enforced, and
finally, the Evaluation stage, where the effects
(intended and unintended) of the implemented policy
are assessed in relation with the objectives previously
set and the current problem perception (agenda). The
outcome may lead to policy continuation,
termination, or re-design (Howlett, 2019; Jann &
Wegrich, 2017).
The policy cycle helps dive into the complexity of
policymaking, providing guidance to action, and
although it has been recognized that its application is
by no means universal (‘practice varies from problem
to problem’), the policy cycle is a good heuristic in
policymaking for the answer to the question ‘what to
do now?’ (Bridgman & Davis, 2003).
In our Framework, we rely on the policy cycle as
a source of inspiration. Participants should be allowed
to re-think and re-shape the stages in the way their
experience find it more suitable. This new,
“customized” definition of the policy cycle
(hereinafter policy life cycle) is another output of our
framework. Participants can make use of the policy
life cycle as a tool to trigger the discussion on the
parameters, both contextual and of control, that may
play a role at each policy stage. Participants should be
asked to describe all the factors of utmost relevance
at each of the policy stages.
As proponents of the policy cycle propose, the
fragmentation of the policy into stages allows for a
more detailed view of the process. The policy life
cycle is then used as a “custom” tool in the
parametrization process that contributes to the
definition of detailed elements that are part of a policy
strategy and that may have been difficult to foresee at
a higher level. Additionally, the linear temporality of
the process provides streamlined thinking, and a
conception of the parameters as changing elements in
a policy as a timeline, i.e., as a sequence of discrete
events describing the change of state of a (set of)
parameter(s) as the policy matures. During this
process, relationships between the parameters may
arise and their use in finding new parameters not yet
defined should be encouraged. However, participants
should be asked to focus on the identification of the
parameters only: the magnitude and characteristics of
these relationships should not be discussed here.
3 THE UVAR CASE
To better illustrate the potential of the methodology,
we apply it to the case of UVARs in Europe.
UVARs, in the broad sense, are measures to
regulate the access of urban vehicles to urban
infrastructure in order to cope with societal
challenges that markets alone cannot. In general, such
policies intend to deal with the negative externalities
generated by traffic: pollution, congestion, traffic-
related accident rates, etc. (Carnovale & Gibson,
2013; Elbert & Friedrich, 2019; Lopez, 2018). Given
the range of objectives, magnitude of the problems,
urban contexts, and political landscapes, UVARs may
take many forms. Low emission zones (LEZs), for
example, are designated areas where the access of
polluting vehicles is restricted or penalized (Lopez,
2018). Congestion charging (CC) refers to the
imposition of a fee to access congested areas during a
specified time frame (Morton et al., 2017). Partial or
total vehicle access bans such as a limited traffic zone
(LTZ) (in Italian: Zona a traffico limitato) or a
pedestrian zone. Traffic cell architecture where traffic
between cells is limited by design (e.g., Barcelona
KEOD 2021 - 13th International Conference on Knowledge Engineering and Ontology Development
122

Superblock scheme). Or hybrid designs, e.g., CC with
differential “emission” fees (Goddard, 1997).
With over 200 LEZs in place across Europe
(Mudway et al., 2019), CC schemes present in major
cities such as London, Stockholm, Milan, Superblock
schemes in Barcelona and Vitoria-Gasteiz, and the
LTZs predominant in Italian cities, the widespread of
UVARs highlights the intention of decision-makers
across Europe in dealing with negative traffic
externalities through UVARs.
However, the implementation of restrictive
policies, such as UVARs, is generally accompanied
by strong public and political controversy, with
public acceptability of a proposed UVAR playing a
major role in determining, whether or not the
proposed UVAR survives the policy process (Lopez,
2018; Morton et al., 2017). All in all, the extensive
application of UVARs in urban areas across Europe
poses a motivation for data-driven approaches that
could satisfy the need for new and better
implementations of such policies.
With this goal in mind, an expert commission
consisting of academics, practitioners, and
consultants with ample European experience in urban
planning, transport planning, quality assurance, and
development of urban mobility projects was set to
follow our methodology. As a first result, the policy
(UVAR) life cycle was defined by the experts’
commission as consisting of four phases.
The Ideation phase covers the time span in which
problems come to the attention of governments and a
set of (conceptual) solutions emerges in response.
The Design phase covers a time span in which UVAR
measure’s designs are developed in more detail.
Multiple designs may be considered and assessed
resulting in a proposal for the technical and strategic
design of the UVAR measure. The Implementation
phase involves executing the selected policy option.
Involves all the necessary action to put the UVAR
measure into practice. Finally, in the Operation phase
all the activities following the launching of the full
scale UVAR measure take place.
Additionally, during the definition of the policy
(UVAR) life cycle, three “policy gates” were
identified. Each “gate” refers to specific event(s) that
determine the end of a phase (or the beginning of a
new one). Together, the 4 phases and the 3 gates
define the policy life cycle of an UVAR (
Figure 1).
In the Decision-making gate the actual decision
on a particular course of action to follow is made –
selection of UVAR measure at a conceptual level. In
the Adoption gate the final design is approved for
implementation. Finally, the final decision needed for
the full-scale operation of the UVAR is made in the
Commissioning gate. Making use of the policy life
cycle (Figure 1), participants can continue with the
parametrization of the solution space.
Figure 1: Policy (UVAR) life cycle as depicted by the
experts’ commission.
For the definition of the contextual parameters,
participants were inspired by the work of (Gillis et al.,
2016) on monitoring of sustainable mobility in cities.
Through a review of relevant and scientifically sound
indicators applicable in different social and economic
contexts, (Gillis et al., 2016) identified a set of
indicators that could be applied for the evaluation of
a city’s mobility system, monitoring, bench-marking
assessment, and back-casting. However, instead of
relying on the specific set of indicators proposed in
(Gillis et al., 2016), the group of experts decided to
focus instead on the set of parameters used for the
calculation of such indicators. This to avoid further
assessment and discussions on the validity of each
indicator, or methodological issues in their
determination. By doing so, the data collected allows
a DSS to calculate this or any other set of indicators
when performing an analysis, or to work with the
granular information if appropriate.
Subsequently, participants reached a consensus
on a total of 35 contextual parameters. These
parameters can be grouped into 5 clusters: general
information parameters such as GDP, surface,
distribution of direct and indirect land use for
mobility, and availability of functional activities in
the target area. Demographic information parameters
account for the number of inhabitants, and population
distributions by gender, age, employment status,
income, and household size. Transport information
parameters cover total length and distribution of road
network by use, total number of passenger trips per
year per transport or per shared mobility type, and
vehicle fleet distribution per fuel type. General
mobility information parameters map the availability
of public transport (PT) and shared mobility modes,
ticket prices for PT, availability of ticketing machines
and offices, size and distribution of PT vehicle fleet,
number of PT stops, and distribution of accessibility
to and user satisfaction towards PT. Finally, effects on
inhabitants parameters capture satisfaction levels
towards noise level, quality of air, and public spaces,
traffic accident rate, average distance, time and main
Support in Policymaking: A Systematic Exploration of the Policymaking Process
123

transport modes for work-home/home-work trips.
For the control parameters, the process yielded a
total of 23 parameters that reflect the experience of
the participants gained through their academic and
research background. The set of parameters can be
grouped into 4 thematic clusters: system
design/technology, governance, user needs, and
mobility services and concepts.
System design/technology parameters focus on the
availability, functionality, and status of UVAR-
related systems. Covering aspects related to UVAR
operation: technology options for enforcement,
monitoring and evaluation, and communication-
dissemination of UVAR-related information.
Governance parameters relate to the availability
and types of legal frameworks, and political and
planning instruments that can support the
development of UVARs. Additionally, some of the
parameters in this cluster intend to capture the actors
and/or institutions that shape, influence and/or make
decisions, as well as details on participatory and
transparency issues.
User needs parameters focus on whether the
different relevant user groups and stakeholders have
been identified, and whether user needs have been
included/considered. Additionally, some of the
parameters here intend to monitor the tone of the
general opinion, the level of acceptability towards the
measure, and the main arguments for or against it.
Finally, mobility services and concepts
parameters cover the types and status of
developments related to improvements in PT, soft
mobility, parking systems, shared mobility, urban
logistics, etc.
To visualize the possibilities of our approach, we
make use of a set of 8 different case studies covering
8 European cities that have implemented different
UVAR measures (Table 1). Case study researchers
have been given the set of parameters and the UVAR
life cycle as a rubric for the collection of information.
In this way, researchers were asked to use the
definition of the different stages of the UVAR life
cycle and the different parameter categories to focus
and direct their research.
Table 1: List of city case studies and respective UVAR
measure with correspondent planning instrument.
City UVAR Measure Planning Instrument
Milan, IT CC General urban traffic plan
Barcelona, ES Superblock scheme Urban mobility plan
Bologna, IT LTZ Traffic plan*
La Rochelle, FR Delivery regulations Urban
t
ravel plan
Ghent, BE
Traffic circulation
p
lan (2017)
Mobility plan
Gr. London, GB Pollution charge Air quality strategy
Mechelen, BE Cycling zone Mobility plan
Amsterdam, NL LEZ Traffic plan for clean ai
r
* The LTZ was initially conceived in the Traffic Plan (1972), at that moment it was not
called LTZ, and later included in the General urban traffic
p
lan (1996).
Before the beginning of the documentation, case
study researchers were presented with the third
parameter: time. Researchers were asked to focus on
the chronology of the events that describe the process,
making note of the time of occurrence of each event.
Accounting for time as one of the relevant parameters
means that the outcome of the data collection process
will yield a timeline of data points containing the
main events that describe the process (hereinafter
process timeline), alongside changes in contextual
parameters. Furthermore, the identification of the
events in the process timeline that correspond to the
“policy gates” helps us define the policy life cycle.
Finally, researchers had the task of reporting for
each event the source of their information, e.g.,
academic papers, interviews, emails, etc. Thus, each
event should be backed entirely by one (or a
combination) of these sources and be independent of
the researcher's understanding of the process.
4 DISCUSSION AND RESULTS
The process timeline in Figure 2 shows the policy life
cycle for each of the city cases. Here we can see, for
instance, that a constant throughout all the cases is the
short span of the implementation phase (followed
behind by the design phase) with respect to the
Figure 2: Policy life cycle of city case studies.
KEOD 2021 - 13th International Conference on Knowledge Engineering and Ontology Development
124
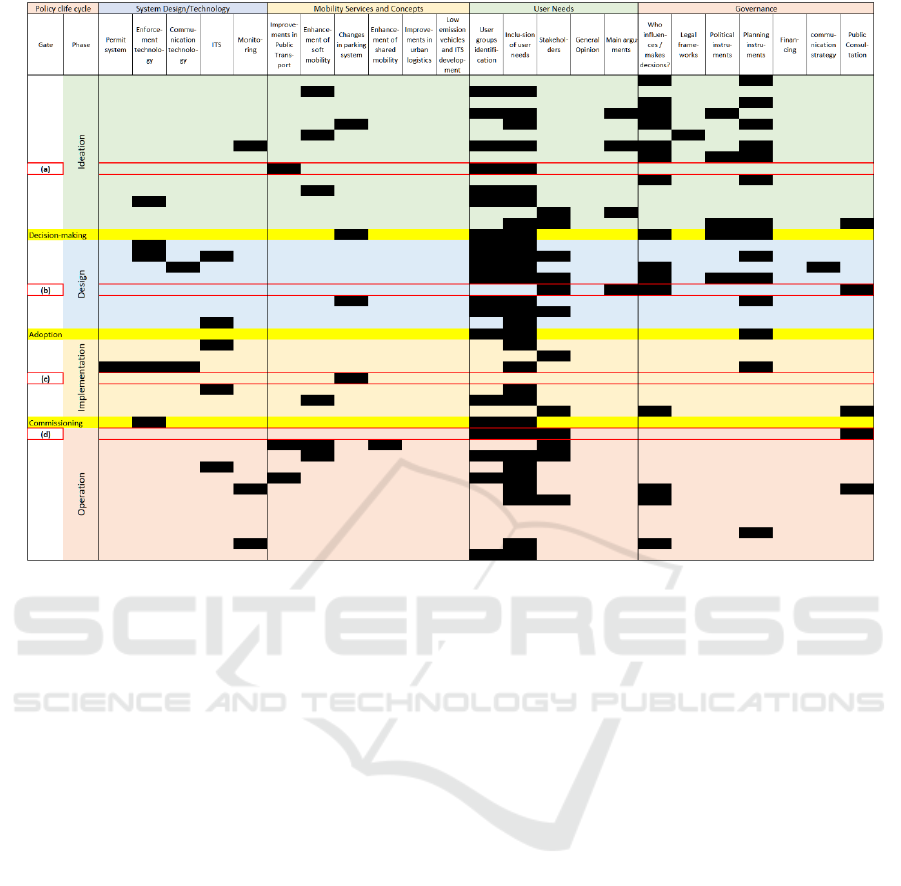
Figure 3: Parameterized instance - Case study Ghent (BE).
ideation phase. This could be explained due to how
controversial UVAR measures are, and the political
debate and discussions they trigger. Aiming for short
implementations seems to be a strategic decision.
Speeding up to materialize the measure, thus steering
the political and public debate away from mere
assumptions on the impacts they may have once
launched. This strategic choice allows decision-
makers to redirect the focus of users and opposition
towards the real impacts and perceptions of a
“tangible” measure. The speed of the process is again
a motivation for the support of policymakers in the
quick design of robust policy strategies.
Additionally, the coding of the information
described in the process timelines using the
parameters defined and identified by the commission
of experts, allow us to represent the problem's
complexity graphically. Which facilitates the
visualization and identification of patterns in the data.
Figure 3 illustrates the parameterized instance of the
case study for the city of Ghent, i.e., a frame
representation of the case of Ghent (BE). Here, each
row marks the beginning of an UVAR-related event,
and each black box corresponds to the “activation” of
a control parameter triggered in each event. This
could be, for instance, the renovation of PT
infrastructure in the ideation phase (Figure 3 event
(a)), a call for a referendum from part of citizen
groups opposing the UVAR measure in the design
phase (Figure 3 event (b)), the allocation of Park and
Ride (P+R) locations to complement the UVAR
measure in the implementation phase (Figure 3 event
(c)), or the beginning of participatory workshops to
gather citizen feedback on the measure in the
operation phase (Figure 3 event (d)). Making use of
the parameterized instances, we can easily identify
common features in the UVAR process across cities.
From a between city analysis of the parameterized
instances we can see that, for example, monitoring
activities appear in the ideation phase in all 8 city
cases (
Figure 4). Furthermore, in all the cases, its
occurrence is directly linked to the problem
identification and definition.
Similarly, we can observe that improvements in
PT are a constant across all city cases. This is
expected, as these improvements may mitigate some
of the negative externalities of road traffic, thus
falling in line with the objectives of the UVAR
measure and acting as a complement to it. For to an
increase of supply and/or economic incentives for the
use of PT, appear mainly in Bologna, Amsterdam,
Milan, and London. This finding aligns instance, we
can see how improvements in PT linked with the
notion that this kind of interventions are of special
Support in Policymaking: A Systematic Exploration of the Policymaking Process
125
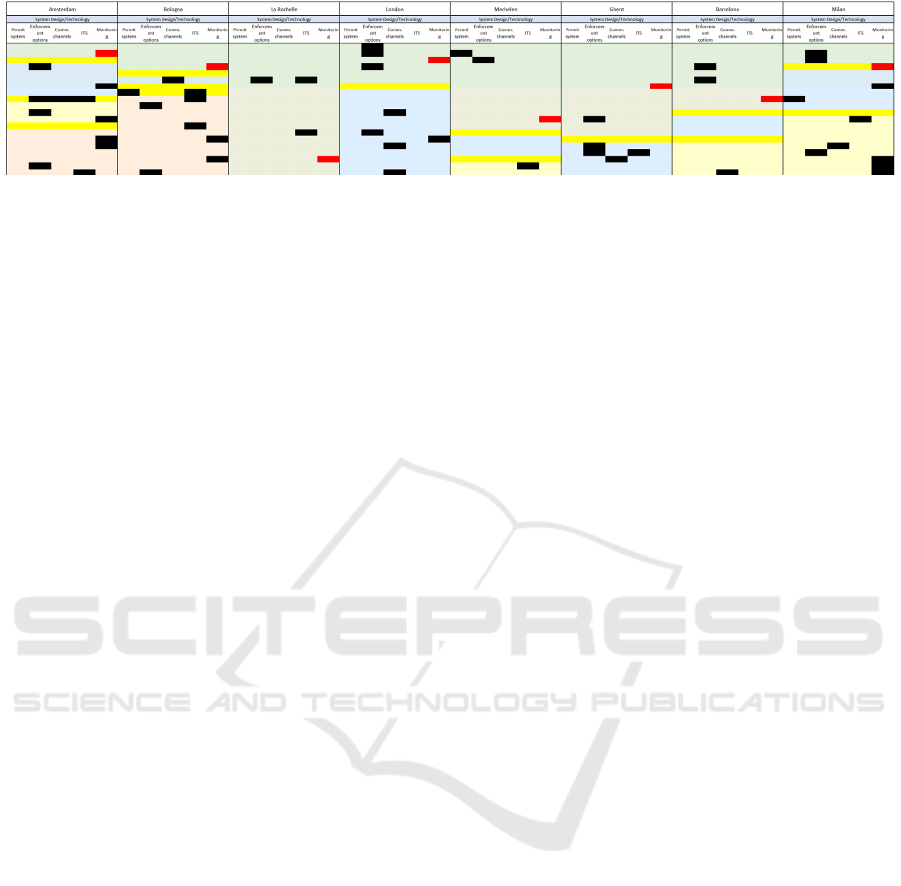
Figure 4: Emergence of monitoring activities in city case studies (in red). Events in green belong to the ideation phase.
importance in restrictive measures such as LEZs,
LTZs, or CCs in order to provide an alternative to
private vehicles (Croci, 2016).
Furthermore, just as the improvements in PT can
be conceived as a complement to the UVAR strategy,
an analysis of the parameterized instances allows us
to see that in all the city cases the UVAR measure is
formally developed as part of a broader strategy that
represents the vision of the city in relation to air
quality, mobility and/or sustainability (Table 1). The
conception of an UVAR as one of the components of
a major political instrument, instead of a stand-alone
measure, seems to provide context and purpose to the
measure, aligning it with the goals of the city and
showcasing the UVAR measure as a “consistent” step
towards the city’s goals.
Another key point of the methodology relates
directly to the data collection process. Making use of
the outcome of the coding process as a rubric that
highlights the important factors case study
researchers should consider during the data collection
process, facilitates the allocation of resources. Case
study researchers can in this way find a major
proportion of the information through desktop
research, before going into the field to corroborate
and complement their findings, e.g., through
interviews or field visits. For the 8 city cases, on
average 53 events were registered in the process
timelines for each city case. From here, we could see
that on average 62 different sources were cited per
city case. The different data sources cover press
releases, official (policy) documents, reports of
special-purpose bodies, interviews, and academic
articles. Of the total number of data sources, field
interviews account for only 19% of the data sources.
Meaning that the remainder 81% of the data sources
could be collected without the need for a field study,
thus reducing the number of resources needed in the
documentation of each city case.
We can see then, how our framework could be
used to identify patterns and common trends in the
policy process that can give light into crucial aspects
of the policy strategy, and thus support policymakers
in the implementation and development of policies.
Additionally, the analysis of the city cases
showcases possible system configurations in a
graphic manner (Figures 3-4) which facilitates the
identification and formulation of alternative scenarios
based on the “patterns” observed in the relevant case
studies. The small number of case studies, however,
restraint us from drawing statistically significant
results. Furthermore, the limited sample size in
combination with the heterogeneity of the sample (in
terms of their urban landscapes), hinders the
identification of useful patterns among the contextual
parameters that could help us support the validity of
these parameters or assess the findings in (Gillis et al.,
2016). Despite all this, we believe the findings
summarized in this section can illustrate the potential
of the methodology in the assessment of policy
processes and inspire future research on the matter.
5 CONCLUSIONS AND FUTURE
WORK
The methodology presented could be used to identify
patterns and trends in the policy process that can give
light into crucial aspects of the policy strategy, and
thus support policymakers in policymaking. The
methodology is based upon a systematic exploration
of the problem space supported by expert knowledge
and case study research.
To illustrate the Framework’s potential, we have
used the case of UVARs in a set of 8 city cases studies
(
Table 1). Despite the small sample size, experiments
suggest that the methodology could be used in a DSS
for the identification of patterns and trends in the data
(in spite of the large amount of data and variables),
and the identification of possible scenarios (policy
configurations). Furthermore, the proposed
methodology seems to facilitate the data collection
process, supporting desktop research and reducing the
time and effort needed for field research.
Finally, the ease of use of the methodology, and
the features of the graphic representation (Figures 3
and 4) suggest that integration with advanced data
KEOD 2021 - 13th International Conference on Knowledge Engineering and Ontology Development
126

analysis techniques could facilitate the identification
of patterns and trends. Furthermore, the methodology
could make use of Big Data to, e.g., monitor public
opinion through the collection and analysis of social
network data, or perform a continuous evaluation and
monitoring of contextual parameters.
ACKNOWLEDGEMENTS
The work reported in this paper is funded under the
European Commission H2020 project ReVeAL –
Regulating Vehicle Access for improved Liveability
(grant agreement No. 815008). ReVeAL is a R&I
project aiming to enable cities to optimize urban
space and transport network usage through new and
integrated packages of urban vehicle access policies
and technologies.
REFERENCES
Bridgman, P., & Davis, G. (2003). What Use is a Policy
Cycle? Plenty, if the Aim is Clear. In Australian
Journal of Public Administration (Vol. 62, Issue 3).
Carnovale, M., & Gibson, M. (2013). The effects of driving
restrictions on air quality and driver behavior. July, 1–
20.
Cohn, D. (2004). The Best of Intentions, Potentially
Harmful Policies: A Comparative Study of Scholarly
Complexity and Failure. Journal of Comparative Policy
Analysis: Research and Practice, 6(1).
Croci, E. (2016). Urban Road Pricing: A Comparative
Study on the Experiences of London, Stockholm and
Milan. Transportation Research Procedia, 14.
Djourelova, M., & Durante, R. (2019). Media Attention and
Strategic Timing in Politics: Evidence from U.S.
Presidential Executive Orders. Economics Working
Papers.
Eisenhardt, K. M., & Graebner, M. E. (2007). Theory
building from cases: Opportunities and challenges.
Academy of Management Journal, 50(1).
Elbert, R., & Friedrich, C. (2019). Simulation-based
evaluation of urban consolidation centers considering
urban access regulations. Proceedings - Winter
Simulation Conference, 2018-December.
Gillis, D., Semanjski, I., & Lauwers, D. (2016). How to
monitor sustainable mobility in cities? Literature
review in the frame of creating a set of sustainable
mobility indicators. In Sustainability (Switzerland)
(Vol. 8, Issue 1).
Goddard, H. C. (1997). Using tradeable permits to achieve
sustainability in the world’s large cities. Policy design
issues and efficiency conditions for controlling vehicle
emissions, congestion and urban decentralization with
an application to mexico city. Environmental and
Resource Economics, 10(1).
Hom, A. R. (2018). Timing is everything: Toward a better
understanding of time and international politics.
International Studies Quarterly, 62(1).
Howlett, M. (2012). The lessons of failure: Learning and
blame avoidance in public policy-making.
International Political Science Review, 33(5).
Howlett, M. (2019). Moving policy implementation theory
forward: A multiple streams/critical juncture approach.
Public Policy and Administration, 34(4).
Howlett, M., Mukherjee, I., & Woo, J. J. (2015). From tools
to toolkits in policy design studies: The new design
orientation towards policy formulation research. Policy
and Politics, 43(2).
Howlett, M., Ramesh, M., & Perl, A. (2009). Studying
public policy: Policy cycles and policy subsystems
(Vol. 3). Oxford University Press Oxford.
Hsieh, H. F., & Shannon, S. E. (2005). Three approaches to
qualitative content analysis. Qualitative Health
Research, 15(9).
Jann, W., & Wegrich, K. (2017). Theories of the policy
cycle. In Handbook of Public Policy Analysis: Theory,
Politics, and Methods.
Kingdon, J. W. (2014). Agendas, Alternatives, and Public
Policy. In Pearson New International Edition.
Lopez, O. N. (2018). Urban vehicle access regulations. In
Sustainable Freight Transport (pp. 139–163). Springer.
Massey, D. (2017). Politics and space/time. In Theory and
Methods: Critical Essays in Human Geography.
Morton, C., Lovelace, R., & Anable, J. (2017). Exploring
the effect of local transport policies on the adoption of
low emission vehicles: Evidence from the London
Congestion Charge and Hybrid Electric Vehicles.
Transport Policy, 60.
Mudway, I. S., Dundas, I., Wood, H. E., Marlin, N.,
Jamaludin, J. B., Bremner, S. A., Cross, L., Grieve, A.,
Nanzer, A., Barratt, B. M., Beevers, S., Dajnak, D.,
Fuller, G. W., Font, A., Colligan, G., Sheikh, A.,
Walton, R., Grigg, J., Kelly, F. J., … Griffiths, C. J.
(2019). Impact of London’s low emission zone on air
quality and children’s respiratory health: a sequential
annual cross-sectional study. The Lancet Public Health,
4(1).
Rittel, H. W. J., & Webber, M. M. (1973). Dilemmas in a
general theory of planning. Policy Sciences, 4(2).
Rosenhead, J. (1996). What’s the problem? An introduction
to problem structuring methods. Interfaces, 26(6).
Schneider, A. L., & Ingram, H. (2017). Public policy and
democratic citizenship: What kinds of citizenship does
policy promote? In Handbook of Public Policy
Analysis: Theory, Politics, and Methods.
Vogel, B., & Henstra, D. (2015). Studying local climate
adaptation: A heuristic research framework for
comparative policy analysis. Global Environmental
Change, 31.
Support in Policymaking: A Systematic Exploration of the Policymaking Process
127
