
Natural Language-based User Guidance for Knowledge Graph
Exploration: A User Study
Hans Friedrich Witschel
a
, Kaspar Riesen
b
and Loris Grether
c
FHNW University of Applied Sciences and Arts Northwestern Switzerland, Switzerland
Keywords:
User Guidance, Knowledge Graphs, Natural Language Interface.
Abstract:
Large knowledge graphs hold the promise of helping knowledge workers in their tasks by answering simple
and complex questions in specialised domains. However, searching and exploring knowledge graphs in cur-
rent practice still requires knowledge of certain query languages such as SPARQL or Cypher, which many
untrained end users do not possess. Approaches for more user-friendly exploration have been proposed and
range from natural language querying over visual cues up to query-by-example mechanisms, often enhanced
with recommendation mechanisms offering guidance. We observe, however, a lack of user studies indicating
which of these approaches lead to a better user experience and optimal exploration outcomes. In this work,
we make a step towards closing this gap by conducting a qualitative user study with a system that relies on
formulating queries in natural language and providing answers in the form of subgraph visualisations. Our
system is able to offer guidance via query recommendations based on a current context. The user study eval-
uates the impact of this guidance in terms of both efficiency and effectiveness (recall) of user sessions. We
find that both aspects are improved, especially since query recommendations provide inspiration, leading to a
larger number of insights discovered in roughly the same time.
1 INTRODUCTION
Knowledge graphs, i.e. networks of connected enti-
ties, constitute a flexible approach to integrating and
storing information gathered from numerous hetero-
geneous sources. Their widespread adoption has led
to an increased interest in exploration mechanisms
(Lissandrini et al., 2020b): while knowledge graphs
may hold vast amounts of potentially very useful in-
formation, accessing, exploring and understanding
that information is a far from trivial task, especially
for untrained end users.
When accessing a knowledge graph, users often
have only a vague information need in mind (Witschel
et al., 2020; Lissandrini et al., 2020a). They may be
able to articulate certain aspects, however, that may
then serve as a starting point for further exploration.
Moreover, many knowledge graphs require the
use of structured query languages such as SPARQL
(P
´
erez et al., 2009) or Cypher (Francis et al., 2018).
Since most users do not have the technical know-how
to use these, many researchers are advocating the use
a
https://orcid.org/0000-0002-8608-9039
b
https://orcid.org/0000-0002-9145-3157
c
https://orcid.org/0000-0002-3024-7130
of more user-friendly syntax, e.g. based on keyword
search (Namaki et al., 2018). This of course poses
new challenges since keyword queries are less precise
than structured query languages (Yang et al., 2014).
Finally, users often do not know the graph schema,
i.e. the available types of nodes/entities and the
types of relationships between them. They are also
unable to estimate the cardinalities of relationships
and are hence often faced with either empty or over-
whelmingly large result sets (Mohanty and Ramanath,
2019).
These challenges clearly suggest a need for user
guidance, offering support e.g. via query suggestion
or reformulation (Mohanty and Ramanath, 2019; Na-
maki et al., 2018) or via result previews (May et al.,
2012).
1.1 Related Work
While the need for guidance seems obvious, there is a
large number of even very basic design options along
several dimensions:
The first dimension concerns the query language
– here, choices range from structured query languages
(P
´
erez et al., 2009; Francis et al., 2018) over keyword-
Witschel, H., Riesen, K. and Grether, L.
Natural Language-based User Guidance for Knowledge Graph Exploration: A User Study.
DOI: 10.5220/0010640500003064
In Proceedings of the 13th International Joint Conference on Knowledge Discovery, Knowledge Engineering and Knowledge Management (IC3K 2021) - Volume 1: KDIR, pages 95-102
ISBN: 978-989-758-533-3; ISSN: 2184-3228
Copyright
c
2021 by SCITEPRESS – Science and Technology Publications, Lda. All r ights reserved
95

based queries (Namaki et al., 2018) in the tradition of
information retrieval systems and questions in natural
language (Tong et al., 2019) from the area of ques-
tion answering (QA) up to the construction of sub-
graphs as a means to perform query-by-example (Ja-
yaram et al., 2015; Yi et al., 2017).
A second dimension concerns the display of re-
sults: while QA systems such as (Tong et al., 2019)
generate a textual response, graph exploration studies
prefer to visualize subgraphs (Gladisch et al., 2013;
May et al., 2012). Here, some studies propose to
return single graphs that a user iteratively explores
(Gladisch et al., 2013; Witschel et al., 2020), others
assume that multiple subgraphs should be provided
as results (Jayaram et al., 2015), whereas a third cat-
egory of approaches aims at graph summaries instead
of full subgraphs (Wu et al., 2013; Yang et al., 2014).
Finally, in a third dimension, one can distin-
guish different forms of interaction: while many
approaches concentrate on the refinement of user
queries (Mohanty and Ramanath, 2019; Namaki
et al., 2018; Bhowmick et al., 2013), be it via auto-
completion, suggestion of alternative or additional
keywords or queries, others work with a notion of
context that allows for e.g. the recommendation of
further directions (May et al., 2012) or “navigation
cues” including a certain kind of preview (Gladisch
et al., 2013). In the area of QA, the notion of “Sequen-
tial Question Answering” addresses the need of users
to iteratively refine queries to address their (evolving)
information need (Saha et al., 2018; Witschel et al.,
2020).
Although each of these possibilities results in a
quite different user experience, there is a surprising
lack of user-based evaluations that would indicate the
relative utility of the given approaches from an end
user perspective: studies in classical question answer-
ing evaluate the effectiveness of their approaches with
datasets comprising the “correct” answers to ques-
tions and thus serving as gold standards (e.g. (Tong
et al., 2019; Saha et al., 2018)). The exploration of
graphs via Sequential Question Answering has led to
the creation of datasets containing dialogs between a
user and a knowledge graph-based QA system (Saha
et al., 2018).
In the area of visual graph exploration, many stud-
ies such as (Mohanty and Ramanath, 2019; Namaki
et al., 2018; Pienta et al., 2017; Gladisch et al.,
2013; Bhowmick et al., 2013) provide “demonstra-
tions” of their approach, but there is no user-based
evaluation. Others also use datasets as gold stan-
dards and make assumptions about ground truths (Ja-
yaram et al., 2015; Yogev et al., 2012) or user efforts
for query construction (Lissandrini et al., 2020a),
whereas still others focus on efficiency and user wait-
ing times (Jin et al., 2012; Mottin et al., 2015).
None of these studies have involved actual end
users in the evaluation of their approaches. (Gladisch
et al., 2013) are aware of this drawback and mention
the need for user-based evaluation as a “pressing is-
sue”. In (May et al., 2012), a user study is reported fo-
cusing on the efficiency of participants to solve a task
with or without navigation support. Somewhat simi-
larly (but not applied to knowledge graphs), (Yi et al.,
2017) measures the number of clicks that can be saved
in the construction of subgraph queries when applying
query autocompletion. While the results are interest-
ing, we believe that much more insight is needed, in
particular – as discussed in the next subsection – to
understand not only gains in efficiency, but also the
effectiveness of entire user sessions.
1.2 Contribution
We aim at addressing also effectiveness issues:
we first describe a further development of our
graph-based sequential question answering system
(Witschel et al., 2020), which we enhance with
a context-aware query recommendation mechanism.
Based on this, we aim to answer the following two
research questions with a user experiment:
• Do query recommendations make knowledge
graph exploration more efficient, i.e. do users find
relevant answers faster than without that support?
• Does the query recommendation result in a more
effective search, especially in terms of recall, i.e.
do users find more answers / derive more insights
than without it?
Especially the second question is a novel one in
the area of knowledge graph exploration. In our study,
we consider the effectiveness of an entire user session
devoted to the exploration of a larger group of themes,
i.e. not limited to a specific detailed query or discov-
ery task and not constrained by a narrow set of ex-
pected outcomes. We strongly believe that a broad
and relatively unconstrained setting is important to
evaluate the effects of user guidance in exploratory
settings.
The system that we have developed can be seen
as our “best guess” regarding an optimised user expe-
rience w.r.t. the above-mentioned research questions.
We will provide arguments for that approach and a
detailed description in Section 2. Section 3 describes
the setup and results of our experimental user study,
from which we draw some conclusions and further di-
rections in Section 4.
KDIR 2021 - 13th International Conference on Knowledge Discovery and Information Retrieval
96

2 CONTEXT-BASED QUERY
RECOMMENDATION
2.1 Knowledge Graph Exploration via
Sequential Question Answering
Our approach to knowledge graph exploration is
based on a paradigm of interactive question-answer
steps as described in (Witschel et al., 2020).
In a nutshell, the approach works as follows:
• In step 0, a user finds an entry point into a knowl-
edge graph G = (V, E) via keyword search (see
Figure 1, “Step 0”), which returns all nodes v ∈ V
whose string properties contain (a subset of) the
entered keywords. The retrieved nodes are ini-
tially disconnected. The search can be constrained
by node type filters on the left side.
• In each step i, the user sees a certain subgraph
G
i
⊂ G. The user can select a set of nodes N
G
i
that serves as a context. In the example in Figure
1, the user selected both blue nodes as a step 1a.
Then, the user can ask a question about the chosen
context in natural language – the example ques-
tion “Which diseases cause these symptoms” is
shown at the bottom (step 1b). The system parses
the question, translates it into the query languega
Cypher
1
and displays the result as a new subgraph
G
i+1
Thus, the system is a hybrid QA system, accept-
ing questions in natural language and giving answers
in the form of subgraph visualisations. In our small
user study in (Witschel et al., 2020), we have been
able a) to confirm the user-friendliness of natural lan-
guage as a query language, b) to show that visuali-
sation of subgraphs supports users in quickly under-
standing patterns even in complex answers and c) to
prove the intuitiveness of alternating context selection
and querying as a means of iterative refinement and
exploration.
2.2 Recommendations: User
Perspective
However, when users are faced with the challenge to
use a knowledge graph to satisfy an initially vague
and fuzzy information need, there are still two main
obstacles:
• The user might be overwhelmed with the large
number of possibilities for querying (Gladisch
et al., 2013). This fact is aggravated by the
1
https://neo4j.com/
fact that users are initially unaware of the graph
schema (Yi et al., 2017).
• Although natural language is user-friendly, it is
ambiguous and its parsing is hence error-prone
(Shekarpour et al., 2017).
Therefore, we extend our interaction concept by
query recommendations displayed to users when they
select a set of nodes N
G
i
as a context. An example
is shown in Figure 2, where the user has select the
node “pneumonia” (of type disease) and now receives
query suggestions for further exploration.
The recommendations solve both of the above-
mentioned problems since a) they provide guidance
and inspiration by implicitly informing the user about
relationships and adjacent node types and b) they are
automatically generated and hence guaranteed to be
parsed correctly.
2.3 Recommendation Heuristics
Our query recommendation algorithm is based on a
number of intuitions: there are three main types of
queries that are recommended, namely
• Relation queries, ask for nodes that are related
to nodes in the current context N
G
i
, e.g. “Which
treatments treat this disease?”. Here, the bold
font indicates the type of nodes that are to be re-
trieved (we will call it the “return type”), the italic
font indicates the current context.
• Similarity queries ask for nodes that are of the
same type as those in N
G
i
and share many adjacent
nodes, e.g. “Which diseases are similar to this
one?”
• Filter queries, ask for a subset of currently se-
lected nodes that fulfil a certain condition, e.g.
“Which of these diseases have a contraindica-
tion?”
We have consciously limited the choice of avail-
able query types to these simple alternatives since we
believe that the sequential exploration process sup-
ported by our interaction paradigm allows to satisfy
also very complex information needs, even if the
queries applied in that process are fairly simple.
To understand how queries are generated, let C =
N
G
i
be the set of currently selected nodes (the current
context). Further, let N be the set of currently visible
nodes (i.e. all nodes in the currently displayed graph
G
i
) and N
0
the set of all nodes that were visible in the
previous step, i.e. in G
i−1
.
The main question to answer by our heuristics is:
where would the user like to go next? To answer this
question, the following considerations can be helpful:
Natural Language-based User Guidance for Knowledge Graph Exploration: A User Study
97
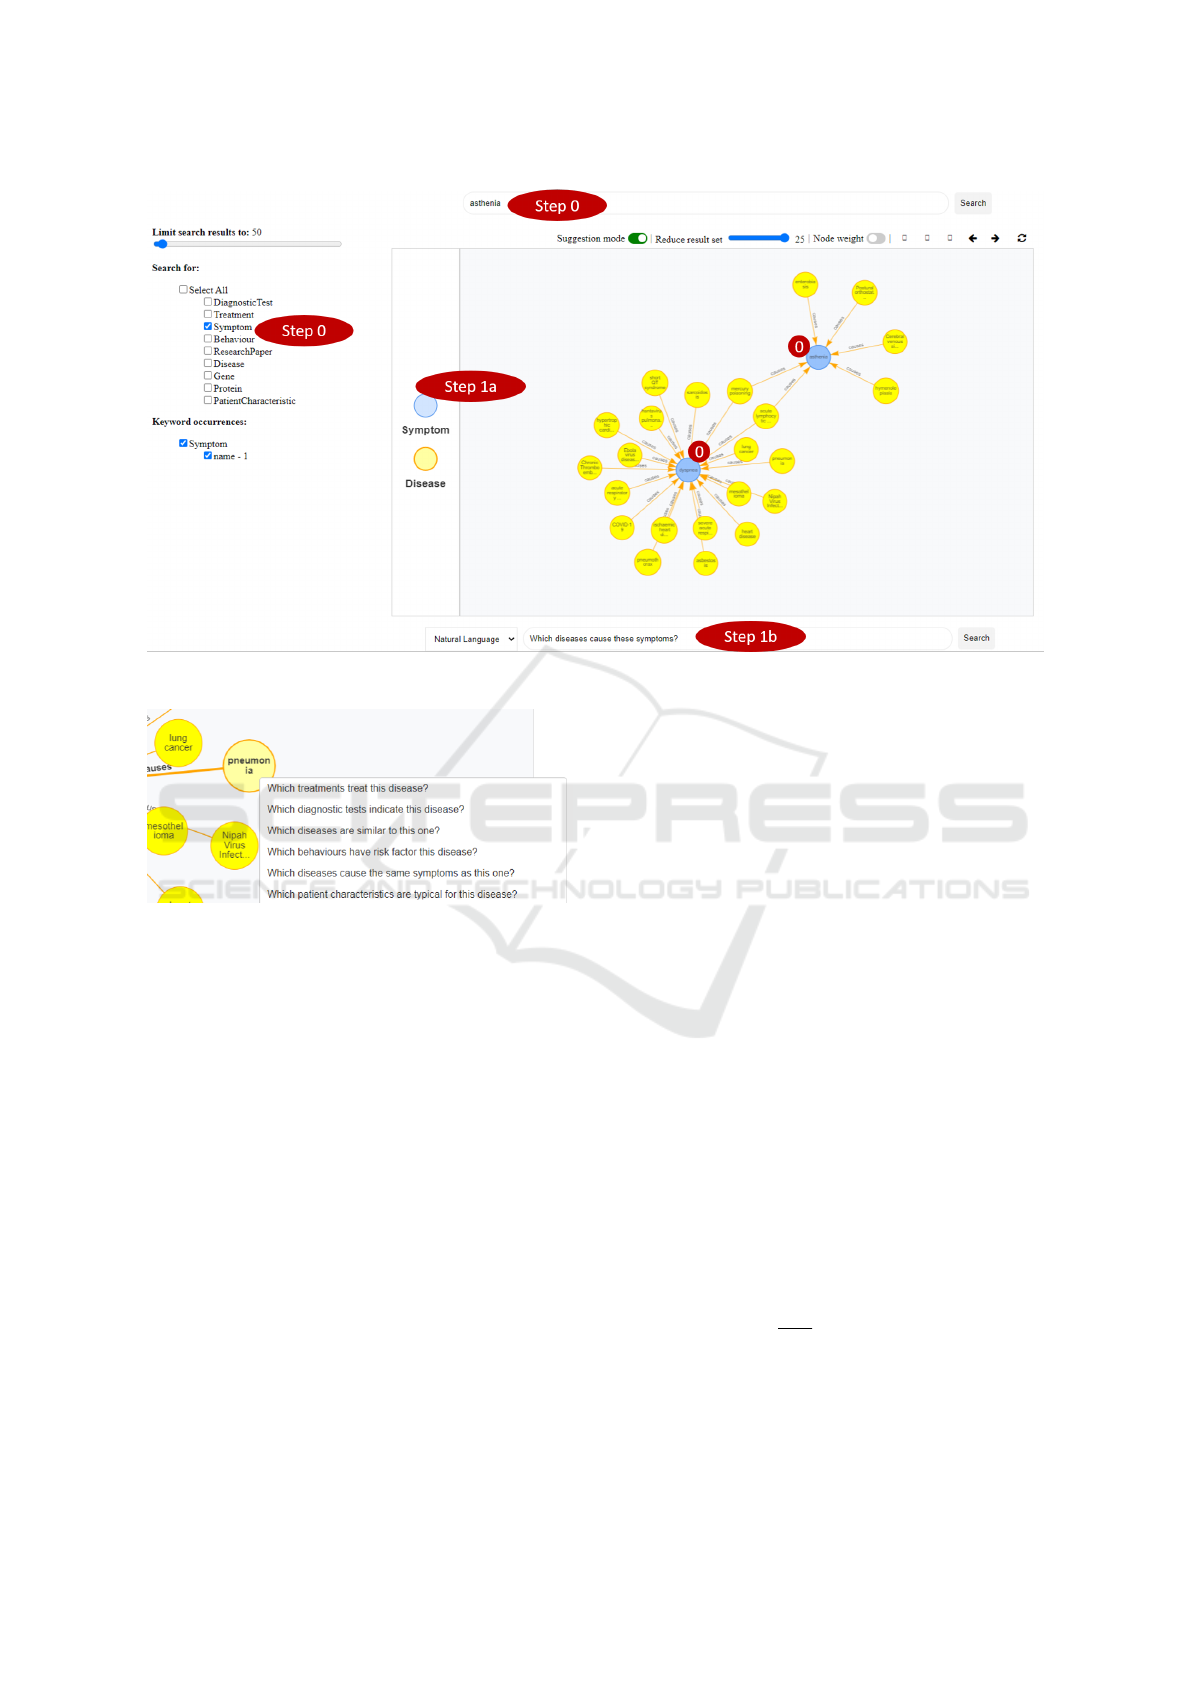
Figure 1: The knowledge graph exploration interface.
Figure 2: Queries recommended when choosing the node
“pneumonia”.
• If the context C consists of a large number of
nodes, the user is more likely to be interested
in asking a filter query. Conversely, similarity
queries are more probable when only one node is
selected.
• Otherwise, relation queries are generally very
common. Since one usually wants to explore new
entities, asking for node types that are currently
displayed or have been displayed in the step be-
fore is less likely.
• The probability of asking for a certain node type
(return type) depends on its connectedness in the
schema graph – i.e. node types that have rela-
tions to many other node types can be expected
to be more common and hence more likely to be
queried for.
• Queries involving node types or relationships with
names consisting of several words are considered
as “complex” and hence less probable – the length
of a query in words can be used as a simple ap-
proximation of its general complexity.
Given these intuitions, we implemented our query
generation algorithm as follows:
1. Generate candidate queries q
i
for each node type,
including relation, similarity and filter queries.
This is done by using the names of node types
as subjects and objects and the names of rela-
tionships as verbs. For instance, for a given re-
turn type <x> and a context of nodes of type
<c>, which are connected by a relationship <r>
pointing from <c> to <x>, a relation query
has the general form “Which <x> <r> these
<c>?”, e.g. “Which <diseases> <cause> these
<symptoms>?”. Any context consisting of type c
nodes will trigger the same query recommenda-
tions.
2. For each node type in the graph G, compute a
score based on C, N and N
0
, see Section 2.4 be-
low.
3. Each query candidate q
i
from step 1 is initially
scored by the score of its return type. In a fi-
nal step, these scores are multiplied by a length
weight that reflects the complexity of the query
and is given by
1
1+d
2
where d = |q
i
| − min
j
|q
j
| is
the difference between q
i
’s length in words and
the length of the shortest query candidate.
4. Rank candidate queries by their score and display
the top k queries to the user.
KDIR 2021 - 13th International Conference on Knowledge Discovery and Information Retrieval
98

2.4 Pre-scoring of Node Types
Pre-scoring of node types makes use of both the cur-
rent view C and N of the search and the very recent
history N
0
. For the below definitions, let N
t
be the set
of nodes n ∈ N and N
0
t
the nodes n
0
∈ N
0
of type t.
For node types t that are currently on display
(|N
t
| > 0) or were on display in the previous step
(|N
0
t
| > 0), we assign fixed probabilities, depending
on whether they are assumed to be the result of a filter
query (|N
t
| > 0 and |N
0
t
| > 0, but |N
t
| < |N
0
t
|, low prob-
ability), a “new” node type (|N
t
| > |N
0
t
| = 0, also im-
probable) or “abandoned” node types (|N
0
t
| > |N
t
| = 0,
slightly more probable).
For node types t that have not been on display
in either the current or previous step, i.e. for which
|N
t
| = |N
0
t
| = 0, we apply the intuition that their proba-
bility depends on how easily they can be reached from
N within the schema graph (see above). We have im-
plemented this intuition by applying a biased random
walk, using PageRank with priors (White and Smyth,
2003) on the schema graph – where we initialise by
assigning some non-zero uniform prior weights to all
n ∈ N and some slightly higher uniform weights to all
n ∈ C.
3 EXPERIMENTS
3.1 Experimental Setup and
Methodology
For our user study, we set up a large medical knowl-
edge graph by gathering data from a number of
sources, see (Riesen, 2020).
We then recruited 10 persons (2 female) studying
in a Master program of “Medical Informatics”. All
of them had a very basic background in medicine,
some had more advanced medical knowledge from
specific work experiences. However, none of them
had a deeper knowledge in medical diagnosis and
treatment. We can therefore assume that our test per-
sons can take the role of a very inexperienced junior
doctor who is in need of medical knowledge when
handling a new patient case. We prepared a corre-
sponding case, consisting of some minimal informa-
tion about a patient’s demographics (age and gender)
and symptoms.
We divided test persons into a test and a control
group such that both groups had to solve the task us-
ing our system – the control group working only with
the basic approach described in Section 2.1 and the
test group additionally with query recommendations
as described in Section 2.2. Despite our small sample
size – which prohibits any quantitative experimental
evaluation – we believe that this setup helps to avoid
the bias and learning effects that would result when
having all test persons work with both setups. The as-
signment of participants to test and control group was
randomized.
All participants received the same introduction
to the tool, demonstrating the general interaction
paradigm of sequential question answering with some
example queries which were unrelated to their task.
Test group participants additionally got a demo of
query recommendations as shown in Figure 2. All
participants were then introduced to the task (see
above) and asked to solve it with the help of the
knowledge graph. They were encouraged to think out
loud while doing so.
All sessions were video-recorded and later an-
notated with the help of the video annotation tool
ANVIL
2
by the authors of this paper. In line with
our two research questions defined in Section 1.2, we
annotated and then measured two things for each par-
ticipant:
• We annotated different kinds of activities that par-
ticipants were performing while solving the task
and measured the time spent on each. These ac-
tivities were: strategising (i.e. figuring out what to
do next to get closer to the solution), studying sug-
gestions (i.e. reading recommended queries be-
fore choosing one), interpreting results (i.e. dis-
cussing how a returned subgraph would help to
solve the task) and struggling (i.e. trying to figure
out how to use tool functionalities to accomplish
a goal). We also annotated struggling activities
with an inductively derived set of sub-categories,
i.e. different ways of struggling. These measure-
ments will help us to judge the efficiency of solv-
ing the task. The time spent with struggling also
gives an indication of precision of e.g. suggested
queries.
• We annotated situations where participants re-
trieved a result as “insights”. Given our task, we
formulated some expected insights, e.g. to find
diseases causing the described symptoms, to find
further symptoms to use for differentiation, to find
out for which patient groups retrieved diseases are
typical, which treatments to apply etc. Besides
these, we also annotated insights retrieved by par-
ticipants that went beyond these expectations. All
retrieved and annotated insights bear some rele-
vance w.r.t. the task. Thus, the number of in-
sights derived during a session gives an indication
2
https://www.anvil-software.org/
Natural Language-based User Guidance for Knowledge Graph Exploration: A User Study
99

Figure 3: Total duration of user activities within sessions.
about the effectiveness of the exploration, in par-
ticular its recall.
In addition to these annotations, we also con-
ducted a small interview directly after each session,
asking participants to both rate and comment on the
following aspects:
• The general ease or difficulty of finding one’s way
through the knowledge graph
• the perceived efficiency of completing their task
• their confidence of having discovered all relevant
insights contained in the graph
Although we asked for a rating (from 1 to 5) on
each aspect, the ratings are not reported here – as we
expected, they depend very much on the personality
of participants. Instead, we focused on their explana-
tions and comments to gain qualitative insights.
3.2 Results and Discussion
3.2.1 Efficiency
The upper part of Figure 3 shows the total duration (in
seconds) of activities within the user sessions. Since
we did not cut off the sessions, their duration varied
slightly – control group (CG) sessions took overall
more time. The time spent on interpreting results was
comparable in both groups. While test group (TG)
participants spent much less time on pure strategis-
ing, a significant share of their time went into study-
ing query recommendations – which can be seen as a
system-supported way of strategising. Thus, regard-
ing the planning of next steps, the overall time differ-
ence between both groups was minimal. From a qual-
itative point of view, we observed that all test group
participants pondered the recommended queries very
carefully. Often, the time for doing so was prolonged
by strange or less useful recommendations in the list,
causing confusion – which indicates that the qual-
ity of recommendations (which we are not evaluat-
ing here) plays a role for the efficiency of solving the
task. With the current implementation, it seems at first
glance that there is no significant efficiency gain from
query recommendations as far as the planning of next
steps is concerned. However, as we will see in Sec-
tion 3.2.2 below, test group participants do achieve a
larger number of insights in the given time – which
does suggest efficiency gains.
There was a notable difference in struggling with
the tool functionalities, on which test group partici-
pants spent only roughly an average of 2.4 minutes
whereas control group participants wasted an average
of almost 4 minutes on it. A significant portion of this
extra time was spent with query formulation – a prob-
lem that test group participants could avoid almost
entirely by using the recommended queries. On the
other hand, test group participants were more prone
to the mistake of failing to select multiple nodes as
a context when this was required (e.g. selecting both
symptoms before asking which diseases cause them).
An explanation for this – backed also by our obser-
vations – is that query recommendations pop up im-
mediately when clicking on an individual node. Test
group participants were thus tempted to fire off these
queries without caring enough about a proper con-
text selection. The problem of context selection was
already observed in our first study (Witschel et al.,
2020) – where we could however also show that users
need a bit of time to get used to it, but then pick it up
rather quickly. All in all, we can carefully conclude
that query recommendations slightly increase the ease
of use of our tool.
A last interesting finding was that users had false
expectations regarding the node type filters on the
left side of the user interface (see Figure 1): while
these are only meant to help narrow down initial key-
word searches – and are not meant to be used in sub-
sequent steps – participants understood that they re-
vealed information about the graph schema (all avail-
able node types). In the control group, all partici-
pants tried to select node types to constrain results
in a subsequent query result at least once (marked
“wanted
to use checkboxes” in the lower part of Fig-
ure 3). Since query recommendations also contain
some hints about the graph schema, test group par-
ticipants were less likely to fall into that trap.
When discussing about this problem, some partic-
ipants (from both groups equally) stated that natural
language queries are intuitive, but sometimes just se-
lecting a node type and then expanding a context by
retrieving all nodes of the chosen type connected to
that context would be a useful feature. This implies
that natural language queries may not be the most
user-friendly navigation aid for all users in all situ-
ations.
KDIR 2021 - 13th International Conference on Knowledge Discovery and Information Retrieval
100

Figure 4: Insights derived in user sessions.
3.2.2 Effectiveness/Recall
As explained above, our main indicator of effective-
ness was the number of insights covered in a given
session. As shown in Figure 4, test group users dis-
covered an average of 5.4 insights whereas control
group users found only 3.4. More precisely, the num-
ber of insights in the test group sessions were (4, 5, 5,
6, 7); in the control group the distribution was (3, 1,
3, 7, 3). This shows that results in the control group
depend more heavily on the creativity and previous
knowledge of participants, whereas query recommen-
dations seem to achieve a higher and more reliable
number of insights in the test group. This leads us
to the conclusion that query recommendations can in-
crease recall by providing not only guidance regard-
ing the graph schema, but also providing inspiration
for further insights.
If we consider that test group participants have
discovered a larger number of insights and that test
group sessions were on average slightly shorter (see
Figure 3, top), we can slightly revise our conclusions
regarding efficiency: since more results are achieved
in the same timeframe, query recommendations do
seem to have a positive effect on efficiency, too.
3.2.3 Post-test Interview Results
The answers of participants in the post-test interviews
showed quite little differences between control and
test group regarding the ease of use/navigation. All
participants of both groups found the tool either easy
to use or easy to get used to (in line with our findings
in (Witschel et al., 2020)), pointing out a few usability
issues.
Similarly, participants in both groups rated the ef-
ficiency as high, some of them mentioned that a lack
of knowledge slowed them down, but that the tool
helped them. While control group members mainly
mention that they got used to the paradigm quickly,
test group participants refer notably more often to be-
ing “guided” or “helped to find a way”. Finally, nei-
ther of the two groups are very confident regarding
the recall of their search.
All in all, perceptions in both groups seem to be
very similar. As a single notable difference, test group
members were more likely to refer to the guidance
that the tool offered them and its help in finding a
good strategy.
4 CONCLUSIONS
In this study, our goal was to investigate the extent to
which user guidance mechanisms, in particular query
recommendations, can boost the efficiency and effec-
tiveness of knowledge graph exploration. We have
developed a simple iterative exploration mechanism
of alternating context selection and querying and en-
riched it with heuristics-based query recommenda-
tion. We then conducted a qualitative user study to
understand the impact of the recommendations on ef-
ficiency and effectiveness.
The findings of our user study suggest that rec-
ommendations provide some gains in efficiency, es-
pecially when considering how much time is needed
per discovered insight – although participants in both
test and control group spent about the same time plan-
ning and strategising, we observed that test group par-
ticipants discovered a significantly higher number of
insights, i.e. they achieve more “output” in the same
time. Furthermore, we conclude that recommenda-
tions seem to have an “inspiring” effect, leading to
an increased recall. This guiding effect was also sub-
jectively perceived by test group members who stated
that the recommendations helped them in defining
their strategy for solving the task.
Since our findings also showed that suboptimal
query recommendations can slow down knowledge
graph exploration quite significantly, checking the ef-
fectiveness of our recommendation heuristics in more
detail, as well as working on more sophisticated rec-
ommendation mechanisms is an obvious focus of fu-
ture work. Such work may be based on collection of
(training) data from user sessions, applying machine
learning techniques to predict the best queries based
on past user decisions, eventually replacing our sim-
ple heuristics.
Another direction for future work could be to
work on easy-to-use guidance mechanisms that allow
quick navigation without the use of natural language
queries – which a user currently has to either type or
read through. We expect that a combination of such
simple graphical and click-based mechanisms with
natural language queries might be better than each of
these alone.
Natural Language-based User Guidance for Knowledge Graph Exploration: A User Study
101

ACKNOWLEDGEMENTS
Supported by Innosuisse Project Nr. 26281.2 PFES-
ES.
REFERENCES
Bhowmick, S. S., Choi, B., and Zhou, S. (2013). VOGUE:
Towards A Visual Interaction-aware Graph Query
Processing Framework. In Cidr. Citeseer.
Francis, N., Green, A., Guagliardo, P., Libkin, L., Lin-
daaker, T., Marsault, V., Plantikow, S., Rydberg, M.,
Selmer, P., and Taylor, A. (2018). Cypher: An evolv-
ing query language for property graphs. In Proceed-
ings of the 2018 International Conference on Manage-
ment of Data, pages 1433–1445.
Gladisch, S., Schumann, H., and Tominski, C. (2013). Nav-
igation recommendations for exploring hierarchical
graphs. In International Symposium on Visual Com-
puting, pages 36–47. Springer.
Jayaram, N., Khan, A., Li, C., Yan, X., and Elmasri, R.
(2015). Querying knowledge graphs by example en-
tity tuples. IEEE Transactions on Knowledge and
Data Engineering, 27(10):2797–2811.
Jin, C., Bhowmick, S. S., Choi, B., and Zhou, S. (2012).
PRAGUE: A practical framework for blending visual
subgraph query formulation and query processing. In
In ICDE, volume 10. Citeseer.
Liang, S., Stockinger, K., de Farias, T. M., Anisimova, M.,
and Gil, M. (2021). Querying knowledge graphs in
natural language. Journal of Big Data, 8(1):1–23.
Lissandrini, M., Mottin, D., Palpanas, T., and Velegrakis,
Y. (2020a). Graph-query suggestions for knowledge
graph exploration. In Proceedings of The Web Con-
ference 2020, pages 2549–2555.
Lissandrini, M., Pedersen, T. B., Hose, K., and Mottin, D.
(2020b). Knowledge graph exploration: where are we
and where are we going? ACM SIGWEB Newsletter,
(Summer 2020):1–8.
May, T., Steiger, M., Davey, J., and Kohlhammer, J. (2012).
Using signposts for navigation in large graphs. In
Computer Graphics Forum, volume 31, pages 985–
994. Wiley Online Library.
Mohanty, M. and Ramanath, M. (2019). Insta-search: To-
wards effective exploration of knowledge graphs. In
Proceedings of the 28th ACM International Confer-
ence on Information and Knowledge Management,
pages 2909–2912.
Mottin, D., Bonchi, F., and Gullo, F. (2015). Graph
query reformulation with diversity. In Proceedings of
the 21th ACM SIGKDD International Conference on
Knowledge Discovery and Data Mining, pages 825–
834.
Namaki, M. H., Wu, Y., and Zhang, X. (2018). Gexp: Cost-
aware graph exploration with keywords. In Proceed-
ings of the 2018 International Conference on Manage-
ment of Data, pages 1729–1732.
P
´
erez, J., Arenas, M., and Gutierrez, C. (2009). Seman-
tics and complexity of sparql. ACM Transactions on
Database Systems (TODS), 34(3):1–45.
Pienta, R., Hohman, F., Endert, A., Tamersoy, A., Roundy,
K., Gates, C., Navathe, S., and Chau, D. H. (2017).
Vigor: interactive visual exploration of graph query
results. IEEE transactions on visualization and com-
puter graphics, 24(1):215–225.
Riesen, K. (2020). A novel data set for information re-
trieval on the basis of subgraph matching. In Struc-
tural, Syntactic, and Statistical Pattern Recognition:
Joint IAPR International Workshops, S+ SSPR 2020,
Padua, Italy, January 21–22, 2021, Proceedings, page
205.
Saha, A., Pahuja, V., Khapra, M. M., Sankaranarayanan, K.,
and Chandar, S. (2018). Complex sequential question
answering: Towards learning to converse over linked
question answer pairs with a knowledge graph. In
Thirty-Second AAAI Conference on Artificial Intelli-
gence.
Shekarpour, S., Marx, E., Auer, S., and Sheth, A. (2017).
Rquery: rewriting natural language queries on knowl-
edge graphs to alleviate the vocabulary mismatch
problem. In Proceedings of the AAAI Conference on
Artificial Intelligence, volume 31.
Tong, P., Zhang, Q., and Yao, J. (2019). Leveraging domain
context for question answering over knowledge graph.
Data Science and Engineering, 4(4):323–335.
Van Ham, F. and Perer, A. (2009). “search, show con-
text, expand on demand”: Supporting large graph ex-
ploration with degree-of-interest. IEEE Transactions
on Visualization and Computer Graphics, 15(6):953–
960.
White, S. and Smyth, P. (2003). Algorithms for estimat-
ing relative importance in networks. In Proceedings
of the ninth ACM SIGKDD international conference
on Knowledge discovery and data mining, pages 266–
275.
Witschel, H. F., Riesen, K., and Grether, L. (2020). Kvgr: A
graph-based interface for explorative sequential ques-
tion answering on heterogeneous information sources.
In European Conference on Information Retrieval,
pages 760–773. Springer.
Wu, Y., Yang, S., Srivatsa, M., Iyengar, A., and Yan, X.
(2013). Summarizing answer graphs induced by key-
word queries. Proceedings of the VLDB Endowment,
6(14):1774–1785.
Yang, S., Xie, Y., Wu, Y., Wu, T., Sun, H., Wu, J., and Yan,
X. (2014). SLQ: a user-friendly graph querying sys-
tem. In Proceedings of the 2014 ACM SIGMOD Inter-
national Conference on Management of Data, pages
893–896. ACM.
Yi, P., Choi, B., Bhowmick, S. S., and Xu, J. (2017). Autog:
a visual query autocompletion framework for graph
databases. The VLDB Journal, 26(3):347–372.
Yogev, S., Roitman, H., Carmel, D., and Zwerdling, N.
(2012). Towards expressive exploratory search over
entity-relationship data. In Proceedings of the 21st
International Conference on World Wide Web, pages
83–92.
KDIR 2021 - 13th International Conference on Knowledge Discovery and Information Retrieval
102
