
Multi-resistant Bacterial Infection Surveillance using a Graph Database
with Spatio-temporal Information
Lorena Pujante
1 a
, Manuel Campos
1,2,3 b
, Jose M. Juarez
1,2 c
, Bernardo Canovas-Segura
1 d
and
Antonio Morales
1 e
1
AIKE, Research Group, Faculty of Computer Science, University of Murcia, Spain
2
INTICO Research Institute, Spain
3
Murcian Bio-Health Institute (IMIB-Arrixaca), Spain
Keywords:
Graph Analytics, Graph Database, Epidemiology, Infection Surveillance.
Abstract:
Some of epidemiologists’ efforts in dealing with multi-resistant bacterial infections acquired in healthcare
settings focus on tracing patient’s activities, carrying out a contact analysis, and identifying the main risk
factors that lead the appearance of these infections. Most contact analysis studies assume information is stored
in conventional relational databases. To date, little attention has been paid to other storage paradigms. This
paper explores the potential of graph databases to establish the complex relations required to compute contact
analysis. We discuss the advances in modelling of the temporal and the spatial information of the Electronic
Health Record that has to be introduced in the graph database. In this position paper we propose three points
for discussion: advances in formal modelling, specific algorithms for graph analysis, and visualisation tools.
1 INTRODUCTION
We are living in a global pandemic situation this year.
We are facing a context where capacity restrictions in
any establishment are imperative, especially in hospi-
tals and health care centers, since they may became
important sources of contagion. However, the spread
of diseases among inpatients is not new, and the ap-
pearance of viral or bacterial infection outbreaks is
usual in hospitals. These are the nosocomial infec-
tions that have become a major health problem today.
They are a widespread scourge, which appears in both
developed and in-development countries. And its
clinical and economic impact are increasingly signifi-
cant due to increasingly crowded conditions in hospi-
tals, the emergence of new organisms, and increasing
bacterial resistance to antibiotics (World Health Or-
ganization, 2003).
Infections acquired or associated to healthcare are
among the leading causes of death and increased mor-
bidity in hospitalized patients (de Leon, 1991). These
a
https://orcid.org/0000-0003-3884-3049
b
https://orcid.org/0000-0002-5233-3769
c
https://orcid.org/0000-0003-1776-1992
d
https://orcid.org/0000-0002-0777-0441
e
https://orcid.org/0000-0002-0872-5351
infections can be caused by a pathogen contracted
from another patient in the hospital or by the patient’s
own flora; and transmitted both through the air, by
food or by contact with any inanimate object (World
Health Organization, 2003). Given the high level of
importance of these infections, together with the wide
range of causes they encompass, their detection and
prevention has become one of the current challenges
in epidemiology (Edwarson and Cairns, 2019).
One important bottleneck of the data analysis
of contacts is to extract a clear trace of the activ-
ity of patients from the Electronic Health Records
(EHRs) stored in the Health Information System
(HIS) databases. In general, commercial HIS are sup-
ported by relational databases (RDBs) making diffi-
cult to manage the complex relations between the dif-
ferent dimensions of study: clinical data and spatial-
temporal information.
Specifically, the objective of this preliminary re-
search is to evaluate the use of spatial and temporal
data modeling with the language and tools provided
by Neo4j
1
, a graph-oriented database to carry out
a contact analysis among hospitalized patients. This
analysis is situated in the context of the appearance of
bacterial outbreaks among hospitalized patients, and
1
Neo4j: https://neo4j.com/
Pujante, L., Campos, M., Juarez, J., Canovas-Segura, B. and Morales, A.
Multi-resistant Bacterial Infection Surveillance using a Graph Database with Spatio-temporal Information.
DOI: 10.5220/0010387207410746
In Proceedings of the 14th International Joint Conference on Biomedical Engineering Systems and Technologies (BIOSTEC 2021) - Volume 5: HEALTHINF, pages 741-746
ISBN: 978-989-758-490-9
Copyright
c
2021 by SCITEPRESS – Science and Technology Publications, Lda. All rights reserved
741

its purpose is to provide support in the detection of
the focus of infection through the area of influence
of the outbreak. We also compare the results with
those of a previous work (Pujante et al., 2020) using
the OrientDB database, showing differences between
languages and modeling.
2 BACKGROUND
Non-relational databases, among which the graph-
oriented databases, GDB, arise in response to the lim-
itations that relational databases present to face the
new challenges and trends that are emerging in the
current world of computing and data management.
The GBDs specify their scope of action in scenarios
in which it is necessary to work with highly connected
data sets, being designed for optimal storage and nav-
igation through the relationships established between
them. Thus, in this type of databases, the data are
stored as the nodes of a graph, and their relationships
as the edges, allowing to apply the theory of graphs
to traverse the data stored in the database (Angles and
Gutierrez, 2008).
Neo4j is a native graph-oriented database that uses
a model of labeled and property graphs. Labeled
graphs consist of graphs in which labels can be as-
signed (generally an integer, although they can also
be of another type of data, such as text strings) both to
their nodes and to their edges to distinguish them from
the rest. As for property graphs, they are weighted
graphs (their edges have some kind of numerical eval-
uation) in which properties can be defined in key-
value format on both nodes and edges. Neo4j uses
its own descriptive language, Cypher, with which
the queries are made by describing the nodes, edges
and properties to be obtained, having a very different
structure from that of SQL.
Regarding the study of infection diseases, re-
searchers of (Lose et al., 2019) focus on Tuberculosis
disease research from the biology perspective, repre-
senting biological entities in a labelled property graph
using Neo4J. From the theoretical point of view, sev-
eral models recently described the spread of disease
(Huang et al., 2016). However, little attention is paid
on the use of GDBs for infectious diseases from an
epidemiological perspective. There are several stud-
ies that explore the advantages that graph modeling
can offer for tracing the spread of epidemics. Exam-
ples of them are (Grande et al., 2015), where graphs
have been used to represent the spread of the hep-
atitis C virus, distinguishing different types of per-
son nodes according to certain characteristics, such
as sex and age; or (Chen et al., 2011), where the au-
thors used social network analysis with a contact net-
work. In (Y. Kai and Jun, 2018) weighted graphs has
been theoretically studied to simulate the spread of an
epidemic. In (M. Boman and Stenhem, 2006), three-
dimensional graphs are used to represent the analysis
of contacts between individuals in specific geographic
areas in which an outbreak has been detected. The
work of (Chen et al., 2007) used geographical infor-
mation to analyse outbreaks for SARS diseases. As
far as we know, there is not research on the litera-
ture of the use of GDBs for analysing infection spread
in hospitals considering spatial and temporal informa-
tion.
3 MODELING CLINICAL
EVENTS AND
SPATIO-TEMPORAL
RELATIONS
With this modeling we can represent a common case
like the following:
A patient arrives at the emergency room with se-
vere stomach pain and is treated by the digestive
medicine service, specifically by its emergency unit,
and remains in a box for 4 hours. She then goes to
the plant where another unit of the same service is re-
sponsible for her care for a day. The next day she un-
derwent an operation, which entailed a change of bed
for the operating room, although she was still treated
by the same unit in the same floor. At the end of the
surgery, she returns to the same room and bed where
she remains until he is discharged after three days.
It is necessary to model the clinical events, the
spatial configuration of the hospital, and the temporal
relations between the events and the locations of the
patient during the care trajectory. This case is mod-
eled as a graph in Figure 1.
Regarding the locations, it is necessary to estab-
lish a physical organization of the hospital that is spe-
cific enough to track the care trajectory, but also gen-
eral enough to adapt to the different architectures that
hospital may present. It is also required to have a flex-
ible structure that allows the grouping of Areas and
Zones of the same or different floor. This concept is
LogicalZone, which can also host other logical zones
under the sole condition that no cycles occur. It would
also be necessary to create another organization of
the space related to the functional distribution of the
hospital, with which the units and services that work
in it are represented. Thus, spatial modeling can be
subdivided into three distributions: physical, logical
and functional, which can be seen in a UML domain
HEALTHINF 2021 - 14th International Conference on Health Informatics
742
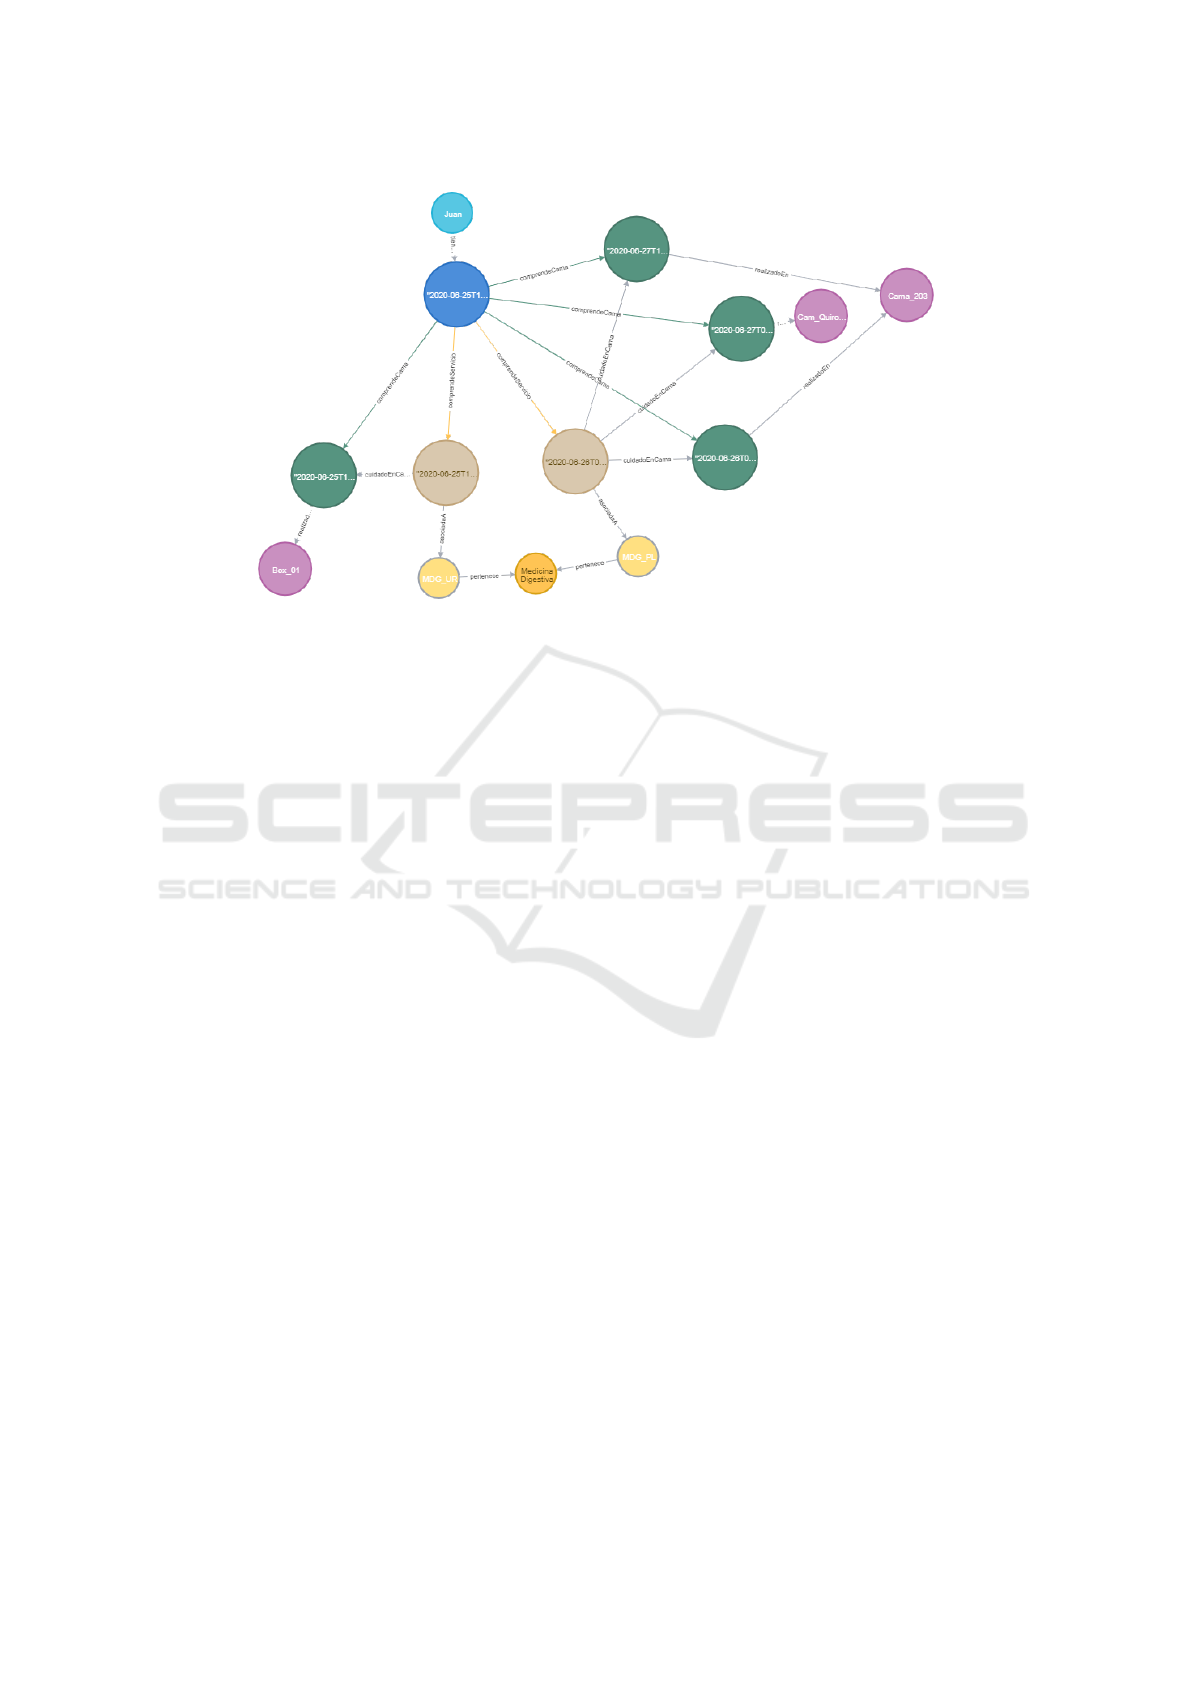
Figure 1: Graph for the case shown.
model in Figure 2.
For temporal modeling and clinical events, which
can be seen in Figure 3, we represent in a generic
way all the events of the patient’s medical history,
which have a temporal annotation. These events may
represent, for example, infections or diagnostic tests.
We distinguish events with duration in time (inter-
val) from those without duration (points). The patient
stays are special interval events since they are associ-
ated with a spatial location.
4 EPIDEMIOLOGY QUERIES
In order to advance from our previous work, we in-
clude two new queries of interest for epidemiologists:
• Query (Q1): Given a set of patients, determine
what events or locations they have had in common
during a time interval.
• Query (Q2): Given a set of patients, determine
what other patients have had in common over a
period of time.
4.1 Q1: Events or Locations in
Common for a Set of Patients
In this query, given a set of patients, we retrieve a sub-
graph formed by all the spatial elements or events that
they have had in common. This query is constrained
to a given period of time, that is considered a param-
eter of the query. The meaning of in common should
be as broad as possible, since the final objective is that
with the resulting graph to be able to analyze which
are the facts with the greatest coincidences between
the given patients, and thus be able to detect a possi-
ble source of infection. Starting from the set of pa-
tients given, it will be verified which admissions and
other events they have registered in the same location
(device, room, corridor, floor, etc.), in which units or
department they have been, or if some of these pa-
tients the same bacteria have been detected in a mi-
crobiology test. To design and solve this query, the
admissions, microbiology tests and other events have
to be considered. The steps followed in query Q1 are:
1. The given Patients nodes are retrieved and, from
these, we extract all the Events associated in the
given Interval period of time (a parameter) and
that are not of the Admission or MicroTest sub-
class.
2. For each pair of Events belonging to different Pa-
tients, it is checked whether both have been car-
ried out in Locations on the same Floor.
3. If they share the Location, the edges that connect
each Patient nodes with their Event nodes, and the
edges for the Locations in which both Events took
place, are returned as a result.
Figure 4 depicts part of the Cypher code for the
query Q1. In Figure 5 we show the resulting sub-
graph using as parameters idPatient: [1, 2, 3, 11, 22],
dateStart: ”2019-03-13T00:00:00”, dateEnd:”2019-
03-23T23:59:59”.
4.2 Q2: Contact Analysis
The query Q2 tries to establish the relation among a
set of patients. Given an initial set and all those pa-
Multi-resistant Bacterial Infection Surveillance using a Graph Database with Spatio-temporal Information
743
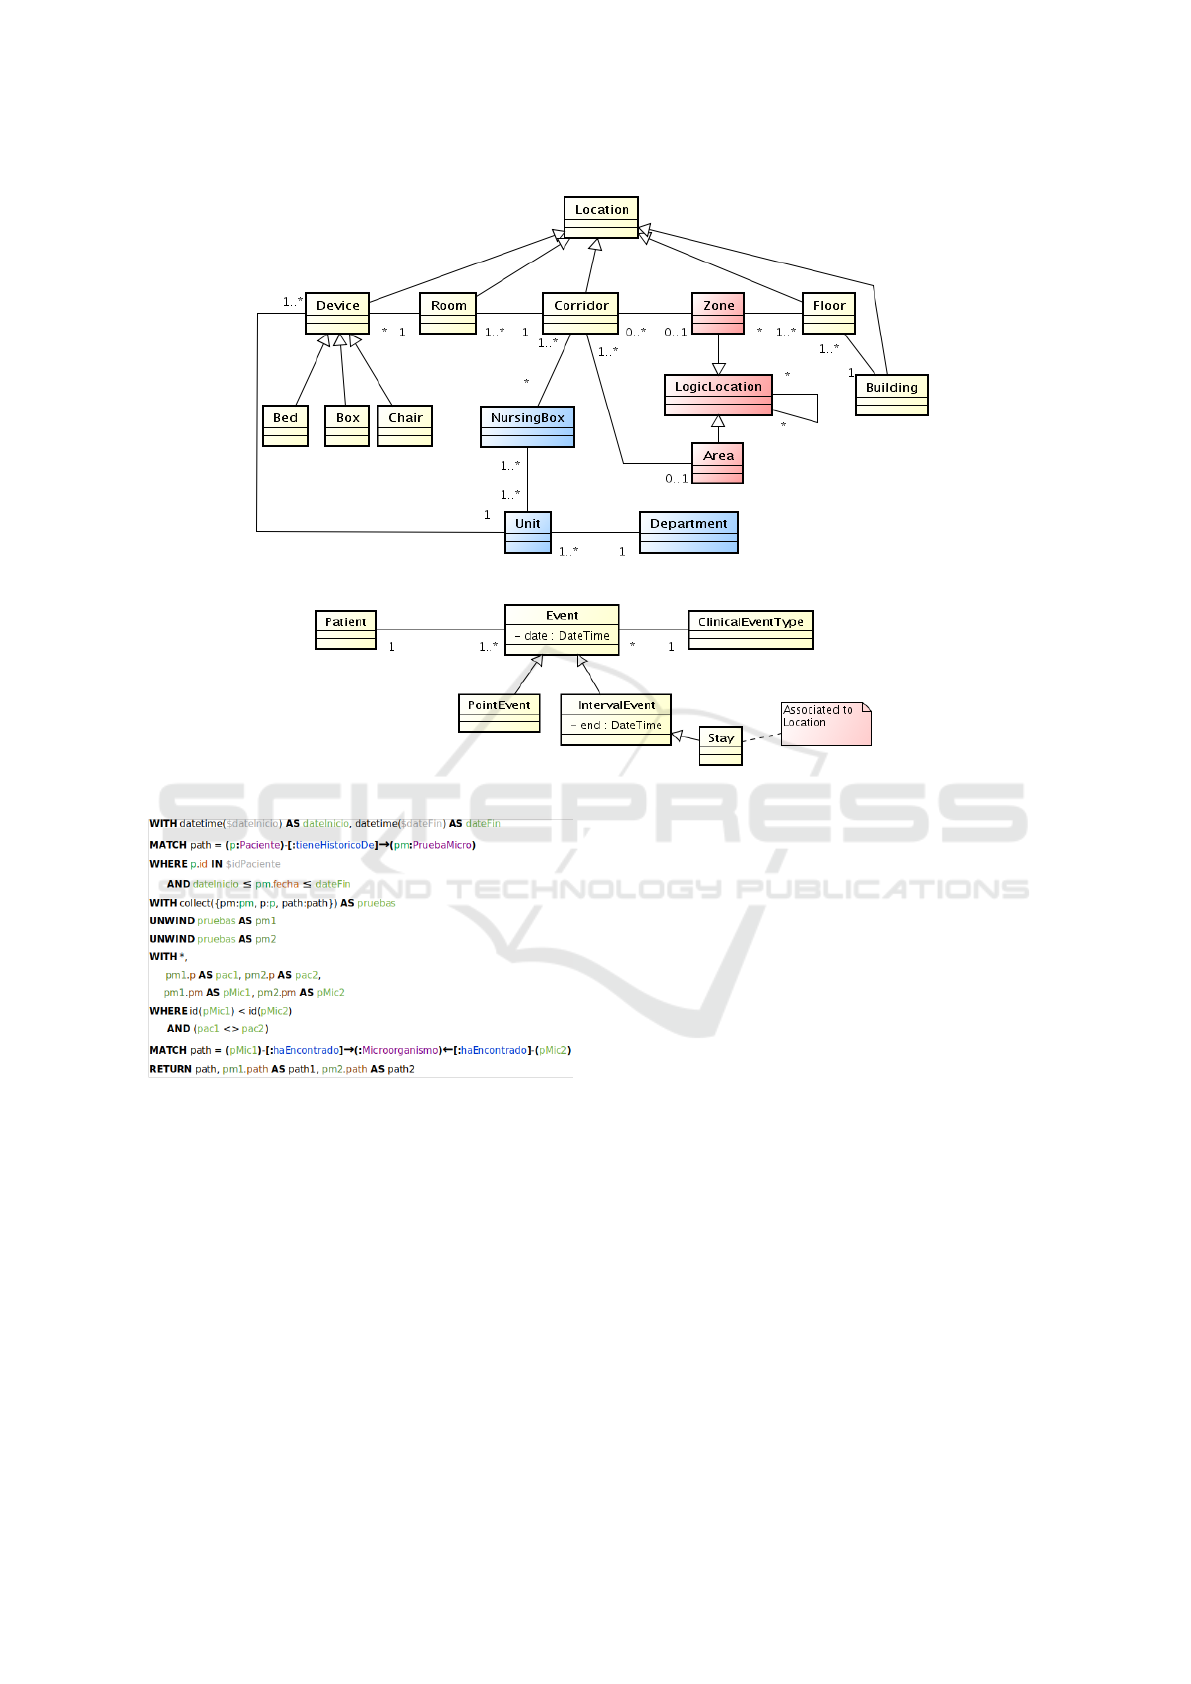
Figure 2: UML domain for spatial model: physical, logical and functional elements.
Figure 3: UML domain for temporal model: clinical events and temporal relations.
Figure 4: Code for the query Q1.
tients who within a given time interval have had a spa-
tial relationship with the former will be retrieved, re-
gardless of whether or not they have been diagnosed
with a bacterial infection. Instead of helping to find
the origin of the outbreak of a certain bacterial infec-
tion, the result is a a group of patients among whom
the probability of suffering the same infection is high
due to their proximity to others who already suffer
from it.
The following are the step for the resolution of the
query Q1:
1. Given a set of patients identifiers, their corre-
sponding Patient nodes are retrieved.
2. For each Patient, the Admissions and other Events
found in the given Interval of time are retrieved.
3. From these Admissions and other Events, the Lo-
cations (Devices or Rooms) in which they have
been carried out are retrieved.
4. For each Location, other Patients than those given
as an input parameter that have an Admission or
another type of Event that has been carried out in
the Device or Room located on the same Floor as
the given one.
5. The Patients identified in the step 4 will be the
outcome of the query.
Note in Figure 6 that query Q2 does not return a
complete subgraph, but a set of patients that should be
analyzed.
5 DICUSSION
Graph-oriented databases allow the storage of highly
connected data such as a patient’s medical history. In
the problem of surveillance of multidrug-resistant in-
fections, decision support for an epidemiologist can
be carried out with a 3-part modeling: clinical events,
spatial locations (physical, logical and functional),
HEALTHINF 2021 - 14th International Conference on Health Informatics
744

Figure 5: Subgraph retrieved for the query Q1.
Figure 6: Subgraph retrieved for the second query.
and temporal relationships between the above. We
have focused on the analysis of infections within a
hospital, not in the geography or with general popula-
tion, for which well-established models are known to
the scientific community.
Our preliminary evaluation of Neo4j for this pur-
pose has been positive and it presents advantages with
respect to OrientDB that we have presented in a pre-
vious work. It has been possible to develop all the
proposed queries, in a simpler and more readable way
than with OrientDB. Furthermore, the more flexible
and descriptive structure of the queries has allowed
us to be organized the in a way that makes their exe-
cution more efficient. There are facilities in function-
ality such as queries with grouping (OrientDB does
not have any grouping mechanism, neither explicit
nor implicit) or the passing of parameters. Cypher is
a much more powerful and expressive language than
OrientDB SQL. We consider its expressiveness one of
its main strengths, since a query can be implemented
in innumerable ways.
A further efficiency and scalability evaluation of
the queries with a simulated dataset or with a real
dataset is necessary. Other queries are also possible
(e.g. root case search or outbreak detection), but in
this preliminary work we have only shown two of the
needs of epidemiologists.
As points of discussion and future work after these
preliminary results, we propose the following:
- The modeling of graphs with properties and la-
bels is very flexible, but it would be necessary to ad-
vance in representing fuzzy relations or probabilities
that adapt to the problem of epidemiology. Can we
make the relationships more formal and introduce in-
tegrity constraints such as those provided by tempo-
ral and spatial logics or by spatio-temporal reasoning
methods in general? For example, what would happen
if only a percentage of patients met a contact criterion
in consultation Q1?
- The scalability of GOBs in information storage
and retrieval is known, but the resolution of some of
the issues in epidemiology requires a more complex
graph analysis that is not normally implemented in
these GOBs. For example, it should be noted that the
analysis of the resulting subgraph to obtain clusters
of nodes highly connected to each other does not fall
within the objectives of this work. Is it worth aban-
doning GOBs to go to a strictly graph solution where
it is easier to program algorithms? How easy is it to
implement algorithms in these databases?
- Graph visualization tools are necessary to help
the clinical expert make a decision. The graphs shown
in this preliminary work are useful to the data analyst,
but the clinician will have serious difficulties in query-
ing and interpreting the resulting graphs. What vi-
sualization functionalities are necessary to turn them
into a tool for your daily work in decision making?
Multi-resistant Bacterial Infection Surveillance using a Graph Database with Spatio-temporal Information
745

ACKNOWLEDGEMENTS
This work was partially funded by the SITSUS project
(Ref: RTI2018-094832-B-I00), given by the Span-
ish Ministry of Science, Innovation and Universi-
ties (MCIU), the Spanish Agency for Research (AEI)
and by the European Fund for Regional Development
(FEDER).
REFERENCES
Angles, R. and Gutierrez, C. (2008). Survey of graph
database models. ACM Comput. Surv., 40(1).
Chen, Y.-D., Chen, H., and King, C.-C. (2011). Social Net-
work Analysis for Contact Tracing, pages 339–358.
Springer US.
Chen, Y.-D., Tseng, C., King, C.-C., Wu, T.-S. J., and
Chen, H. (2007). Incorporating geographical con-
tacts into social network analysis for contact tracing
in epidemiology: A study on taiwan sars data. In
Zeng, D., Gotham, I., Komatsu, K., Lynch, C., Thur-
mond, M., Madigan, D., Lober, B., Kvach, J., and
Chen, H., editors, Intelligence and Security Informat-
ics: Biosurveillance, pages 23–36, Berlin, Heidel-
berg. Springer Berlin Heidelberg.
de Leon, S. P. (1991). The needs of developing countries.
Journal of Hospital Infection, (18):376–381.
Edwarson, S. and Cairns, C. (2019). Nosocomial infections
in the icu. Anaesthesia and intensive care medicine,
20(1):14–18.
Grande, K. M., Stanley, M., Redo, C., Wergin, A., Guil-
foyle, S., and Gasiorowicz, M. (2015). Social network
diagramming as an applied tool for public health:
Lessons learned from an hcv cluster. American jour-
nal of public health, 105(8):1611–1616.
Huang, Y., Ding, L., and Feng, Y. (2016). A novel epidemic
spreading model with decreasing infection rate based
on infection times. Physica A: Statistical Mechanics
and its Applications, 444:1041 – 1048.
Lose, T., van Heusden, P., and Christoffels, A. (2019).
Combat-tb-neodb: fostering tuberculosis research
through integrative analysis using graph database
technologies. Bioinformatics (Oxford, England).
M. Boman, A. Ghaffar, F. L. and Stenhem, M. (2006). So-
cial network visualization as a contact tracing tool. In
Proceedings of WS on Agent Technology for Disaster
Management, AAMAS’06, pages 131–133.
Pujante, L., Campos, M., Juarez, J. M., Canovas-Segura, B.,
and Morales, A. (2020). Graph databases for contact
analysis in infections using spatial temporal models.
In International Work-Conference on Bioinformatics
and Biomedical Engineering, pages 98–107.
World Health Organization (2003). Prevention of healthcare
associated infections: practice guide, 2nd ed.
Y. Kai, W. Lei, G. W. and Jun, H. (2018). A transmission-
limit inspired immunization strategy for weighted net-
work epidemiology. International Journal of Modern
Physics B, 32(23):1850251.
HEALTHINF 2021 - 14th International Conference on Health Informatics
746
