
Assessing Parkinson’s Disease Speech Signal Generalization of
Clustering Results across Three Countries: Findings in the
Parkinson’s Voice Initiative Study
Athanasios Tsanas
1a
and Siddharth Arora
2b
1
Usher Institute, Edinburgh Medical School, University of Edinburgh, U.K.
2
Department of Mathematics, University of Oxford, U.K.
Keywords: Acoustic Analysis, Clustering, Parkinson’s Disease, Parkinson’s Voice Initiative (PVI).
Abstract: Progress in exploring speech and Parkinson’s Disease (PD) has been hindered due to the use of different
protocols across research labs/countries, single-site studies with relatively small numbers, and no external
validation. We had recently reported on the Parkinson’s Voice Initiative (PVI), a large study where we
collected 19,000+ sustained vowel phonations (control and PD groups) across seven countries, under
acoustically non-controlled conditions. In this study, we explored how well findings generalize in the three
English-speaking PVI cohorts (data collected in Boston, Oxford, and Toronto). We acoustically characterized
each sustained vowel /a/ phonation using 307 dysphonia measures which had previously been successfully
employed in speech-PD applications. We used the previously identified feature subset from the Boston cohort
and explored hierarchical clustering with Ward’s linkage combined with 2D-data projections using t-
distributed stochastic neighbor embedding to facilitate visual exploration of PD subgroups. Furthermore, we
computed feature weights using LOGO to assess feature selection consistency towards differentiating PD
from controls. Overall, findings are very consistent across the three cohorts, strongly suggesting the presence
of four main PD clusters, and consistent identification of key contributing features. Collectively, these
findings support the generalization of sustained vowels and robustness of the presented methodology across
the English-speaking PVI cohorts.
1 INTRODUCTION
Parkinson’s Disease (PD) is a crippling progressive
neurodegenerative disorder straining national health
systems due to increasing prevalence rates (Dorsey et
al., 2013). Indicatively, there were approximately 2.5
million People diagnosed with PD (PwP) in 1990, and
6.1 million PwP compared in 2016 (GBD, 2018).
Characteristic PD symptoms include tremor, rigidity,
bradykinesia, and postural stability, within the
broader remit of motor, cognitive, and
neuropsychiatric symptoms (Olanow, Stern, Sethi
2009). Similarly to some other disorders where a
disease name is used as an umbrella term, PD is well
reported as a largely heterogeneous disease with
considerable heterogeneity in PwP’s symptom
severity trajectories (Fereshtehnejad et al., 2015).
a
https://orcid.org/0000-0002-0994-8100
b
https://orcid.org/0000-0001-6499-6941
Exploring PwP phenotypes is clinically important
since homogeneous groups exhibit stronger clinical
symptom manifestation and potentially stronger
genetic coherence. In practice, PwP may be assigned
to specific subgroups based on clinical observations
and criteria such as age onset and dominating
symptoms. More recently, data-driven clustering
approaches have been explored to delineate PwP
subtypes using different data modalities. Indicatively,
research work has focused on clinico-pathological
characteristics (Selikhova et al., 2009), standardized
clinical instruments to assess motor, non-motor, and
cognitive domains (Lawton, 2018; Zhang et al.,
2019), or sensor-based gait pattern analysis (Nguyen
et al. 2019). The use of different types of data to
assess symptoms may provide new insights towards a
more holistic understanding of PD, however, makes
comparisons across studies particularly challenging
124
Tsanas, A. and Arora, S.
Assessing Parkinson’s Disease Speech Signal Generalization of Clustering Results across Three Countries: Findings in the Parkinson’s Voice Initiative Study.
DOI: 10.5220/0010383001240131
In Proceedings of the 14th International Joint Conference on Biomedical Engineering Systems and Technologies (BIOSTEC 2021) - Volume 4: BIOSIGNALS, pages 124-131
ISBN: 978-989-758-490-9
Copyright
c
2021 by SCITEPRESS – Science and Technology Publications, Lda. All rights reserved

and may explain discrepancies in the reported PD
subtypes and the dreaded replicability crisis in
science.
Ever since the detailed description of PD
symptoms by James Parkinson’s seminal work in
1817, speech has been known to be strongly affected.
In fact, 29% of PwP consider it one of their most
debilitating symptoms (Hartelius and Svensson,
1994). Recent studies have demonstrated the
enormous potential of capitalizing on speech signals
in neurodegenerative applications and PD in
particular. For example, research work has explored:
(1) differentiating PwP from age- and gender-
matched controls with almost 99% accuracy (Tsanas
et al., 2012), (2) accurately replicating the Unified
Parkinson’s Disease Rating Scale (UPDRS) (Tsanas
et al., 2011; Tsanas et al., in press), which is the
standard clinical tool to provide an overall PD
symptom assessment, and (3) automatically assessing
voice rehabilitation (Tsanas et al., 2014a). More
recently we have reported on the potential of speech
signals towards distinguishing people with Leucine-
Rich Repeat Kinase 2 (LRRK2) associated PD,
idiopathic PD, and control participants (Arora et al.,
2018). Similarly, speech articulation kinematic
models to characterize PD dysarthria have been
developed, which provide tentative insights into the
underlying physiology (Gomez et al., 2019).
Most studies in speech-PD report on single-site
findings, and are often limited in terms of the
statistical power due to the limited number of
available recordings, or the requirement of relying on
highly specific equipment and/or highly controlled
acoustic conditions. Motivated by the promising
findings we and others have reported in this field, we
set up a large multi-site trial and recently reported on
the Parkinson’s Voice Initiative (PVI) (Arora,
Baghai-Ravary, Tsanas, 2019). The PVI is a unique,
first of its kind, study where people were self-selected
and enrolled to participate, donating their voices
collected under acoustically uncontrolled conditions
over the phone. Overall, we have collected more than
19,000 sustained vowel /a/ samples from people
across seven countries. Although the data collected in
this study is clearly not of the same high quality as
data collected under carefully controlled acoustic
conditions, the large number of samples facilitates
new explorations in different directions.
The application of clustering algorithms using
speech signals has barely been explored. Rueda and
Krishnan (2018) used sustained vowel /a/ recordings
from 57 PwP and 57 matched controls to determine
groupings. However, the very small sample size
limits exploration and besides, mixing PwP with
controls is fundamentally not addressing the aim of
computing PD subtypes. Thus, to the best of our
knowledge we were the first to recently propose
clustering using sustained vowels to explore PwP
groupings (Tsanas and Arora, 2020). We had
previously used only the largest cohort (out of seven
cohorts) in the PVI to explore whether it is possible
to find some meaningful way to cluster PwP. The next
logical step is to validate how well those findings
generalize across other cohorts, which would
implicitly serve to assess the generalization of the
PVI project.
Therefore, the aim of this study is to explore how
well findings generalize across the three English-
speaking cohorts in PVI towards: (1) the computed
PwP clusters and (2) consistency of feature set
towards differentiating PwP from controls. The end
goal is to investigate whether the collected sustained
vowel /a/ phonations and proposed methodology has
internal consistency across different PVI datasets.
2 DATA
The PVI study invited people to self-enrol and
contribute their voices to facilitate clinical research in
PD. Data were collected across seven major
geographical locations (Argentina, Brazil, Canada,
Mexico, Spain, USA, and the UK) using servers by
Aculab for the needs of this project. People called a
dedicated phone number that was closest to their
geographical location and were requested to provide
some basic demographic information (age, gender),
self-report whether they had been clinically
diagnosed with PD, and record two sustained vowel
/a/ phonations. The instruction was to sustain vowel
/a/ for as long and as steadily as possible, following
standard widely used protocols which are easy to
implement (Titze, 2000). The speech recordings were
sampled at 8 kHz. In total, we collected more than
19,000 samples.
In this study we processed data from the three
English-speaking sites: Boston, Oxford, Toronto,
since we wanted to assess how well findings
generalize. Demographic information for the study
participants is summarized in Table 1; we do not have
detailed information regarding PD-symptom specific
aspects, for example whether participants self-
enrolled when they were “on” or “off” medication, or
clinically validated metrics such as UPDRS. For
further details on PVI we refer readers to our previous
work (Arora, Baghai-Ravary, Tsanas, 2019; Tsanas
and Arora, 2019).
Assessing Parkinson’s Disease Speech Signal Generalization of Clustering Results across Three Countries: Findings in the Parkinson’s
Voice Initiative Study
125

Table 1: Summary of demographics per cohort.
Boston Oxford Toronto
Participants
12171
(PD: 1138)
2103
(PD 285)
792
(PD: 107)
Phonations
12171
(PD:2097)
3908
(PD:536)
1461
(PD: 198)
A
g
e
63.7±10.8 63.5±10.0 65.0±9.8
Gender (males)
605 172 62
Distributions are summarized in the form mean ± standard
deviation. The basic demographic information is provided for the
PD participants since that is the main focus of the study.
3 METHODS
3.1 Data Pre-processing
We developed a speech recognition software which
automatically transcribed the participants’ responses
over the phone regarding age, gender, and self-
reported PD assessment. We aurally inspected
recordings where the automated speech recognition
algorithm had less than 90% confidence.
Furthermore, we developed an automated tool to
screen out unusable recordings, for example in the
presence of excessive background noise. For further
details please see (Arora, Baghai-Ravary, Tsanas,
2019).
3.2 Acoustic Characterization of
Sustained Vowel /a/ Phonations
We used the Voice Analysis Toolbox (freely
available from https://www.darth-group.com/
software) to acoustically characterize each sustained
vowel /a/ phonation. The toolbox computes 307
dysphonia measures, which have been developed
specifically to characterize sustained vowel /a/
phonations extensively validated across diverse PD
datasets (Tsanas et al., 2010a; Tsanas et al., 2010b;
Tsanas et al., 2011; Tsanas et al., 2012; Tsanas, 2012;
Tsanas et al., 2014a; Arora, Baghai-Ravary, Tsanas,
2019; Tsanas et al., in press), and other applications,
e.g. processing voice fillers (Tsanas and Gomez-
Vilda, 2013; San Segundo, Tsanas, Gomez-Vilda,
2017). We have described in detail previously the
background, rationale, and detailed algorithmic
expressions for the computation of the dysphonia
measures (Tsanas, 2012; Tsanas, 2013). A
prerequisite for the computation of many dysphonia
measures is the fundamental frequency (F0)
estimation. There are many algorithms in the research
literature for F0 estimation in different applications
(Tsanas et al., 2014b); here, we used the SWIPE
algorithm (Camacho and Harris, 2008), which we had
previously demonstrated is the most accurate F0
estimation algorithm in sustained vowel /a/
phonations (Tsanas et al., 2014b).
Applying the dysphonia measures to each
recording gives rise to features which are continuous
random variables. We linearly scaled each feature to
be in the range [0, 1] following standard practice for
distance-based machine learning algorithms so that
no feature dominates others (Bishop, 2006).
3.3 Feature Selection
A high dimensional dataset may obscure deciphering
of its core data structure and is typically challenging
for statistical learning algorithms. This well-known
problem is often referred to as the curse of
dimensionality, and may lead to detrimental
generalization of statistical learning algorithms
(Guyon et al. 2006; Hastie, Tibshirani, Friedman,
2009). Following Occam’s razor, we would prefer a
predictive model which is as simple as possible, i.e.
with a low dimensionality. This approach is known as
dimensionality reduction, and can be achieved either
by feature transformation (transforming the features
to populate a new, lower dimensional space), or by
feature selection (choosing a subset of features).
Feature selection is often more suitable in clinical
settings to retain the interpretability of the original
features (Guyon et al., 2006; Tsanas, Little,
McSharry, 2013).
There are two approaches in feature selection:
supervised (where the outcome information is used),
and unsupervised (where we do not have the
outcomes, or may not want to use that information).
Feature selection in unsupervised learning setups is
less studied and practically more challenging in terms
of defining a loss function (or criterion) to optimize
(Dy and Brodley, 2004). In this study we used both
unsupervised feature selection and supervised feature
selection to tackle the two different tasks.
For unsupervised feature selection, we used the i-
Detect to select informative features where the
identified feature subspace has the following
property: the difference between the total volume of
the space spanned by the selected feature subset and
the sum of the volumes of clusters in the embedded
manifolds is maximized (Yao et al., 2015). The i-
Detect algorithm has two free hyper-parameters: the
kernel width and the regularization parameter. The
algorithm is not very sensitive to the choice of the
kernel width (Yao et al. 2015), and hence we
experimentally explored the effect of optimizing the
regularization parameter. The output of i-Detect is a
BIOSIGNALS 2021 - 14th International Conference on Bio-inspired Systems and Signal Processing
126

sparse feature weight vector. The final ranking is
determined by the descending order of the weights.
For supervised feature selection, we used LOGO
(Sun et al., 2010), a feature weighting algorithm
which implicitly also provides an estimate of the
“importance” of each feature. Then, we determined a
minimal threshold and selected features in
descending order on the basis of decreasing feature
weights.
3.4 Clustering
Clustering is an unsupervised learning approach,
which attempts to group samples using the underlying
concept of sample distances. It can often provide
insight into the underlying structure of the data via the
(probabilistic) cluster membership of each sample
into the automatically determined clusters. Given
there are no labels (objective ground truth), clustering
is inherently more difficult to assess compared to
statistical learning models in supervised learning
setups.
Here, we used hierarchical clustering which is a
popular cluster analysis method that has been
successfully used across different applications
(Hastie, Tibshirani, Friedman, 2009). Hierarchical
clustering has a major advantage over some of the key
competing clustering approaches that it does not
require pre-specifying the number of clusters in the
data. Instead, it inherently constructs a dendrogram to
represent the data in a tree-based form, where the tree
is recursively split to form new clusters, aiming to
maximize the between group dissimilarity. For
further background details on hierarchical clustering
please see Duda, Hart, and Stork (2004) or Hastie,
Tibshirani and Friedman (2009) which are standard
reference works.
We used hierarchical clustering with Ward’s
linkage to cluster the lower-dimensional
representation obtained following unsupervised
feature selection with iDetect. For further details and
experiments with the full dataset and the lower
dimensional dataset we refer to Tsanas and Arora
(2020). The number of clusters was determined
following visual inspection of the dendrogam as
described in the methodology by Sheaves et al.
(2016).
We used the iDetect algorithm and the
methodology we previously described (Tsanas and
Arora, 2020) to reproduce our findings and use the
same feature subset (21 features, primarily from the
wavelet dysphonia measures) across the three
cohorts. We applied hierarchical clustering
independently for each cohort, using the same feature
subset that has been obtained using iDetect on the
Boston dataset (Tsanas and Arora, 2020). In all cases,
we visualized the dendrograms to visualize the
underlying data structure.
3.5 Data Visualization
We applied the t-distributed Stochastic Neighbor
Embedding (t-SNE) algorithm (van der Maaten and
Hinton, 2008) to obtain a 2D data representation and
visualize the data structure embedded in the high-
dimensional space. We used the 21 features we had
previously identified (Tsanas and Arora, 2020) to
project the 21-dimensional space into 2D. The
resulting representation may provide new insights in
terms of participant assignment in those plots and has
been used to visually annotate the points using the
cluster analysis results.
4 RESULTS
This section is split into two subsections to report on
the generalization of the cluster findings across the
three cohorts, and then to also report on the
generalization of feature selection towards binary
differentiation of PwP and controls.
4.1 Exploring Cluster Generalization
across the Three Cohorts
We applied hierarhical clustering to deterministically
assign cluster membership for each sample.
Subsequently, we applied t-SNE to obtain the 2D data
projection of the feature space spanned by the
selected feature subset, independently for each of the
three cohorts (see Figure 1). We found that across all
three cohorts hierarchical clustering leads to groups
which almost completely agree with the data
projections in 2D space in terms of almost distinct
cluster separation as can be visually affirmed by
Figure 1. This is particularly revealing given that the
data projection and clustering algorithms operate
independently, and these plots serve to intuitively
validate the cluster groupings. We defer further
elaboration for the Discussion.
Assessing Parkinson’s Disease Speech Signal Generalization of Clustering Results across Three Countries: Findings in the Parkinson’s
Voice Initiative Study
127
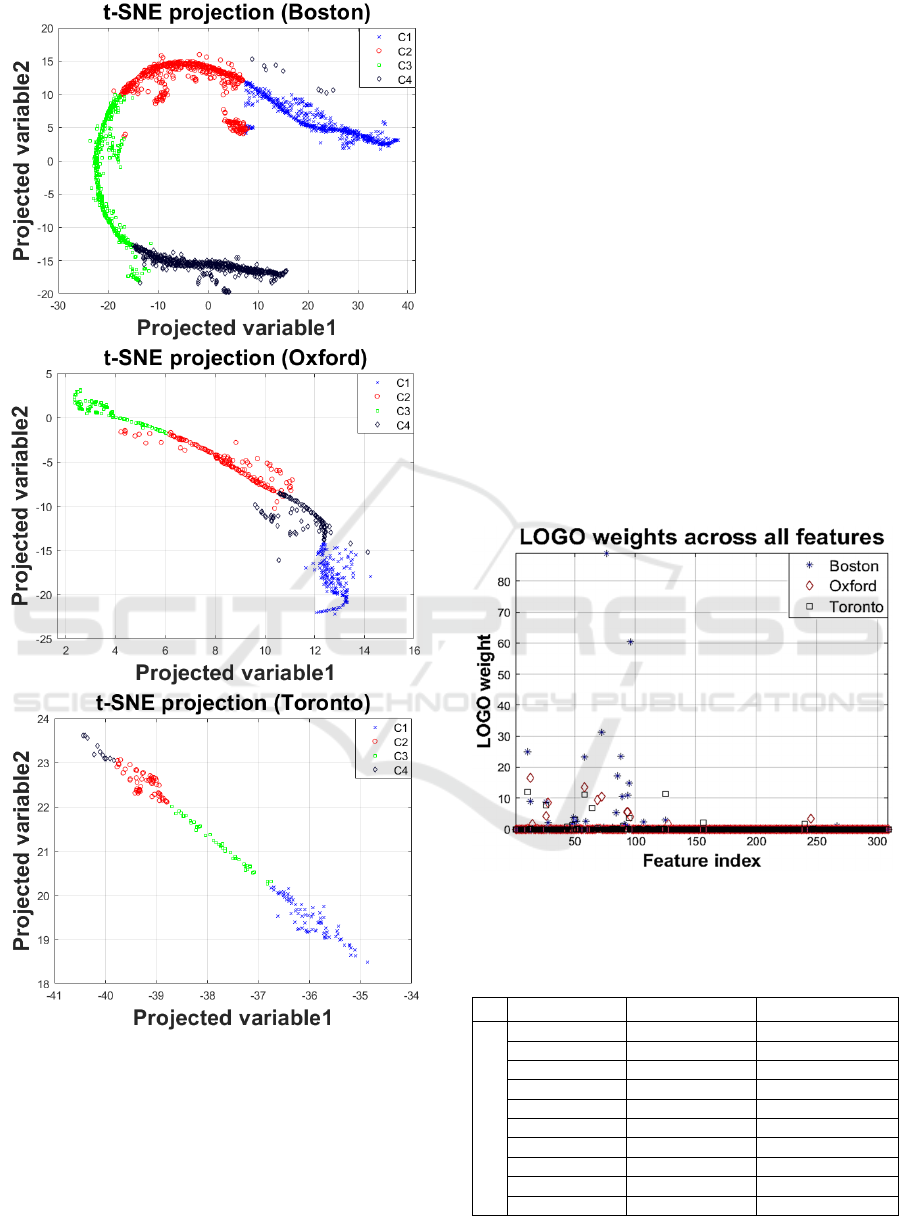
Figure 1: Two-dimensional representation of the datasets
with selected features using t-SNE and marking of the four
clusters (denoted C1…C4) computed using hierarchical
clustering with the selected feature subset from Tsanas and
Arora (2020).
4.2 Assessing Generalization of Selected
Features for Binary Differentiation
So far we have used data only from the PD
participants in each of the three cohorts, aiming to
derive clusters and assess cluster consistency. As a
final exploratory step, we wanted to apply a
supervised feature weighting algorithm to determine
whether there is also consistency in the key
contributing features to differentiate PwP from
controls across the three cohorts.
We present the results of the LOGO weights in
Fig. 2 for all three cohorts to faciliate visual
comparison. We remark that the actual weights in
LOGO are affected by the number of samples in the
dataset. The primary observation, however, is that
there is again good consistency on the top selected
features across the three datasets. We summarize the
selected features in descending order for each of the
three datasets in Table 2. There is overall agreement
across the datasets on the key contributing features,
and the algorithmic families those features represent.
Figure 2: Feature weights computed using LOGO for each
of the three cohorts in the study.
Table 2: Summary of LOGO-selected features in
descending order for each of the three cohorts.
Boston Oxfor
d
Toronto
Feature name
VFER
N
SR
,
SEO
Jitte
r
F0-TKEO
,
p
rc95
Jitte
r
F0-TKEO
,
p
rc95
12
th
MFCC OQ
std
,
closed
F0 - F0
ex
p
VFER
LF
,
TKEO
VFER
LF
,
TKEO
OQ
std
,
closed
Jitte
r
F0-TKEO
,p
rc25
VFER
std
Jitte
r
p
itch-TKEO
,p
rc25
4
th
MFCC Jitte
r
F0-TKEO
,p
rc95
GNE
SNR
,
TKEO
OQ
std
,
closed
10
th
MFCC 11
th
MFCC
1
st
MFCC 9
th
MFCC Shimme
r
TKEO
,p
rc95
11
th
MFCC Jitte
r
p
itch-TKEO
,p
rc25
8
th
det LT entropy
10
th
MFCC 12
th
MFCC 1
st
det LT entropy
5
th
MFCC 6
th
det LT entropy Shimme
r
TKEO
,p
rc25
For brevity we only present the top-10 selected features using
LOGO.
BIOSIGNALS 2021 - 14th International Conference on Bio-inspired Systems and Signal Processing
128

5 DISCUSSION
We extended our previous work to assess the
generalization of findings across the three English-
speaking cohorts in PVI. We demonstrated that the
methodology we had previously developed in the
Boston cohort for cluster membership assignment
using the exact parameters we had previously
reported (Tsanas and Arora, 2020), generalizes very
well for the Oxford and Toronto cohorts in PVI.
There is strong internal consistency in identifying
four PwP clusters, which are almost clearly separable
as indicated in Fig. 1 when projecting data into a 2D
transformed feature space. Moreover, we identified
similar features that jointly contribute the
differentiation of PwP and controls (Fig. 2 and Table
2) which further supports the generalizability of those
findings, at least for the English-speaking cohorts.
Similarly to other clinical conditions, there are
important implications and translational potential for
cluster findings. For this particular setting, we
envisage a newly diagnosed PwP could be
phenotyped using sustained vowels to be assigned in
a PD cluster, which could provide information about
symptom trajectory or optimal treatment to follow on
the basis of similarity to other PwP within the same
cluster. It is often possible to provide a tentative
interpretation of clusters using additional
information, e.g. regarding PD symptom trajectory or
targeted symptoms/therapies.
We remark that our findings are strongly
supporting previous studies on PwP subtyping, which
had similarly reported the identification of four
clusters. Indicatively, Lewis et al. (2005), collected
demographic, motor, mood, and cognitive measures
from 120 early-stage PwP and applied standard k-
means resulting into four clusters: (1) younger PD
onset; (2) tremor-dominant; (3) non-tremor dominant
with considerable cognitive impairment and mild
depression; and (4) rapid disease progression but no
cognitive impairment. Similarly, Lawton et al. (2018)
used standardized questionnaires to assess motor,
non-motor, and cognitive domains on two PD cohorts
(1601 and 944 participants). They reported four main
subgroups: (1) fast motor progression with
symmetrical motor disease, poor olfaction, cognition
and postural hypotension; (2) mild motor and non-
motor disease with intermediate motor progression;
(3) severe motor disease, poor psychological well-
being and poor sleep with an intermediate motor
progression; (4) slow motor progression with tremor-
dominant, unilateral disease. van Rooden et al. (2011)
similarly reported four subgroups: (1) mildly affected
in all domains, (2) predominantly severe motor
complications, (3) affected mainly on
nondopaminergic domains with no major motor
complications, (4) severely affected across all
domains. Mu et al. (2017) assessed motor and non-
motor symtoms in two cohorts (411 and 540
participants), and also reported four clusters: (1) mild,
(2) non-motor dominant, (3) motor-dominant, and (4)
severe. We stress that these studies had used different
data modalities, which further serves to underline the
important validity of speech towards providing
holistic information about motor and other PD
symptoms (Tsanas, 2012).
The findings in Fig. 1 make a very compelling
case regarding cluster validation: using
independently cluster analysis and 2D data projection
we find that the computed clusters can be visually
verified. However, it is not directly obvious how well
the four clusters reported herein computed using
acoustic features extracted from sustained vowels
match with the underlying PD symptoms and clusters
of the preceding studies (Lewis et al. 2005; van
Rooden et al., 2011; Lawton et al., 2018).
Unfortunately, in the PVI study we had not collected
additional symptom based entries in the form of
patient reported outcome measures or clinical
assesssments. On the other hand, studies which have
longitudinal clinical evaluations and patient reported
outcome measures do not have speech signal
recordings which would enable to explore bridging
this gap. Applying a range of signal processing and
data analytics tools across different modalities, with
the ultimate aim of fusing information can provide a
more holistic translational path for clinical research
(Gorriz et al., 2020; Woodward et al., 2020).
We emphasize that many clustering studies
focusing on clinical data in general and in PD
research in particular, rely on tools which make rigid
assumptions such as k-means (e.g. Lewis et al., 2005;
Lawton et al., 2018). This technique, although simple
to apply has some fundamental drawbacks (Hastie,
Tibshirani, Friedman, 2009; Duda, Hart, Stork,
2001). Further challenges in cluster analysis include
selecting a robust feature subset which could better
reveal the underlying groups without having any
labels available (Dy and Brodley, 2004),
standardizing variables or introducting weights for
different variables, and validating findings. In
practice, many of these crucial implementation details
in the application of cluster analysis methodology in
often omitted. For an overview of this field,
Assessing Parkinson’s Disease Speech Signal Generalization of Clustering Results across Three Countries: Findings in the Parkinson’s
Voice Initiative Study
129

challenges, and suggestions for best practice when
reporting clustering results we refer to Horne et al.
(2020).
We envisage these robust cluster findings which
appear to generalize very well may contribute
towards improving understanding of the nature of PD
subtypes and hence potentially be translated to inform
therapeutic interventions in clinical practice
(Triantafyllidis and Tsanas, 2019). We are further
exploring the PVI data to investigate differences
across the English-speaking and other cohorts, both
towards understanding differences versus controls
and also internal variability which may inform future
clinical trials.
ACKNOWLEDGEMENTS
We are grateful to Max Little who led the Parkinson’s
Voice Initiative where the data for this study was
collected, and to Ladan Baghai-Ravary for
developing the data collection process using the
Aculab servers. We would like to extend our thanks
to all participants in the PVI study. The study was
made possible through generous funding via an
EPSRC-NCSML award to AT and SA.
REFERENCES
Arora, S. Visanji, N.P., Mestre, T.A., Tsanas, A., Al
Dakheel, A., Connolly, B.S., Gasca-Salas, C., Kern,
D.S., Jain, J., Slow, E.J., Faust-Socher, A., Lang, A.E.
Little, M.A., Marras C. 2018. Investigating voice as a
biomarker for leucine-rich repeat kinase 2-associated
Parkinson’s disease: a pilot study, Journal of
Parkinson’s Disease, Vol. 8(4), pp. 503-510
Arora, S., Baghai-Ravary, L., Tsanas A. 2019. Developing
a large scale population screening tool for the
assessment of Parkinson’s disease using telephone-
quality speech, Journal of Acoustical Society of
America, Vol. 145(5), 2871-2884
Bishop, C.M. 2006. Pattern recognition and machine
learning, Springer
Camacho, A., Harris, J.G. 2008. A sawtooth waveform
inspired pitch estimator for speech and music, Journal
of the Acoustical Society of America, Vol. 124, 1638-
1652
Dorsey, E.R., George, B.P., Leff, B., Willis A.W. 2013. The
coming crisis: obtaining care for the growing burden
of neurodegenerative conditions, Neurology, Vol. 80,
1989-1996
Duda, R.O., Hart, P.E., Stork, D.G. 2001. Pattern
classification, Wiley-interscience, 2nd ed.
Dy, J.G., Brodley, C.E. 2004. Feature selection for
unsupervised learning, Journal of Machine Learning
Research, Vol. 5, 845-889
Fereshtehnejad, S.-M. et al. 2015. New clinical subtypes of
parkinson disease and their longitudinal progression: a
prospective cohort comparison with other
phenotypes. JAMA Neurology, Vol. 72, pp. 863–873
GBD 2016 Parkinson's Disease Collaborators 2018. Global,
regional, and national burden of Parkinson’s disease,
1990–2016: a systematic analysis for the Global Burden
of Disease Study 2016. The Lancet Neurology, Vol. 17,
pp. 939-953
Gomez-Vilda, P., Mykyska, J., Gomez, A., Palacios, D.,
Rodellar, V., Alvarez A. 2019. Characterization of
Parkinson’s disease dysarthria in terms of speech
articulation kinematics, Biomedical Signal Processing
and Control, Vol. 52, 312-320
Gorriz, J.M., Ramirez, J., Ortiz, A., et al. (2020). Artificial
intelligence within the interplay between natural and
artificial computation: advances in data science, trends
and applications, Neurocomputing, Vol. 410, pp. 237-
270
Guyon, I., Gunn, S., Nikravesh, M., Zadeh, L.A. (Eds.)
2006. Feature Extraction: Foundations and
Applications, Springer
Hartelius L., Svensson P. 1994. Speech and swallowing
symptoms associated with parkinson‘s disease and
multiple sclerosis: A survey, Folia Phoniatr. Logop.,
Vol. 46, pp. 9- 17
Hastie, T. Tibshirani, R. Friedman J. 2009. The elements of
statistical learning: data mining, inference, and
prediction, Springer, 2nd ed.
Horne, E., Tibble, H. Sheikh, A., Tsanas A. 2020.
Challenges of clustering multimodal clinical data: a
review of applications in asthma subtyping, JMIR
Medical Informatics, Vol. 8(5), e16452
Lawton, M., Ben-Shlomo, Y., May, M.T., et al. 2018.
Developing and validating Parkinson’s disease
subtypes and their motor and cognitive progression,
Journal of Neurology, Neurosurgery and Psychiatry,
Vol. 89, pp. 1279-1287
Lewis, S.J.G., Foltynie, T., Blackwell, A.D., Robbins,
T.W., Owen, A.m., Barker R.A. 2005. Heterogeneity
of Parkinson’s disease in the early clinical stages using
a data driven approach, Journal of Neurology,
Neurosurgery and Psychiatry, Vol. 76, 343-348
Mu, J., Chaudhuri, K.R., Bielza, C., de Pedro-Cuesta, J.,
Larranaga, P., Martinez-Martin, P. 2017. Parkinson’s
disease subtypes identified from cluster analysis of
motor and non-motor symptoms, Frontiers in Aging
Neuroscience, 9:301
Nguyen, A., Roth, N., Ghassemi, N.H., Hannink, J., Seel,
T., Klucken, J., Gassner, H., Eskofier, B.M. 2019.
Development and clinical validation of inertial sensor-
based gait-clustering methods in Parkinson’s disease,
Journal of NeuroEngineering and Rehabilitation,
16:77
Olanow, C.W., Stern, M.B., Sethi,K. 2009. The scientific
and clinical basis forthe treatment of Parkinson
disease, Neurology, Vol. 72 (21 Suppl 4) s1-s136
Rueda, A., Krishnan, S., 2018. Clustering Parkinson’s and
age-related voice impairment signal features for
unsupervised learning, Advances in Data Science and
Adaptive Analysis, Vol. 10(2);1840007
San Segundo, E., Tsanas, A., Gomez-Vilda, P., 2017.
Euclidean distances as measures of speaker similarity
including identical twin pairs: a forensic investigation
BIOSIGNALS 2021 - 14th International Conference on Bio-inspired Systems and Signal Processing
130

using source and filter voice characteristics, Forensic
Science International, Vol. 270, pp.25-38
Selikhova, M., Williams, D.R., Kempster, P.A., Holton,
J.L., Revesz, T., Lees, A.J. 2009. A clinic-pathological
study of subtypes in Parkinson’s disease, Brain, Vol.
132, pp. 2947-2957
Sheaves, B., Porcheret, K., Tsanas, A., Espie, C., Foster, R.,
Freeman, D., Harrison, P.J., Wulff, K., Goodwin,
G.M. 2016. Insomnia, nightmares, and chronotype as
markers of risk for severe mental illness: results from
a student population, Sleep, Vol. 39(1), pp. 173-181
Sun, Y., Todorovic, S., Goodison, S. 2010. Local-learning-
based feature selection for high-dimensional data
analysis, IEEE Transactions on Pattern Analysis and
Machine Intelligence, Vol. 32(9), pp. 1610-1626
Titze, I.R. 2000. Principles of Voice Production. National
Center for Voice and Speech, Iowa City, US, 2nd
printing
Triantafyllidis, A.K., Tsanas A. 2019. Applications of
machine learning in real-life digital health
interventions: review of the literature, Journal of
Medical Internet Research (JMIR), Vol. 21(4), e12286
Tsanas, A., Little, M.A., McSharry, P.E., Ramig, L.O.
2010a. New nonlinear markers and insights into
speech signal degradation for effective tracking of
Parkinson’s disease symptom severity, International
Symposium on Nonlinear Theory and its
Applications (NOLTA), pp. 457-460, Krakow,
Poland, 5-8 September
Tsanas, A., Little, M.A., McSharry, P.E., Ramig, L.O.
2010b. Enhanced classical dysphonia measures and
sparse regression for telemonitoring of Parkinson's
disease progression, IEEE Signal Processing Society,
International Conference on Acoustics, Speech and
Signal Processing (ICASSP), pp. 594-597, Dallas,
Texas, US, 14-19 March 2010
Tsanas, A., Little, M.A., McSharry, P.E., Ramig, L.O.
2011. Nonlinear speech analysis algorithms mapped to
a standard metric achieve clinically useful
quantification of average Parkinson’s disease
symptom severity, Journal of the Royal Society
Interface, Vol. 8, pp. 842-855
Tsanas, A., Little, M.A., McSharry, P.E., Spielman, J.,
Ramig, L.O. 2012. Novel speech signal processing
algorithms for high-accuracy classification of
Parkinson’s disease, IEEE Transactions on
Biomedical Engineering, Vol. 59, 1264-1271
Tsanas A. 2012. Accurate telemonitoring of Parkinson’s
disease symptom severity using nonlinear speech
signal processing and statistical machine learning,
Ph.D. thesis, Oxford Centre for Industrial and Applied
Mathematics, University of Oxford
Tsanas A. 2013. Acoustic analysis toolkit for biomedical
speech signal processing: concepts and algorithms, 8th
International Workshop on Models and Analysis of
Vocal Emissions for Biomedical Applications
(MAVEBA), pp. 37-40, Florence, Italy, 16-18
December
Tsanas, A., Gómez-Vilda P., 2013. Novel robust decision
support tool assisting early diagnosis of pathological
voices using acoustic analysis of sustained vowels,
Multidisciplinary Conference of Users of Voice,
Speech and Singing (JVHC 13), pp. 3-12, Las Palmas
de Gran Canaria, 27-28 June
Tsanas, A. Little, M.A., McSharry P.E. 2013. A
methodology for the analysis of medical data, in
Handbook of Systems and Complexity in Health, Eds.
J.P. Sturmberg, and C.M. Martin, Springer, pp. 113-
125 (chapter 7)
Tsanas, A., Little, M.A., Fox, C., Ramig L.O. 2014a.
Objective automatic assessment of rehabilitative
speech treatment in Parkinson’s disease, IEEE
Transactions on Neural Systems and Rehabilitation
Engineering, Vol. 22, 181-190
Tsanas, A., Zañartu, M., Little, M.A., Fox, C., Ramig, L.O.,
Clifford, G.D. 2014b. Robust fundamental frequency
estimation in sustained vowels: detailed algorithmic
comparisons and information fusion with adaptive
Kalman filtering, Journal of the Acoustical Society of
America, Vol. 135, 2885-2901
Tsanas A. 2019. New insights into Parkinson’s disease
through statistical analysis of standard clinical scales
quantifying symptom severity, 41st IEEE Engineering
in Medicine in Biology Conference (EMBC), Berlin,
Germany, 23-27 July
Tsanas, A., Arora S. 2019. Biomedical speech signal
insights from a large scale cohort across seven
countries: the Parkinson’s voice initiative study,
Models and Analysis of Vocal Emissions for
Biomedical Applications, Florence, Italy, 17-19
December 2019
Tsanas, A., Arora S. 2020. Large-scale clustering of people
diagnosed with Parkinson’s disease using acoustic
analysis of sustained vowels: findings in the
Parkinson’s voice initiative study, 13th International
Joint Conference on Biomedical Systems and
Technology (BIOSTEC), pp. 369-376, Malta, 26-28
February 2020
Tsanas, A., Little, M.A., Ramig L.O. Remote assessment of
Parkinson’s disease symptom severity using the
simulated cellular mobile telephone network, IEEE
Access (in press)
Woodward, K. Kanjo, E., Brown, D., et al. (2020). Beyond
mobile apps: a survey of technologies for mental well-
being, IEEE Transactions Affective Computing, (in
press)
van der Maaten, L.J.P., Hinton, G.E. 2008. Visualizing
high-dimensional data using t-SNE, Journal of
Machine Learning Research , Vol. 9, pp. 2579-2605
van Rooden S.M., Colas F., Martínez-Martín P., Visser M.,
Verbaan D., Marinus J., Chaudhuri R.K., Kok J.N.,
van Hilten J.J. 2011. Movement Disorders, Vol. 26(1),
pp.51-58
Yao, J., Mao, Q., Goodison, S., Mai, V., Sun, Y. 2015.
Feature selection for unsupervised learning through
local learning. Pattern Recognition Letters, Vol. 53,
pp. 100–107
Zhang, X., Chou, J., Liang, J., Xiao, C., Zhao, Y., Sarva,
H., Henchcliffe, C., Wang, F. 2019. Data-driven
subtyping of Parkinson’s disease using longitudinal
clinical records: a cohort study, Scientific Reports,
Vol. 9;797
Assessing Parkinson’s Disease Speech Signal Generalization of Clustering Results across Three Countries: Findings in the Parkinson’s
Voice Initiative Study
131
