
Fitting Personalized Mechanistic Mathematical Models of Acute
Myeloid Leukaemia to Clinical Patient Data
Dennis Görlich
a
Institute of Biostatistics and Clinical Research, University of Münster, Schmeddingstraße 56, Münster, Germany
Keywords: Mechanistic Modelling, Model Fitting, Clinical Data, Model Prediction, Personalization.
Abstract: In this position paper, we discussed the potential to fit mechanistic mathematical models of acute myeloid
leukaemia to patient data. The overarching aim was to estimate personalized models. We briefly introduced
one selected mechanistic ODE model to illustrate the approach. The usually available outcome measures, e.g.
in clinical datasets, were aligned with the model’s prediction capabilities. Among the most relevant outcomes
(blast load, complete remission, and survival), only blast load turned out to be well suited to be used in the
model fitting process. We formulated an optimization problem that, finally, resulted in personalized model
parameters. The degree of personalization could be chosen by selecting only a subset of parameters within
the optimization problem. To illustrate the fitness landscape for individual patients we performed a grid search
and calculated the fitness values for each grid point. The grid search revealed that an optimum exists, but that
the fitness landscape can be very noisy. In these cases, gradient-based solvers will perform poorly and other
algorithms needs to be chosen. Finally, we belief that personalized model fitting will be a promising approach
to integrate mechanistic mathematical models into clinical research.
1 INTRODUCTION
Acute myeloid leukaemia (AML) is a haematological
cancer caused by genetic mutations and cytogenetic
aberrations in haematological stem cells (O’Donnell
et al., 2017). AML emerges in the myeloid line, i.e. it
affects the differentiation cascade that produces the
specific blood cells (erythrocytes, platelets,
basophils, neutrophils, eosinophils, monocytes,
macrophages). Most AML patients show too many
immature white blood cells, mainly myeloblasts, in
their bone marrow. These blasts also migrate to the
peripheral blood. Overall, patients suffer from
frequent and severe infections (often lethal),
tiredness, fever, and other symptoms.
AML is a heterogenous disease and for an
overview on AML subtypes, outcomes and treatment
approaches see (Döhner, 2015; Döhner 2017; Estey,
2020). A number of combination chemotherapy
protocols are used in clinical practice to treat AML
patients. Major protocols (like the “7+3”–Schema)
consists of a combination of cytarabine and an
anthracycline. Beside the cytotoxic combination
chemotherapy, newer approaches e.g. based on
a
https://orcid.org/0000-0002-2574-9419
chimeric antigen receptor T cells (CAR-T) (Gill,
2019) exist and might be widely introduced into AML
treatment in near future.
Therapy protocols for AML treatment still are less
personalized. Nevertheless, personalization promises
e.g. reduce treatment doses to a patient specific
optimal level, or reliably prediction of individual
disease courses for medical decision-making.
From the theoretical side, a number of
mathematical models for AML have been published
and should be evaluated for their usefulness in
personalization (Rubinow and Lebowitz, 1975; Röder
and Glauche, 2006; Stiehl and Marciniak-Czochra,
2012; Fimmel, 2013; Stiehl et al. 2014; Friedman et
al. 2016, Banck and Görlich, 2019).
We belief that mathematical models can qualify to
be used for personalized predictions in a clinical
setting. Fitting mathematical models to patient data is
a prerequisite on the path to personalization.
The aim of this position paper is to discuss
relevant aspects of AML models and clinical patient
data. Especially, we will discuss available outcome
measures and the model’s capacity to produce
realistic estimates on these clinical outcomes. Finally,
170
Görlich, D.
Fitting Personalized Mechanistic Mathematical Models of Acute Myeloid Leukaemia to Clinical Patient Data.
DOI: 10.5220/0010345701700175
In Proceedings of the 14th International Joint Conference on Biomedical Engineering Systems and Technologies (BIOSTEC 2021) - Volume 3: BIOINFORMATICS, pages 170-175
ISBN: 978-989-758-490-9
Copyright
c
2021 by SCITEPRESS – Science and Technology Publications, Lda. All rights reserved

an optimization problem will be set up which can be
applied to fit personalized mechanistic models to
patient data. First results from a grid search will be
presented.
2 THE AML MODEL
We here briefly introduce the mathematical AML
model as published in (Görlich and Banck, 2019).
The model was based on the Stiehl model (Stiehl et
al., 2014) and extended by a treatment mechanism.
Many aspects discussed here and later in the paper
can be applied to other published AML models.
The AML model is a system of four ordinary
differential equations (ODE). Two equations (dC1/dt;
dC2/dt) describe the healthy haematopoiesis while
the other two equations (dL1/dt; dL2/dt) describe the
leukaemic compartments. Please see Görlich and
Banck (2019) for the exact mathematical model.
In the following, the focus lies mainly on the
model parametrization. In particular, the model
catches the stem cell’s proliferation rate (p) and a self-
renewal rate (a). While the proliferation rate
describes the kinetics of cell growth and division, the
self-renewal rate describes the production of stem
cells, capable of replacing itself. Additionally, a
density term parameterizes the bone marrow’s
capability to hold stem cells. Finally, two parameters
(𝑘
,𝑘
) control the treatment
efficacy/resistance of two main cytotoxic
chemotherapy components (cytarabine,
anthracycline). The “differentiated” compartments
C2 and L2 do not proliferate anymore and,
additionally, contain an apoptosis term (d).
Healthy haematopoiesis was calibrated to a
typical human body (Stiehl et al., 2014). The
leukaemic compartments have a different set of
parameter values to respect the major changes in
cellular behaviour due to the carcinogenic mutations
within the stem cells. Model analysis (Görlich and
Banck, 2019) showed that for the leukaemic system
larger self-renewal and/or larger proliferation rates
lead to the emergence of a persisting leukaemia in the
human body. It is unclear which combinations of the
parameter values are present in actual patients.
3 ASPECTS OF
PERSONALIZATION
Mathematical and statistical models are generated to
explain real world phenomena for a whole (sub-)
group of patients. Thus, these models usually
represent an “averaged” view onto these phenomena.
Personalized predictions calculated from “average”
models can work, but also may perform poorly for
e.g. rare patient characteristics that might have been
under-represented during model fitting.
For the AML model, an important assumption is
that the basic mechanisms are also valid for a single
patient. The model then can be directly used in a
personalized setting. This assumption is reasonable,
since the mathematical form of the kinetics was
developed from the in-vivo mechanisms.
The “average” model’s interpretation is caused by
the calibration of the model parameters. The crucial
point, to introduce personalized model fitting and
prediction, thus, is the individual calibration of the
model to a single patient. Each patient should contain
his or her own set of parameter values.
Personalization via the model parametrization can
be done on different levels of detail. Full
personalization uses all model parameters. Healthy
haematopoiesis parameters, bone marrow capacity,
apoptosis, and treatment susceptibility parameters
can be considered as functions of general patient
characteristics. Although, the biological relationship
between age, gender, height, weight, sex, general
health status, chronic diseases, genetic mutations, and
biological variation on the parameters of the healthy
haematopoiesis is unclear.
Furthermore, the parameters for the leukaemia
system are likely influenced by the leukaemic stem
cell’s genetic setup. The occurrence of mutations
leading to leukaemic behaviour may act in two
fashions: (H1) a gradual modification of the healthy
parameter set is introduced, comparable to a more or
less homogenous proportionality parameter here.
(H2) A discrete, complete change of parameters
might occur. While the first mechanism (H1) suggests
that, the leukaemia shifts the stem cell’s behaviour to
an unfavourable region of the parameter space, but
stays in the neighbourhood of the healthy system, the
second hypothesis (H2) allows for jumps in the
parameter space, i.e. also, large steps might be
possible leading very clinically severe parameter
combinations. In addition, the healthy
haematopoiesis is less relevant for the leukaemia’s
behaviour in H2 compared to H1. Current hypotheses
about clonal haematopoiesis in leukaemia (Hartmann
and Metzeler, 2019) are consistent with both
hypotheses. Under H1, each relevant mutation shifts
the system to a more severe leukaemic state, while
under H2 each hit jumps through the parameter space.
Finally, personalization can now be introduce by
estimating patient-specific model parameters.
Depending on the selected subset of parameters, the
level of personalization is determined. Different
levels occur if (i) healthy haematopoiesis and
Fitting Personalized Mechanistic Mathematical Models of Acute Myeloid Leukaemia to Clinical Patient Data
171

leukaemic compartment parameters are personalized;
or (ii) only leukaemic compartment parameters are
personalized. A third aspect (iii) here is the estimation
of personalized treatment parameters. Considering
the three subgroups of parameters (healthy,
leukaemic, treatment) eight scenarios with different
interpretations emerge. A full personalization can
only be reached when parameters from all three
subgroups are estimated in a personalized way.
Leaving one or two parameter subgroups at the
population parameter values changes the
interpretation of the resulting predictions.
4 ALIGNING MODEL
OUTCOMES WITH CLINICAL
DATA
To be able to fit the AML model to patient data an
analysis of, on the one hand, the availability of
relevant clinical patient (outcome) data is necessary.
On the other hand, the mechanistic model, due to the
introduced abstraction, needs to be capable to predict
these selected aspects of AML in a sufficiently
detailed manner.
4.1 Typical Variables Collected in
Clinical AML Datasets
Data, which is e.g. regularly collected within clinical
research about AML can be structured into four
domains: (i) patient characteristics at
diagnosis/baseline; (ii) leukaemia characteristics
(molecular genetics, cytogenetics) and blood
laboratory; (iii) treatment related information
(schemata, dose); and (iv) outcomes (blast load,
complete remission, blood laboratory, survival). With
respect to identify a suitable set of clinical variable to
estimate model parameters, we will focus onto
outcome data here.
In the following, the clinical definitions of major
patient outcomes are briefly summarized.
Blast load
Patients typically undergo blood laboratory analysis
and bone marrow (BM) aspirations. Peripheral blood
(pB) can be analysed more often than BM samples,
since the latter need an invasive biopsy of the bones,
to be collected. Nevertheless, the BM samples are the
more reliable source to judge a patient’s leukaemic
load more accurately (Percival et al. 2017). Blast load
is defined as percentage of blast cells in the collected
sample, either pB or BM.
Survival
Patient survival is one of the main outcomes in
oncological clinical research. It can be observed
directly and plays a major role within therapy
optimization trials.
Complete remission
Complete remission (CR) is the favourable situation
that leukaemic cells are sufficiently eradiated from
the patient’s body. CR is the primary aim of any
curative AML treatment approach. To identify a CR
a number of clinical requirements needs to be met
(Döhner et al., 2017)) : (i) Bone marrow blasts <5%;
(ii) absence of circulating blasts and blasts with Auer
rods; (iii) absence of extramedullary disease; (iv)
ANC ≥1.0 × 10
9
/L (1000/µL); (v) platelet count ≥100
× 10
9
/L (100 000/µL). More response categories, like
CR(MRD-), CRi, or partial remission (PR), can be
reached, representing other system states.
4.2 Predictability of Clinical Outcomes
within the Mechanistic Model
The mechanistic model, as described in section 2,
aggregates a rather complex biological system into a
system of only four ODEs. To be able to explain a
real world system, the mathematical model needs to
be able to assign model outcomes to entities
observable in the real world.
The system’s four state variables can be directly
interpreted as coarse-grained compartments in the
differentiation cascades. Thus, there should be a
direct relation between model predictions (i.e. the
ODE model’s solution over time) and the observed
cell number in a patient. In the following, four main
outcome measures, regularly documented in clinical
trials (cp 4.1.4), will be discussed.
4.2.1 Predicting Blast Load
Blast load is a direct measurement of a cellular
quantity. It thus can be directly related to the
respective modelled compartments.
Both leukaemic compartments (L1, L2) can be
interpreted to represent blasts cells. Blast load (in
percent) can then be computed as relative proportion
of leukaemic cells in all bone marrow cells, i.e. the
sum of the leukaemic compartments plus the BM
compartment of the healthy haematopoiesis
(L1,L2,C1).
BIOINFORMATICS 2021 - 12th International Conference on Bioinformatics Models, Methods and Algorithms
172

4.2.2 Predicting Complete Remission
The definition of CR (4.1) shows a clear problem,
here. Some criteria, necessary to determine a CR, are
not represented nor predictable by the model, e.g.
extramedullary disease, ANC, or platelet count. Thus,
for a clinically comparable prediction of CR, our
model is not well suited. Reasons for this, are for
example that for these criteria a concise mechanistic
understanding how to include these terms is lacking.
To produce clinical valid predictions model’s,
models should allow for an as perfect alignment to
clinical reality as possible and CR should not be used
here.
4.2.3 Predicting Survival
Similarly, survival is hard to predict from dynamic
models. The only possibility to predict survival is to
define a set of system states to be interpreted as
“patient death”. E.g. a situation where the healthy
haematopoiesis is completed eradicated by the
leukaemic cells. Of course, this might be still a
severe, but manageable situation, if the patient is
hospitalized. Thus, this surrogate definition only
partly covers clinical reality. Calibrating mechanistic
models to accurately predict patient death would be a
strong advantage, since it opens the possibility to
access clinical survival data.
4.2.4 Predicting Relapse
Prediction of relapse can be realized by identifying a
system state where blast load rises again, after a CR
was reached. Relapse occurs when leukaemic cells
remain in the patient after chemotherapy. These cells
can still reproduced and overtake the bone marrow,
again, after some time. To simulate relapse a
mechanistic model, thus, needs to be able to reach a
CR state with a residual disease. A prerequisite for
relapse is a CR and since CR cannot be predicted in a
sufficient level of detail compared to the clinically
defined criteria, relapse prediction will be not
completely reliable.
5 FORMULATION OF THE
OPTIMIZATION PROBLEM
Summarizing the considerations from 4.2.1 to 4.2.4
the only remaining, reliable variable is blast load (or
percentage). It is a variable that is frequently observed
in patients and blast load can be directly calculated
from the system state at each point of time. Although,
the model is abstract and course-grained, the level of
detail should be sufficient to produce a valid blast
load estimation. All other outcomes would be more
interesting from a clinical point of view, but cannot
be reproduced from the model with sufficient detail
and validity. Thus, blast load will be used as main
observable to link model prediction with patient data.
In the following section, an optimization problem
for fitting the AML model to clinical data is proposed.
At first, a dataset
𝔻 of individual patient data is
defined as
𝔻=
{
𝑑
|
𝑖=1,…,𝑁},
(1)
with
𝑑
=𝑡
,
,𝑏
,
,… ,𝑡
,
,𝑏
,
(2)
as a set of ordered tuples t
i,j
,b
i,j
. Each tuple t
i,j
,b
i,j
represents the blast load 𝑏
,
of patient i at time 𝑡
,
.
Each patient can have 1 to 𝜏
assessments. This
formulation allows that different patients had their
blast assessment at different time points t
i,j
and that
the number of assessments 𝜏
may be different
between patients.
Predicted blast load at time t
i,j
is denoted as
𝐵
ℳ
𝛽
;𝑡
,
𝑤𝑖𝑡ℎ
𝛽
=𝑝
,𝑎
,𝑝
,𝑎
,𝑘
,𝑘
.
(3
)
𝛽
is the personalized vector of model parameters.
Given a data set
𝔻 and the model ℳ the
goodness-of-fit measure ℱ
(𝑑
,ℳ,𝛽
) assesses the
model with respect to the patient’s observations 𝑑
with parametrization 𝛽
. Goodness-of-fit ℱ
is
defined as
ℱ
(
𝑑
,
ℳ
,𝛽
)
=𝑐⋅𝑏
,
−𝐵
ℳ𝛽
;𝑡
,
(4)
over all 𝑗∈{1,…,𝜏
} time points of patient i.
The factor c is introduced to shift the fitness
measure to a range of values that are beneficial for the
optimization procedure. The solution of the
optimization problem is a vector of optimal model
parameters 𝛽
∗
, which minimize
𝛽
∗
=𝑎𝑟𝑔𝑚𝑖𝑛
(
ℱ
(
𝑑
,ℳ,𝛽
)
)
(5)
One optimization problem per patient needs to
be solved.
Due to the structure of the ODE system a closed
solution to this optimization problem cannot be given.
The model was explicitly solved for each
parameter vector in a grid search approach. The grid
was defined by a selection of four relevant model
parameters, i.e. 𝑝
,𝑎
,𝑘
,𝑘
. Table 1 shows
the applied grid step sizes.
Fitting Personalized Mechanistic Mathematical Models of Acute Myeloid Leukaemia to Clinical Patient Data
173
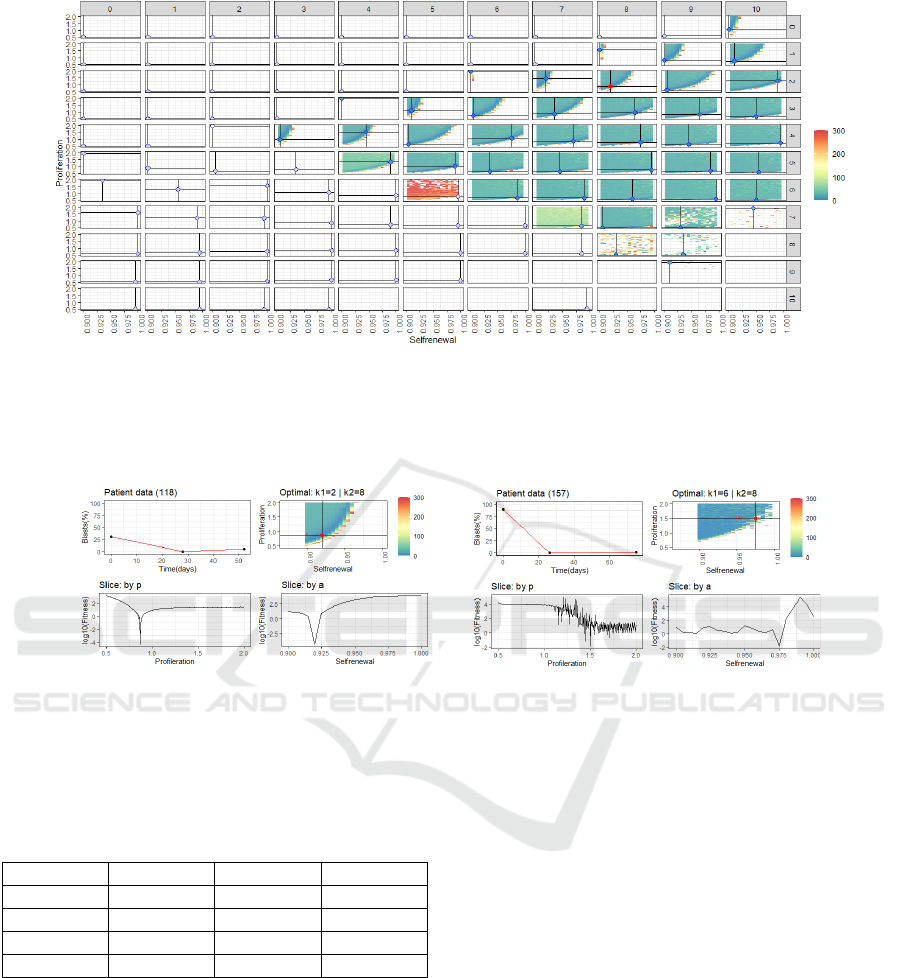
Figure 1: Heatmap panel-plot of all fitness values 𝐹
computed for the whole parameter grid for one patient. A single panel
represent (𝑘
,𝑘
) combinations. Within each panel the (𝑎
,𝑝
)-plane (selfrenewal, proliferation) is plotted. Colour was
assigned to fitness values between 0 and 300. Within each panel, the local minimum is marked by a filled circle. Black
coordinate lines indicate the position of the minimum for better orientation. The global minimum is marked by a filled red
circle. Here, the global minimum is located in panel (2,8).
Figure 2: Exemplary results of the fitness landscape for two individual patient datasets (left side vs right side). For each
patient the upper left shows 𝑑
and the fitted 𝐵
over time; the upper right shows a subplot of the fitness landscape of the
combination of 𝑘
and 𝑘
where the global optimum for this patient is located. Color represents 𝐹
. Only values
between 0 and 300 have been plotted. The two lower panels on each side show slice plots along the proliferation (p) and self-
renewal (a) axes. While the patient shown on the left side has a rather smooth fitness landscape along the relevant axes, the
other patient shows a noisy fitness landscape. This is a frequent observation.
Table 1: Definition of the grid search step sizes.
Paramete
r
Minimu
m
Maximu
m
Step size
𝑝
0.5 2 0.005
𝑎
0.9 1 0.005
𝑘
0 10 1
𝑘
0 10 1
For the healthy haematopoiesis, an averaged
(and not individualized) behaviour was assumed,
thus, the respective parameters were not included in
the grid search.
For each combination in the grid a fitness value
was computed by solving the ODE system
numerically (using the deSolve package (Karline et
al. 2010) in R (R Core Team, 2020)). Figure 1 shows
the fitness values ℱ
in the expanded parameter grid
for one exemplary AML patient. The plot shows
nicely that for the treatment related parameters
(𝑘
,𝑘
) a compact region with (near) optimal
values exist. Within each therapy combination, the
(a,p)-fitness landscape has a specific form showing a
band of very good solutions ranging from low self-
renewal proliferations to combinations with increased
self-renewal and proliferation. The finally identified
global optimum can be found uniquely as Figure 2
illustrates. If the step size is decreased the optimum
can be identified with more accuracy.
Figure 2 also shows that the fitness landscape
can be very noisy. This should be considered when a
numerical optimization algorithm is chosen. While
smooth fitness landscapes can be easily handled with
usual gradient-descent techniques, the noisy
situations needs special consideration. We propose
e.g. to apply the differential evolution (DE) algorithm
(Kenneth et al., 2006) which can overcome the local
minimal in the fitness landscape. A first attempt to
apply the DE algorithm for this task showed
promising results (data not shown).
BIOINFORMATICS 2021 - 12th International Conference on Bioinformatics Models, Methods and Algorithms
174

6 SUMMARY AND CONCLUSION
With this position paper, we aimed to explain the
challenges to align mechanistic mathematical models
of AML and patient datasets.
A point to consider is the selection of
personalization parameters. A full personalization,
i.e. including all model parameters in the personalized
optimization problem, might be hard to solve.
Nevertheless, the full personalization is the most
stringent approach.
We, here, demonstrated that the numerical
solution identified by grid search for a reduced set of
personalization parameters lead already to usable
results. Furthermore, we implicitly introduced an
assumption about the parameters, namely that healthy
haematopoiesis equates to the population average.
This may be reasonable in certain situations. E.g.
within clinical trials, or standardized treatment
regimens, the dose of chemotherapy is fixed.
Assuming non-personalized treatment parameters for
an analysis of a trial cohort might be justifiable.
Overall, the degree of personalization should be
selected according to the intended analysis.
Future research in the field of AML models should
focus on a qualitative and quantitative validation
strategy. A more stringent validation will lead to
greater acceptance of modelling results in the clinical
practice. Furthermore, the sensitivity analysis of
personalized parameters will give valuable insights for
the quality and interpretability of model predictions.
The integration of mechanistic modelling into the
clinical practice can have a great impact, e.g. to
provide personalized prediction of treatment success,
and thus should be a major aim.
REFERENCES
Banck, J. C., & Görlich, D. (2019). In-silico comparison of
two induction regimens (7 + 3 vs 7 + 3 plus additional
bone marrow evaluation) in acute myeloid leukemia
treatment. BMC systems biology, 13(1), 18.
Döhner, H., Weisdorf, D. J., & Bloomfield, C. D. (2015).
Acute Myeloid Leukemia. The New England journal of
medicine, 373(12), 1136–1152.
Döhner, H., Estey, E., Grimwade, D., Amadori, S.,
Appelbaum, F. R., Büchner, T., Dombret, H., Ebert, B.
L., Fenaux, P., Larson, R. A., Levine, R. L., Lo-Coco,
F., Naoe, T., Niederwieser, D., Ossenkoppele, G. J.,
Sanz, M., Sierra, J., Tallman, M. S., Tien, H. F., Wei,
A. H., … Bloomfield, C. D. (2017). Diagnosis and
management of AML in adults: 2017 ELN
recommendations from an international expert panel.
Blood, 129(4), 424–447.
Estey E. H. (2020). Acute myeloid leukemia: 2021 update
on risk-stratification and management. American
journal of hematology, 10.1002/ajh.25975. Advance
online publication.
Fimmel, E. (2013). On optimal and suboptimal treatment
strategies for a mathematical model of leukemia.
Mathematical Biosciences and Engineering, 10(1),
151–165.
Fridman, E., Bonnet, C., Mazenc, F., & Djema, W. (2016).
Stability of the cell dynamics in acute myeloid
leukemia. Systems & Control Letters, 88, 91–100.
https://doi.org/10.1016/j.sysconle.2015.09.006
Gill S. I. (2019). How close are we to CAR T-cell therapy
for AML?. Best practice & research. Clinical
haematology, 32(4), 101104.
Hartmann, L., & Metzeler, K. H. (2019). Clonal
hematopoiesis and preleukemia-Genetics, biology, and
clinical implications. Genes, chromosomes & cancer,
58(12), 828–838.
Kenneth V. Price, Storn R.M., Lampinen J.A., 2006.
Differential Evolution - A Practical Approach to Global
Optimization. Berlin Heidelberg: Springer-Verlag.
Karline S., Petzoldt T., Setzer R.W., 2010. Solving
Differential Equations in R: Package deSolve. Journal
of Statistical Software, 33(9), 1-25.
O'Donnell, M. R., Tallman, M. S., Abboud, C. N., Altman,
J. K., Appelbaum, F. R., Arber, D. A., Bhatt, V., Bixby,
D., Blum, W., Coutre, S. E., De Lima, M., Fathi, A. T.,
Fiorella, M., Foran, J. M., Gore, S. D., Hall, A. C.,
Kropf, P., Lancet, J., Maness, L. J., Marcucci, G., …
Ogba, N. (2017). Acute Myeloid Leukemia, Version
3.2017, NCCN Clinical Practice Guidelines in
Oncology. Journal of the National Comprehensive
Cancer Network: JNCCN, 15(7), 926–957.
Percival, M. E., Lai, C., Estey, E., & Hourigan, C. S. (2017).
Bone marrow evaluation for diagnosis and monitoring
of acute myeloid leukemia. Blood reviews, 31(4), 185–
192.
R Core Team, 2020. R: A language and environment for
statistical computing. R Foundation for Statistical
Computing, Vienna, Austria. URL https://www.R-
project.org/.
Rubinow, S. I., & Lebowitz, J. L. (1975). A mathematical
model of neutrophil production and control in normal
man. Journal of Mathematical Biology, 1, 187.
Roeder, I., & Glauche, I. (2006). Towards an understanding
of lineage specification in hematopoietic stem cells: A
mathematical model for the interaction of transcription
factors GATA-1 and PU.1 Journal of Theoretical
Biology, 1–27.
Stiehl, T., & Marciniak-Czochra, A. (2012). Mathematical
Modeling of Leukemogenesis and Cancer Stem Cell
Dynamics. Mathematical Modelling of Natural
Phenomena, 7(1), 166–202.
Stiehl, T., Baran, N., Ho, A. D., & Marciniak
Czochra, A. (2014). Clonal selection and therapy resistance
in acute leukaemias: mathematical modelling explains
different proliferation patterns at diagnosis and relapse.
Journal of the Royal Society, Interface, 11(94),
20140079.
Fitting Personalized Mechanistic Mathematical Models of Acute Myeloid Leukaemia to Clinical Patient Data
175
