Embedding Human Knowledge into Deep Neural Network
via Attention Map
Masahiro Mitsuhara, Hiroshi Fukui, Yusuke Sakashita, Takanori Ogata, Tsubasa Hirakawa,
Takayoshi Yamashita and Hironobu Fujiyoshi
Chubu University, Kasugai, Aichi, Japan
Keywords:
Visual Explanation, Human-in-the-Loop, Attention Mechanism, Object Recognition, Fine-grained
Recognition.
Abstract:
The conventional method to embed human knowledge has been applied for non-deep machine learning. Mean-
while, it is challenging to apply it for deep learning models due to the enormous number of model parameters.
In this paper, we propose a novel framework for optimizing networks while embedding human knowledge.
The crucial factors are an attention map for visual explanation and an attention mechanism. A manually edited
attention map, in which human knowledge is embedded, has the potential to adjust recognition results. The
proposed method updates network parameters so that the output attention map corresponds to the edited ones.
As a result, the trained network can output an attention map that takes into account human knowledge. Ex-
perimental results with ImageNet, CUB-200-2010, and IDRiD demonstrate that it is possible to obtain a clear
attention map for a visual explanation and improve the classification performance.
1 INTRODUCTION
Visual explanation is often used to interpret the
decision-making of deep learning in the computer vi-
sion field (Ribeiro et al., 2016; Chattopadhay et al.,
2018; Ramprasaath et al., 2017; Smilkov et al., 2017;
Zeiler and Fergus, 2014; Zhou et al., 2016; Fukui
et al., 2019; Montavon et al., 2018; Springenberg
et al., 2015; Fong and Vedaldi, 2017; Petsiuk et al.,
2018; Jetley et al., 2018). Visual explanation ana-
lyzes the decision-making of a convolutional neural
network (CNN) (LeCun et al., 1989) by visualizing an
attention map that highlights discriminative regions
used for image classification. Typical visual expla-
nation approaches include class activation mapping
(CAM) (Zhou et al., 2016) and gradient weighted-
CAM (Grad-CAM) (Ramprasaath et al., 2017). CAM
outputs an attention map by utilizing the response
of the convolution layer. Grad-CAM outputs an at-
tention map by utilizing the positive gradients of a
specific category. Attention branch network (ABN)
(Fukui et al., 2019) that extends an attention map to
an attention mechanism in order to improve the classi-
fication performance has also been proposed. Thanks
to these visual explanation methods, the decision-
making of CNNs is becoming clearer. However, we
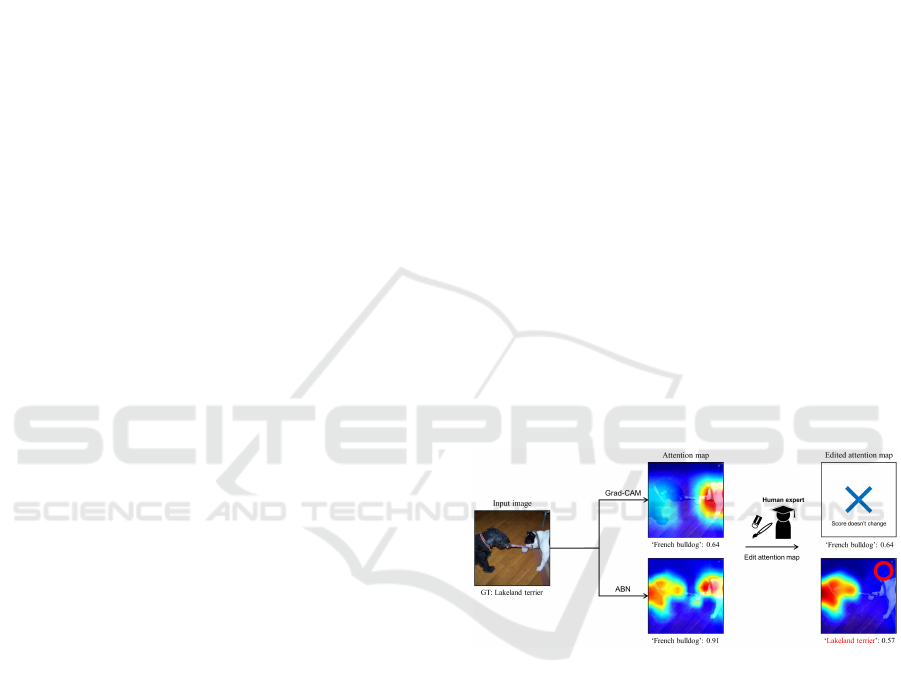
Figure 1: Adjustment of recognition result by editing an
attention map on visual explanation.
may not be able to get the desirable attention map
corresponded to Ground Truth (GT). Examples of at-
tention maps generated by Grad-CAM and ABN are
shown in Fig. 1. Although the input image is anno-
tated “Lakeland terrier” as a GT, it contains multi-
ple objects: “Lakeland terrier” and “French bulldog”.
Therefore, if CNN pays attention to different objects
than the GT, it is likely to perform incorrect classifica-
tions. This mismatch would be critical in some appli-
cations. For example, in medical image recognition
systems, a mismatch between the classification result
and the attention region would degrade the reliability
of the classification.
To solve this issue, we aim to realize a method
for embedding human knowledge into deep learning
626
Mitsuhara, M., Fukui, H., Sakashita, Y., Ogata, T., Hirakawa, T., Yamashita, T. and Fujiyoshi, H.
Embedding Human Knowledge into Deep Neural Network via Attention Map.
DOI: 10.5220/0010335806260636
In Proceedings of the 16th International Joint Conference on Computer Vision, Imaging and Computer Graphics Theory and Applications (VISIGRAPP 2021) - Volume 5: VISAPP, pages
626-636
ISBN: 978-989-758-488-6
Copyright
c
2021 by SCITEPRESS – Science and Technology Publications, Lda. All rights reserved

models. Although this approach has been widely pro-
posed (Branson et al., 2010; Deng et al., 2013; Bran-
son et al., 2011; Parkash and Parikh, 2012; Parikh and
Grauman, 2011; Duan et al., 2012), the conventional
methods are based on rather small machine learning
models comprising fewer model parameters, such as
decision trees and conditional random fields (CRFs)
(Quattoni et al., 2007). It is difficult to embed human
knowledge into deep learning models due to the mas-
sive number of parameters.
In this paper, we propose a method for embed-
ding human knowledge into deep learning models.
The crucial factors leading the proposed method are
an attention map for visual explanation and an atten-
tion mechanism, and we focus on ABN (Fukui et al.,
2019). ABN applies an attention map for visual ex-
planation to the attention mechanism. Therefore, by
editing an attention map manually, as shown in Fig. 1,
ABN can output a desirable recognition result by in-
ference processing using the edited attention map. We
propose a fine-tuning method based on the character-
istics of ABN and an edited attention map. The pro-
posed method fine-tunes the attention and perception
branches of ABN to output the same attention map as
the edited one. By learning the edited attention map
that incorporates human knowledge, we can both ob-
tain a more interpretable attention map and improve
the recognition performance.
Our contributions are as follows:
• We demonstrate that manually editing the atten-
tion map used for a visual explanation can im-
prove the recognition performance by reflecting
human knowledge.
• We propose a fine-tuning method that uses manu-
ally edited attention maps. By training a network
to output the same attention maps as the edited
ones, we can embed human knowledge into deep
neural networks.
• Beyond the visual explanation widely required in
the development of deep neural networks, this pa-
per formulates a novel optimization framework of
networks that humans can intuitively edit via a vi-
sual interface. This will open new doors to future
human-machine cooperation.
2 RELATED WORK
This section introduces studies on embedding human
knowledge into machine learning methods and visual
explanation on deep learning models.
2.1 Embedding Human Knowledge
One of the major approaches to embedding human
knowledge into machine learning models is human-
in-the-loop (HITL) (Branson et al., 2010; Deng et al.,
2013; Branson et al., 2011; Parkash and Parikh, 2012;
Parikh and Grauman, 2011; Duan et al., 2012). In
HITL, human operators intervene during the training
of machine learning. In the field of computer vision,
HITL is often applied to difficult recognition tasks
such as fine-grained recognition. Several feature ex-
traction approaches based on human knowledge have
been proposed (Branson et al., 2010; Duan et al.,
2012; Deng et al., 2013).
Various kinds of human knowledge are introduced
in HITL for fine-grained recognition. Branson et
al. (Branson et al., 2010) proposed an interactive
HITL approach that helps to train a decision tree by
using a question and answer with respect to a spe-
cific bird. In addition to items inherent in an ob-
ject, characteristic positions or regions of an object
have also been used as human knowledge. Duan et
al. (Duan et al., 2012) introduced the body part po-
sition and color of a bird as human knowledge into
the training of a CRF. Deng et al. (Deng et al., 2013)
used a bubble, that is, a circular bounding box, as hu-
man knowledge. This bubble information is annotated
from an attention region when a user distinguishes the
two types of birds. By annotating the bubble with
various pairs and users, characteristic regions of bird
images can be obtained when we recognize bird cat-
egories. These bubbles are introduced to the HITL
framework as human knowledge, and can improve the
accuracy of fine-grained recognition because the ma-
chine learning model is trained with an important lo-
cation for recognizing the bird category. However,
these methods have primarily been applied to models
having a small number of parameters, and are rarely
applied to deep learning. This is because deep learn-
ing has an enormous number of parameters.
Linsley et al. (Linsley et al., 2019) proposed
a method that incorporates human knowledge into
large-scale deep neural networks using the HITL
framework. This method added a spatial atten-
tion mechanism into the attention mechanism (Luong
et al., 2015; Kelvin et al., 2015; Hu et al., 2018; Bah-
danau et al., 2016; Mnih et al., 2014; Wang et al.,
2017; Vaswani et al., 2017; Wang et al., 2018; Yang
et al., 2016; You et al., 2016; Woo et al., 2018) of
squeeze-and-excitation networks (SENet) (Hu et al.,
2018) and trained the network by using a ClickMe
map that introduces human knowledge to the weights
of the attention mechanism. This method can achieve
higher accuracy because the network is trained while
Embedding Human Knowledge into Deep Neural Network via Attention Map
627
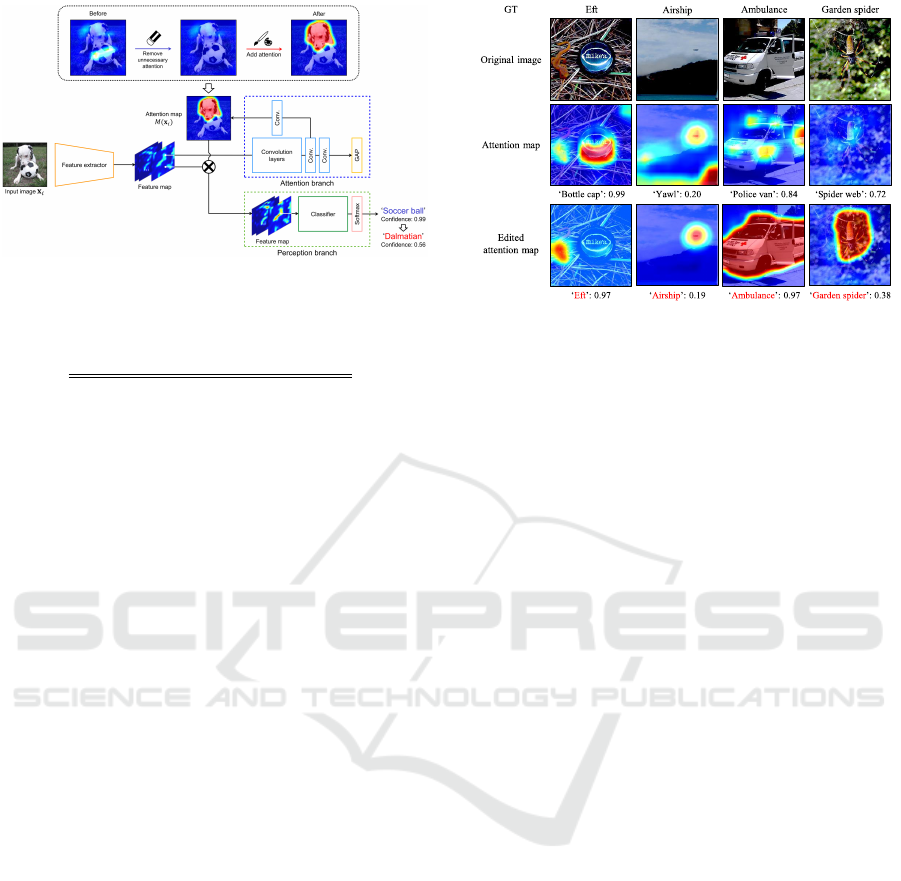
Figure 2: Editing procedure of an attention map.
Table 1: Top-1 and top-5 errors by edited attention map on
validation samples on ImageNet dataset (1k) [%].
top-1 top-5
Before editing 100.0 19.0
After editing 83.2 15.8
the attention mechanism weights located at multiple
points become the same as the ClickMe map. Because
the attention mechanism in (Linsley et al., 2019) is a
channel-wise structure, attention maps are output for
each feature map. It is difficult to edit an attention
map when a human operator views the map subjec-
tively. Meanwhile, we use a single-channel attention
map for embedding human knowledge into deep neu-
ral networks. A human operator can understand the
attention map intuitively and edit the map through a
visual interface interactively. Therefore, our method
demonstrates that humans can intuitively intervene
into networks. In addition, Linsley et al.’s method
learns end-to-end using pre-collected human attention
regions, so there is no human intervention in the learn-
ing loop. In contrast, our network model is fine-tuned
by editing the attention map that was misclassified
by the pre-trained model, which trained only labels
and images. Therefore, it is possible to directly and
interactively embed human knowledge into the net-
work model. This simple and intuitive solution is the
strength of our method.
2.2 Visual Explanation
To interpret deep learning in computer vision, visual
explanation that visualizes the discriminative region
in the inference process has been used (Ribeiro et al.,
2016; Chattopadhay et al., 2018; Ramprasaath et al.,
2017; Smilkov et al., 2017; Zeiler and Fergus, 2014;
Zhou et al., 2016; Fukui et al., 2019; Montavon et al.,
2018; Springenberg et al., 2015; Fong and Vedaldi,
2017; Petsiuk et al., 2018; Jetley et al., 2018). Visual
explanation can be categorized into two approaches:
gradient-based, which outputs an attention map using
gradients, and response-based, which outputs an at-
Figure 3: Example of conventional and edited attention
maps.
tention map using the response of the convolutional
layer. One of the gradient-based approaches is Grad-
CAM (Ramprasaath et al., 2017), which can obtain
an attention map for a specific category by using the
response of the convolution layer and a positive gra-
dient in the backpropagation process. Grad-CAM can
be applied to various pre-trained models.
One of the response-based approaches is
CAM (Zhou et al., 2016), which outputs an attention
map by using a K channel feature map from the con-
volution layer of each category. The attention maps of
each category are calculated by using the K channel
feature map and the weight at a fully connected layer.
However, CAM degrades the recognition accuracy
because spatial information is removed due to the
global average pooling (GAP) (Lin et al., 2014) layer
between the convolutional and fully connected layers.
To address this issue, ABN has been proposed (Fukui
et al., 2019), which extends an attention map for the
visual explanation to an attention mechanism. By ap-
plying an attention map to the attention mechanism,
ABN improves the classification performance and
obtains an attention map simultaneously.
In this paper, we focus on this ABN ability. Be-
cause of the attention mechanism, ABN can ad-
just recognition results by considering the manually
edited attention map. Moreover, we propose a method
for embedding human knowledge into the network by
fine-tuning so that the edited attention map and the
attention map obtained from ABN become the same.
3 INVESTIGATION OF EDITING
ATTENTION MAP
We believe editing an attention map has a potential to
adjust the recognition result. In this section, we inves-
tigate the behavior of ABN in a case where we edit an
VISAPP 2021 - 16th International Conference on Computer Vision Theory and Applications
628

attention map manually. Specifically, we confirm the
changes in classification performance by editing an
attention map on the ImageNet dataset (Deng et al.,
2009).
3.1 Editing of Attention Map
We used an ABN whose backbone is 152-layer
ResNet (He et al., 2016) (ResNet-152+ABN) as a
network model. ResNet-152+ABN is trained with
1, 200k training samples from the ImageNet dataset.
Then, we selected the 1k misclassified samples from
the validation samples and edited their attention maps.
Figure 2 shows the editing procedure of an atten-
tion map. We first input a misclassified sample to
ResNet-152+ABN and obtain the attention map from
the attention branch, where the size of the attention
map is 14 × 14 pixels. Then, we edit the obtained at-
tention map manually. Note that the attention map is
resized to 224 × 224 pixels and is overlaid with the
input image for ease of manual editing. The edited
attention map is resized to 14 ×14 pixels and used for
an attention mechanism to infer classification results
from the perception branch. In the example shown
in Fig. 2, the attention map obtained from ResNet-
152+ABN classifies the input image as “Soccer ball”
and also highlights the corresponding object. By edit-
ing the attention map to highlight “Dalmatian” and
using it for the attention mechanism, the classification
result is successfully adjusted to “Dalmatian”.
Examples of the edited attention map are provided
in Fig. 3. In the two left columns, images contain ob-
jects from multiple categories and ResNet-152+ABN
misclassifies these images due to focusing on differ-
ent objects. For example, in the first column, al-
though the GT is “Eft”, ResNet-152+ABN recognizes
“Bottle cap”, because the attention map highlights the
“Bottle cap”. By removing the attention region of
“Bottle cap” and adding the attention to “Eft”, the
recognition result of ABN is changed to “Eft”. In the
second column, ResNet-152+ABN also misclassifies
to “Yawl” because the attention map highlights both
“Airship” and “Yawl”. By removing the attention lo-
cation of “Yawl”, we can adjust the recognition result
to “Airship”. Meanwhile, in the two right columns,
the attention maps do not highlight the entire objects
and incorrect classification results are provided. By
editing the attention maps to highlight the entire ob-
jects, the classification results are adjusted correctly.
We show the top-1 and top-5 errors before and
after editing the attention map in Tab. 1. Here, the
top-1 error before editing is 100% because the 1,000
validation samples we used are collected from false
recognition on the top-1 recognition result. We can
reduce the top-1 error by 16.8% by editing the atten-
tion maps. In the top-5 error, we can also reduce from
19.0% to 15.8%.
4 PROPOSED METHOD
We discuss how to embedding human knowledge into
deep neural networks. The results discussed in Sec. 3
demonstrate that the recognition result of ABN can
be adjusted by editing the attention map. This sug-
gests that ABN can be applied to embedding human
knowledge into the network. Therefore, we propose
fine-tuning the attention and perception branches of
ABN by using the edited attention map. By training
the attention and perception branches with the edited
attention map including human knowledge, ABN can
output an attention map that considers this knowledge
and thereby improve the classification performance.
4.1 Embedding Human Knowledge via
Edited Attention Map
The flow of the proposed method is shown in Fig. 4.
First, an ABN model is trained using training samples
with labels, and then we collect the attention maps
of these samples from the trained model. We only
collect the attention maps of misclassified training
samples. Second, we edit each of the attention map
based on human knowledge to recognize them cor-
rectly. Third, the attention and perception branches
of ABN are fine-tuned with the edited attention maps.
During the fine-tuning process, we update the param-
eters of the attention and perception branches by us-
ing the loss of ABN and a loss calculated from the
attention map output from ABN and the edited one
(the details are described in Sec. 4.3).
4.2 Manual Edit of Attention Map
We introduce the three methods to edit attention maps
depending on the dataset.
ImageNet Dataset. We manually edit the attention
maps of the ImageNet dataset with the same process
as described in Sec. 3. To edit as many attention maps
as possible, we created a tool that can edit attention
maps interactively, as shown in Fig. 6. This tool can
add (Fig. 6(a)) and remove (Fig. 6(b)) an attention re-
gion simply by dragging the mouse. With this tool,
we can edit attention maps interactively while verify-
ing the top-3 classification results. Examples of the
edited attention maps are shown in Fig. 5(a). These
Embedding Human Knowledge into Deep Neural Network via Attention Map
629
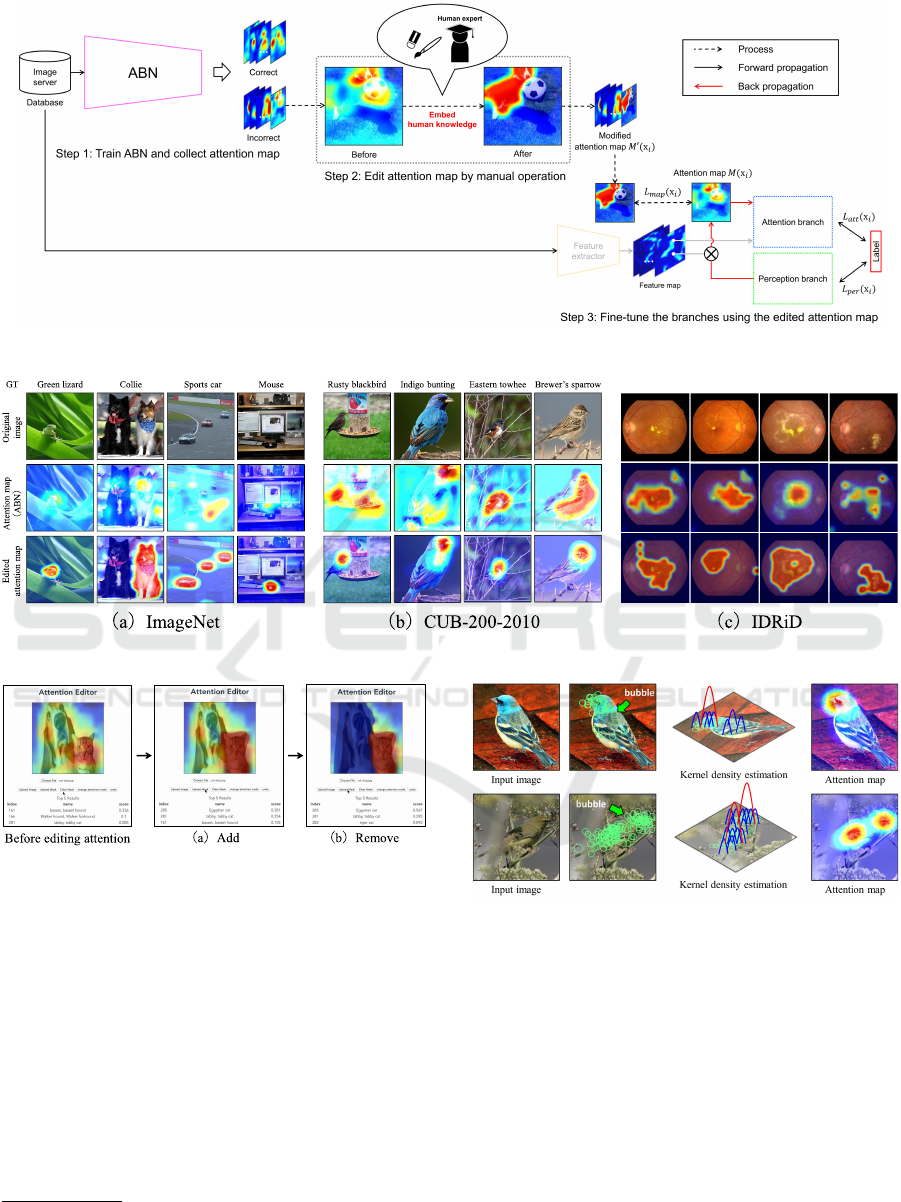
Figure 4: Process flow of the proposed method.
Figure 5: Example of edited attention map for each dataset.
Figure 6: Attention map editor tool. (a) Addition of atten-
tion. (b) Removal of attention.
maps are edited so that an object or characteristic re-
gion with respect to the GT is highlighted
1
.
CUB-200-2010 Dataset. In the CUB-200-2010
dataset (Welinder et al., 2010), we embed human
knowledge into an attention map by using bubble in-
formation (Deng et al., 2013). The bubble informa-
tion represents the attention region by means of the
position and scale of the circular bounding box when
multiple users distinguish two categories of birds.
This information is an important human knowledge
to recognize the multiple categories of birds. For this
reason, we make an attention map with human knowl-
1
This tool is available at https://github.com/
machine-perception-robotics-group/AttentionEditorABN.
Figure 7: Making an attention map from the bubble by ker-
nel density estimation.
edge from the bubble information.
For each bird image, bubbles are annotated by
multiple users. The number of bubbles given by one
user is not limited. To make an attention map from the
bubbles, we use a kernel density estimation with mul-
tiple bubbles, as shown in Fig. 7. A dense region of
bubbles indicates an important region for recognizing
the bird category. The density of bubble information
enables us to obtain the attention map embedded with
human knowledge, as shown in Fig. 5(b). The map
is then normalized to [0-1] and used for the proposed
fine-tuning method.
VISAPP 2021 - 16th International Conference on Computer Vision Theory and Applications
630

Fundus Image Dataset (IDRiD). To achieve an
automatic diagnosis, medical image recognition has
been attempted for various recognition tasks, such as
retinal disease recognition (Jeffrey et al., 2018) and
risk forecasting of heart disease (Ryan et al., 2018).
In actual medical practice, a system that can explain
the reason behind a decision is required in order to
enhance the reliability of the diagnosis. The pre-
sentation of decision-making in automatic diagnosis
is attracting considerable attention because automatic
diagnosis is greatly helpful to doctors when making
a diagnosis. In this paper, we evaluate the disease
recognition of a fundus image.
For this disease recognition, we use the Indian Di-
abetic Retinopathy Image Dataset (IDRiD) (Porwal
et al., 2018). IDRiD is concerned with the disease
grade recognition of retina images, and the presence
or absence of diseases is recognized from exudates
and hemorrhages. IDRiD includes a segmentation la-
bel of disease regions annotated by a specialist, as
shown in Fig. 5(c). We edit the attention map of the
disease classification task by using the segmentation
label.
4.3 Fine-tuning of the Branches
After editing attention maps including human knowl-
edge, ABN is fine-tuned with these maps. In the pro-
posed fine-tuning method, we formulate the loss func-
tion L in addition to the conventional ABN loss func-
tion L
abn
. Let x
i
be the i-th sample in the training
dataset. The loss function of ABN is calculated by
L
abn
(x
i
) = L
att
(x
i
) + L
per
(x
i
), (1)
where L
att
and L
per
are conventional cross entropy
losses for the attention and perception branches, re-
spectively. The loss function of the fine-tuning L(x
i
)
is defined as
L(x
i
) = L
abn
(x
i
) + L
map
(x
i
). (2)
As the loss of the attention maps L
map
, we use the
L2 norm between the two attention maps. We denote
an output attention map from ABN and a edited at-
tention map as M(x
i
) and M
0
(x
i
), respectively. The
attention map loss L
map
are formulated by
L
map
(x
i
) = γkM
0
(x
i
) − M(x
i
)k
2
, (3)
where γ is a scale factor. Typically, L
map
is larger than
L
att
and L
per
. Hence, we adjust the effect of L
map
(x
i
)
by scaling L
map
with γ.
By introducing L
map
, ABN is optimized so that an
output attention map is close to the edited attention
map including human knowledge. In this way, we
can embed human knowledge into a network via the
edited attention map. During the fine-tuning, the pro-
posed method optimizes the attention and perception
branches of ABN. The feature extractor that extracts
the feature map from an input image is not updated
during the fine-tuning process.
5 EXPERIMENTS
We evaluate the proposed method on image clas-
sification (Deng et al., 2009), fine-grained recogni-
tion (Welinder et al., 2010), and fundus image clas-
sification (Porwal et al., 2018) tasks. Also, in order to
quantitatively evaluate the explanation capability of
the attention map, we use the deletion metric, the in-
sertion metric, and the degree of similarity between
the edited attention map and the attention map output
by the network.
5.1 Experimental Details
ImageNet Dataset. We collect misclassified train-
ing samples of the top-1 result in the ImageNet
dataset to edit the attention map and to use for fine-
tuning. We edit the attention maps of 100 categories
with lower classification performance to evaluate the
improvement and randomly selected ten categories
among them. The number of edited attention maps
was 30,917, and editing was performed by 43 users.
During fine-tuning, we compare two training perfor-
mances: training only ten categories and training all
100 categories of the edited attention maps.
Our baseline models are ResNet-18, ResNet-
34, ResNet-50, and ResNet-152 that includes a
SENet (Hu et al., 2018). We used the same learning
conditions as (Fukui et al., 2019).
CUB-200-2010 Dataset. The CUB-200-2010
dataset includes attention maps created by the bubble
information for all training samples. Therefore, the
training samples are sorted by their confidence, and
the samples are used for fine-tuning from the lowest
confidence.
Since the CUB-200-2010 dataset has a small num-
ber of samples, it is easy for over-fitting to occur, and
learning from scratch is difficult. For this reason, we
evaluated two learning methods: training from scratch
and fine-tuning the pre-trained model on ImageNet.
These models are trained by SGD with momentum
in 300 epochs. The learning rate is decreased to 0.1
times at 150 and 225 epochs. The mini-batch size is
16.
IDRiD. IDRiD contains 81 diseased images and
120 healthy images based on the existence of hem-
orrhages, hard exudates, and soft exudates. We create
Embedding Human Knowledge into Deep Neural Network via Attention Map
631
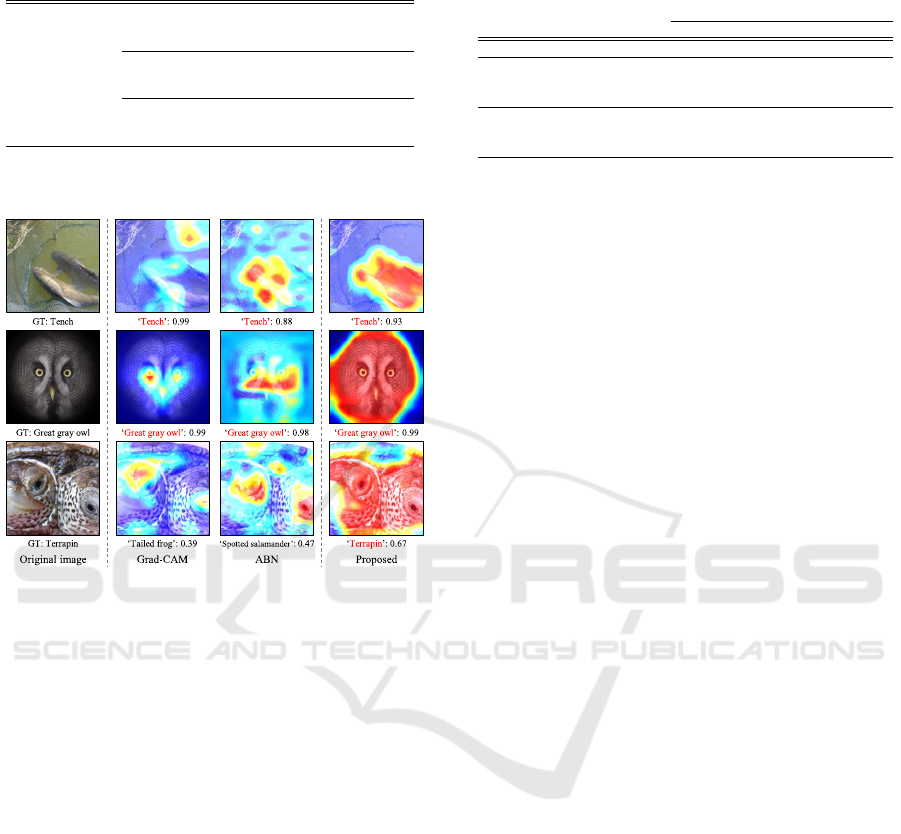
Table 2: Top-1 error rates on ImageNet dataset [%].
No. of categories Model top-1 error
10 random
categories
ResNet-18 9.00
ResNet-34 9.60
ResNet-50 12.00
ResNet-18+ABN 8.40
ResNet-34+ABN 7.60
ResNet-50+ABN 11.20
Proposed (ResNet-18+ABN) 6.20
Proposed (ResNet-34+ABN) 7.40
Proposed (ResNet-50+ABN) 10.80
100 worst
categories
ResNet-152 31.90
ResNet-152+SE+ABN 31.16
Proposed (ResNet-152+SE+ABN) 30.88
Figure 8: Examples of conventional and proposed attention
maps on ImageNet dataset.
the edited attention maps by using semantic segmen-
tation labels annotated by medical doctors. We eval-
uate IDRiD by 5-fold cross validation. Our baseline
models are an AlexNet, ResNet-18, ResNet-34 and
ResNet-50-based CNNs. The networks are trained by
SGD with momentum, and the number of training it-
erations is 9,500 epochs. The batch size is 20 and the
size of each image is 360 × 360 pixels. Data aug-
mentation is as follows: mirroring, intensity change,
scaling, and rotation.
Quantitative Evaluation of Attention Map. In or-
der to quantitatively evaluate the explainability of the
attention map, we employ the deletion metric, the in-
sertion metric, and the degree of similarity between
the edited attention map and the attention map out-
put by the network. The deletion and insertion met-
rics are evaluation methods proposed by Petsiuk et al.
(Petsiuk et al., 2018), which are based on the concept
of literature (Fong and Vedaldi, 2017). The deletion
metric measures the decrease of score by gradually
deleting the high attention area of an attention map
from the input image. Therefore, a lower score means
a higher explanation. On the other hand, the insertion
metric measures the increase of score by gradually in-
Table 3: Top-1 and top-5 accuracies on CUB-200-2010
dataset [%].
scratch pre-trained
Model top-1 top-5 top-1 top-5
Deng’s method 32.80 – – –
ResNet-18 28.38 52.62 62.58 83.25
ResNet-34 27.39 53.28 67.59 85.13
ResNet-50 28.02 54.33 69.27 88.39
ResNet-18+ABN 32.38 57.27 63.57 83.45
ResNet-34+ABN 30.99 53.68 68.25 87.73
ResNet-50+ABN 31.68 57.01 71.68 89.09
Proposed (ResNet-18+ABN) 36.96 61.66 64.72 83.71
Proposed (ResNet-34+ABN) 38.15 62.78 69.27 87.88
Proposed (ResNet-50+ABN) 37.42 62.08 72.07 90.37
serting the high attention area of an attention map in
the input image. Therefore, a higher score means a
higher explanation. In the evaluation, the degree of
similarity between the edited attention map and the at-
tention map output by the network is measured by the
mean square error. A higher similarity (i.e., lower er-
ror) means that the attention map focuses on the same
area as the human operator and thus successfully em-
bedded human knowledge.
5.2 Image Classification on ImageNet
We evaluated the classification performance by using
the 100 worst categories and randomly select ten cate-
gories on the ImageNet dataset as in the previous eval-
uation. The accuracies of the conventional ResNet
and the proposed method for ten and 100 categories
are listed in Tab. 2. As shown, the accuracy of the
proposed method is higher than that of the conven-
tional ABN.
The attention maps of the conventional and pro-
posed methods are shown in Fig. 8. The attention map
of the conventional ABN is noisy or focuses on differ-
ent objects, which results in wrong classifications. In
contrast, the proposed method can obtain a clear at-
tention map that highlights the target category object,
thus improving the classification performance.
5.3 Fine-grained Recognition on
CUB-200-2010
We compared the accuracies of Deng et al., the con-
ventional ResNet, and the proposed method for top-1
and top-5 accuracy. The results are shown in Tab. 3.
The performances of the conventional ABN trained
from scratch and the Deng’s method are the same.
By fine-tuning the ABN using an attention map with
human knowledge, the top-1 accuracies are improved
from 4% to 7% in the case of scratch. Also, in the case
of the pre-trained model on ImageNet, the accuracies
are improved by about 1%. Similarly, in the recogni-
tion accuracy of top-5, the recognition rate improved
VISAPP 2021 - 16th International Conference on Computer Vision Theory and Applications
632
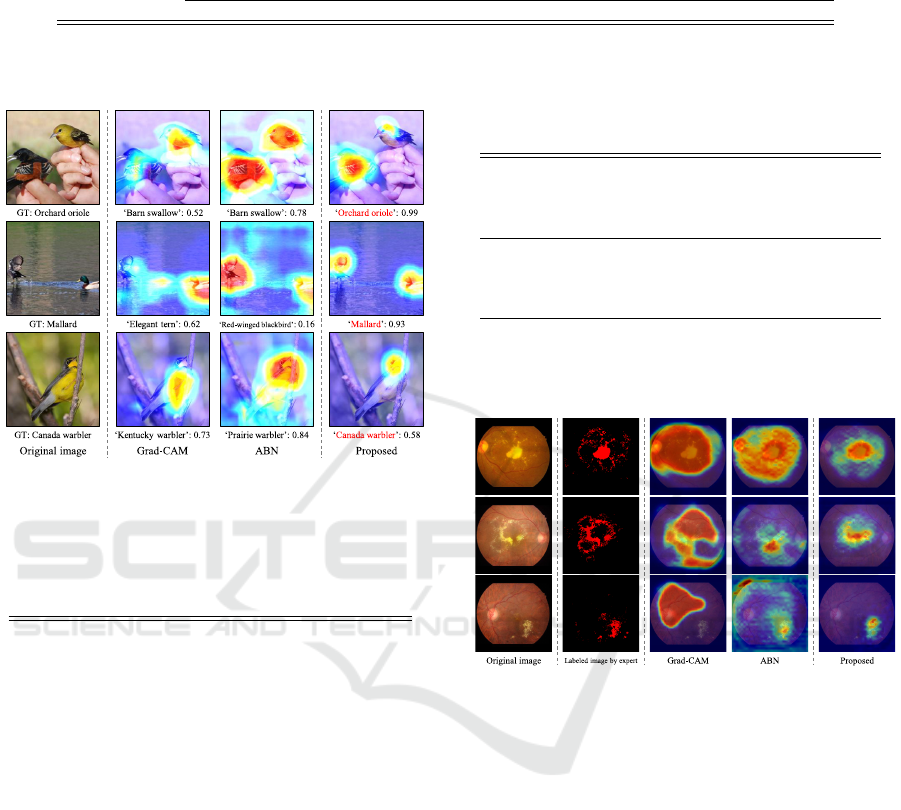
Table 4: Comparison of the deletion (lower is better) and insertion (higher is better) scores of conventional visual explanation
and proposed method on CUB-200-2010 dataset.
ResNet-18 ResNet-34 ResNet-50
Method Deletion Insertion Deletion Insertion Deletion Insertion
Grad-CAM 0.2247 0.2546 0.3147 0.2540 0.3688 0.2378
ABN 0.3146 0.2269 0.2920 0.3596 0.2915 0.4033
Proposed 0.2568 0.3268 0.2609 0.3956 0.2722 0.4575
Figure 9: Examples of conventional and proposed attention
maps on CUB-200-2010 dataset.
Table 5: Comparison of the similarity of the attention map
by mean square error of the conventional visual explanation
and proposed method on CUB-200-2010 dataset.
Method ResNet-18 ResNet-34 ResNet-50
CAM 0.6456 0.7658 0.6031
Grad-CAM 0.4502 0.4831 0.3875
ABN 0.1682 0.3022 0.5499
Proposed 0.1136 0.1597 0.2049
from about 4% to 9% in the case of scratch, and about
1% for the pre-trained model on ImageNet.
Examples of the obtained attention map on the
fine-grained recognition are shown in Fig. 9. The con-
ventional ABN highlights the entire body of the bird.
In contrast, the proposed method highlights the local
characteristic regions, such as the color and the head
of the bird. In addition, the proposed method removes
noise from the attention map by fine-tuning. Thus, the
proposed method can also improve the performance
of fine-grained recognition.
For the quantitative evaluation on the explainabil-
ity of the attention map, we show the deletion (lower
is better) and insertion (higher is better) scores of
the conventional and proposed methods for test sam-
ples of CUB-200-2010 dataset in Tab. 4. As shown,
the proposed method has higher scores than the other
methods. In other words, the proposed method pro-
vides the clearest visual explanation of all the meth-
ods.
Table 6: Comparison of the accuracy on IDRiD [%].
Model Accuracy
AlexNet 89.66
ResNet-18 89.78
ResNet-34 94.44
ResNet-50 95.83
AlexNet+ABN 93.11
ResNet-18+ABN 95.33
ResNet-34+ABN 96.88
ResNet-50+ABN 97.22
Proposed (AlexNet+ABN) 96.78
Proposed (ResNet-18+ABN) 96.88
Proposed (ResNet-34+ABN) 97.23
Proposed (ResNet-50+ABN) 99.17
Figure 10: Examples of conventional and proposed atten-
tion maps on IDRiD.
In Table 5, we compare the degree of similarity
between the attention maps output by the conven-
tional visual explanation method and the proposed
method and the attention maps created by bubble
information. As shown in the table, the proposed
method outputs the attention map that is closest to the
one created by the bubble information. These results
demonstrate that the proposed method can success-
fully embed human knowledge and output an atten-
tion map that contains this knowledge.
5.4 Fundus Image Classification on
IDRiD
Table 6 shows the classification accuracies on
IDRiD. As shown, the ABN-based networks (e.g.,
AlexNet+ABN, ResNet∗+ABN) achieved higher
classification performances than the original net-
works. Moreover, the classification performances are
Embedding Human Knowledge into Deep Neural Network via Attention Map
633
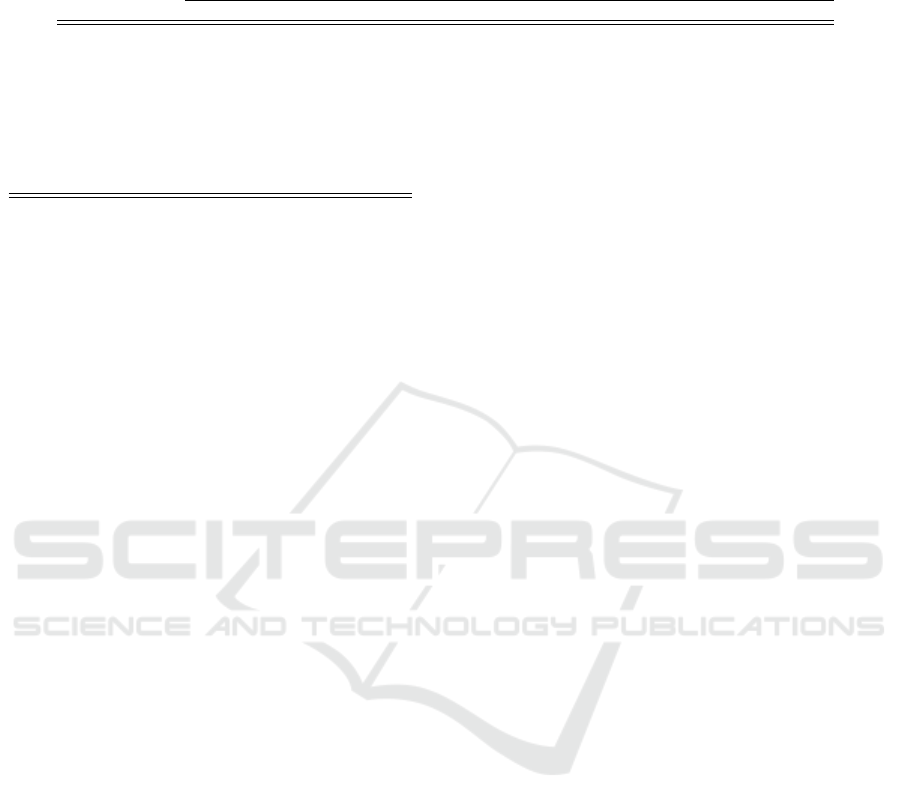
Table 7: Comparison of the deletion (lower is better) and insertion (higher is better) scores of the conventional visual expla-
nation and the proposed method on IDRiD.
ResNet-18 ResNet-34 ResNet-50
Method Deletion Insertion Deletion Insertion Deletion Insertion
Grad-CAM 0.6296 0.3307 0.5979 0.4286 0.4841 0.3307
ABN 0.5741 0.8016 0.5556 0.8307 0.5503 0.8175
Proposed 0.5132 0.9153 0.5132 0.9233 0.5000 0.9259
Table 8: Comparison of the similarity of the attention map
by mean square error of the conventional visual explanation
and proposed method on IDRiD.
Method ResNet-18 ResNet-34 ResNet-50
CAM 0.3749 0.3300 0.2287
Grad-CAM 0.1521 0.1329 0.1532
ABN 0.1241 0.1309 0.1286
Proposed 0.0893 0.0927 0.0904
further improved by introducing the proposed fine-
tuning method.
Figure 10 shows examples of the resultant atten-
tion maps. In the case of the conventional Grad-CAM,
the attention maps broadly highlight both disease and
non-disease regions. Also, the conventional ABN fo-
cuses on the non-disease regions around the disease
regions. In contrast, the proposed method suppresses
the highlighting for non-disease regions and focuses
only on disease regions.
We evaluate the obtained attention maps quantita-
tively. Tables 7 and 8 show that deletion and insertion
scores and the similarity of the attention maps, respec-
tively. As shown in the Table 7, the proposed method
has higher insertion scores than the other methods. As
shown in the Table 8, the proposed method outputs
the attention map that is closest to the one edited by
a segmentation label of disease regions annotated by
a specialist. These results demonstrate that the pro-
posed method is effective for fundus image recogni-
tion, where it is difficult to collect a large amount of
training data, and that the interpretability of the atten-
tion map can be improved.
6 CONCLUSION
We proposed an approach to embed human knowl-
edge into deep learning models by fine-tuning the net-
work with a manually edited attention map. Specif-
ically, the proposed method fine-tunes the ABN by
calculating the training loss between the output at-
tention map and the edited attention map. By fine-
tuning using a manually edited attention map by a hu-
man expert, we can embed human knowledge into the
network and obtain an appropriate attention map for
better visual explanation. Moreover, by introducing
human knowledge to the attention map, classification
performance is improved. Experimental results with
ImageNet, CUB-200-2010, and IDRiD showed that
the proposed method improved the classification ac-
curacies. Our evaluation of the attention maps showed
that the proposed method obtained better deletion and
insertion scores than conventional methods. More-
over, the similarity score results show that the pro-
posed method can provides attention maps that are
similar to the edited by a human expert. Conse-
quently, our method can generate a more interpretable
attention map and successfully embed human knowl-
edge. Our future work will include further improve-
ment of the performance by editing attention maps
with multi-resolution.
ACKNOWLEDGEMENTS
This paper is based on results obtained from a
project, JPNP20006, commissioned by the New En-
ergy and Industrial Technology Development Organi-
zation (NEDO).
REFERENCES
Bahdanau, D., Cho, K., and Bengio, Y. (2016). Neural ma-
chine translation by jointly learning to align and trans-
late. In International Conference on Learning Repre-
sentations.
Branson, S., Perona, P., and Belongie, S. (2011). Strong
supervision from weak annotation: Interactive train-
ing of deformable part models. In 2011 International
Conference on Computer Vision, pages 1832–1839.
Branson, S., Wah, C., Schroff, F., Babenko, B., Welinder, P.,
Perona, P., and Belongie, S. (2010). Visual recogni-
tion with humans in the loop. In European Conference
on Computer Vision, pages 438–451.
Chattopadhay, A., Sarkar, A., Howlader, P., and Balasub-
ramanian, V. N. (2018). Grad-CAM++: Generalized
gradient-based visual explanations for deep convolu-
tional networks. In 2018 IEEE Winter Conference on
Applications of Computer Vision, pages 839–847.
Deng, J., Dong, W., Socher, R., Li, L.-J., Li, K., and Fei-
Fei, L. (2009). Imagenet: A large-scale hierarchical
image database. In 2009 IEEE Conference on Com-
puter Vision and Pattern Recognition, pages 248–255.
Deng, J., Krause, J., and Fei-Fei, L. (2013). Fine-grained
crowdsourcing for fine-grained recognition. In 2013
VISAPP 2021 - 16th International Conference on Computer Vision Theory and Applications
634

IEEE Conference on Computer Vision and Pattern
Recognition, pages 580–587.
Duan, K., Parikh, D., Crandall, D., and Grauman, K.
(2012). Discovering localized attributes for fine-
grained recognition. In 2012 IEEE Conference on
Computer Vision and Pattern Recognition, pages
3474–3481.
Fong, R. C. and Vedaldi, A. (2017). Interpretable explana-
tions of black boxes by meaningful perturbation. In
2017 IEEE International Conference on Computer Vi-
sion, pages 3429–3437.
Fukui, H., Hirakawa, T., Yamashita, T., and Fujiyoshi, H.
(2019). Attention branch network: Learning of atten-
tion mechanism for visual explanation. In 2019 IEEE
Conference on Computer Vision and Pattern Recogni-
tion, pages 10705–10714.
He, K., Zhang, X., Ren, S., and Sun, J. (2016). Deep resid-
ual learning for image recognition. In 2016 IEEE Con-
ference on Computer Vision and Pattern Recognition,
pages 770–778.
Hu, J., Shen, L., and Sun, G. (2018). Squeeze-and-
excitation networks. In 2018 IEEE Conference
on Computer Vision and Pattern Recognition, pages
7132–7141.
Jeffrey, De, F., Joseph, R., L., Bernardino, R.-P., Stanislav,
N., Nenad, T., Sam, B., Harry, A., Xavier, G., Bren-
dan, O., Daniel, V., George, van, d. D., Balaji, L.,
Clemens, M., Faith, M., Simon, B., Kareem, A.,
Reena, C., Dominic, K., Alan, K., C
´
ıan, O., H., Ros-
alind, R., Julian, H., Dawn, A., S., Catherine, E., Ad-
nan, T., Hugh, M., Demis, H., Geraint, R., Trevor, B.,
Peng, T., K., Mustafa, S., Julien, C., Pearse, A., K.,
and Olaf, R. (2018). Clinically applicable deep learn-
ing for diagnosis and referral in retinal disease. Nature
Medicine, (24):1342–1350.
Jetley, S., Lord, N. A., Lee, N., and Torr, P. (2018). Learn to
pay attention. In International Conference on Learn-
ing Representations.
Kelvin, X., Jimmy, B., Ryan, K., Kyunghyun, C., Aaron, C.,
Ruslan, S., Rich, Z., and Yoshua, B. (2015). Show, at-
tend and tell: Neural image caption generation with
visual attention. In International Conference on Ma-
chine Learning, pages 2048–2057.
LeCun, Y., Boser, B., Denker, J. S., Henderson, D., Howard,
R. E., Hubbard, W., and Jackel, L. D. (1989). Back-
propagation applied to handwritten zip code recogni-
tion. Neural Computation, 1(4):541–551.
Lin, M., Chen, Q., and Yan, S. (2014). Network in network.
In 2nd International Conference on Learning Rep-
resentations, Banff, AB, Canada, April 14-16, 2014,
Conference Track Proceedings.
Linsley, D., Shiebler, D., Eberhardt, S., and Serre, T. (2019).
Learning what and where to attend with humans in the
loop. In International Conference on Learning Repre-
sentations.
Luong, T., Pham, H., and Manning, C. D. (2015). Effective
approaches to attention-based neural machine transla-
tion. In Empirical Methods in Natural Language Pro-
cessing, pages 1412–1421.
Mnih, V., Heess, N., Graves, A., and kavukcuoglu, k.
(2014). Recurrent models of visual attention. In
Neural Information Processing Systems, pages 2204–
2212.
Montavon, G., Samek, W., and M
¨
uller, K.-R. (2018). Meth-
ods for interpreting and understanding deep neural
networks. Digital Signal Processing, 73:1–15.
Parikh, D. and Grauman, K. (2011). Interactively building
a discriminative vocabulary of nameable attributes. In
2011 IEEE Conference on Computer Vision and Pat-
tern Recognition, pages 1681–1688.
Parkash, A. and Parikh, D. (2012). Attributes for classi-
fier feedback. In European Conference on Computer
Vision, pages 354–368.
Petsiuk, V., Das, A., and Saenko, K. (2018). Rise: Ran-
domized input sampling for explanation of black-box
models. In British Machine Vision Conference.
Porwal, P., Pachade, S., Kamble, R., Kokare, M., Desh-
mukh, G., Sahasrabuddhe, V., and Meriaudeau, F.
(2018). Indian diabetic retinopathy image dataset
(idrid): A database for diabetic retinopathy screening
research. Data, 3:25.
Quattoni, A., Wang, S., Morency, L.-P., Collins, M., and
Darrell, T. (2007). Hidden conditional random fields.
IEEE Transactions on Pattern Analysis & Machine In-
telligence, (10):1848–1852.
Ramprasaath, R., S., Michael, C., Abhishek, D., Ramakr-
ishna, V., Devi, P., and Dhruv, B. (2017). Grad-CAM:
Visual explanations from deep networks via gradient-
based localization. In International Conference on
Computer Vision, pages 618–626.
Ribeiro, M. T., Singh, S., and Guestrin, C. (2016). Why
should I trust you?: Explaining the predictions of any
classifier. In 22nd ACM SIGKDD International Con-
ference on Knowledge Discovery and Data Mining,
pages 1135–1144.
Ryan, P., Avinash, V., V., Katy, B., Yun, L., Michael, V., M.,
Greg, S., C., Lily, P., and Dale, R., W. (2018). Pre-
diction of cardiovascular risk factors from retinal fun-
dus photographs via deep learning. Nature Biomedical
Engineering, (2):158–164.
Smilkov, D., Thorat, N., Kim, B., Vi
´
egas, F., and Watten-
berg, M. (2017). Smoothgrad: removing noise by
adding noise. arXiv preprint arXiv:1706.03825.
Springenberg, J. T., Dosovitskiy, A., Brox, T., and Ried-
miller, M. A. (2015). Striving for simplicity: The
all convolutional net. In International Conference on
Learning Representations.
Vaswani, A., Shazeer, N., Parmar, N., Uszkoreit, J., Jones,
L., Gomez, A. N., Kaiser, Ł., and Polosukhin, I.
(2017). Attention is all you need. In Advances in
Neural Information Processing Systems, pages 5998–
6008.
Wang, F., Jiang, M., Qian, C., Yang, S., Li, C., Zhang, H.,
Wang, X., and Tang, X. (2017). Residual attention
network for image classification. In 2017 IEEE Con-
ference on Computer Vision and Pattern Recognition,
pages 3156–3164.
Wang, X., Girshick, R., Gupta, A., and He, K. (2018).
Non-local neural networks. In 2018 IEEE Conference
Embedding Human Knowledge into Deep Neural Network via Attention Map
635

on Computer Vision and Pattern Recognition, pages
7794–7803.
Welinder, P., Branson, S., Mita, T., Wah, C., Schroff, F.,
Belongie, S., and Perona, P. (2010). Caltech-UCSD
Birds 200. Technical Report CNS-TR-2010-001, Cal-
ifornia Institute of Technology.
Woo, S., Park, J., Lee, J.-Y., and So Kweon, I. (2018).
Cbam: Convolutional block attention module. In Eu-
ropean Conference on Computer Vision, pages 3–19.
Yang, Z., He, X., Gao, J., Deng, L., and Smola, A. (2016).
Stacked attention networks for image question an-
swering. In 2016 IEEE Conference on Computer Vi-
sion and Pattern Recognition, pages 21–29.
You, Q., Jin, H., Wang, Z., Fang, C., and Luo, J. (2016). Im-
age captioning with semantic attention. In 2016 IEEE
Conference on Computer Vision and Pattern Recogni-
tion, pages 4651–4659.
Zeiler, M. D. and Fergus, R. (2014). Visualizing and under-
standing convolutional networks. In European Con-
ference on Computer Vision, pages 818–833.
Zhou, B., Khosla, A., Lapedriza, A., Oliva, A., and Tor-
ralba, A. (2016). Learning deep features for discrimi-
native localization. In 2016 IEEE Conference on Com-
puter Vision and Pattern Recognition, pages 2921–
2929.
VISAPP 2021 - 16th International Conference on Computer Vision Theory and Applications
636
