
Smartphone-based Approach for Automatic Focus Assessment in NIR
Fundus Images Targeted at Handheld Devices
Tudor-Ionut Nedelcu
a
, Francisco Veiga
b
, Miguel Santos
c
, Marcos Liberal
d
and Filipe Soares
e
Fraunhofer Portugal AICOS, Rua Alfredo Allen 455/461, 4200-135 Porto, Portugal
Keywords:
Retina, Smartphone, Image Acquisition, Autofocus, Feature Extraction, Machine Learning.
Abstract:
Mobile fundus imaging devices can play an important role in the decentralization of eye diseases screening
methods, increasing the accessibility of telemedicine solutions in this area. Since image focusing is crucial to
obtain an optimal retinal image, this work presents a smartphone-based approach for automatic focus assess-
ment of NIR retinal images, acquired by a prototype of a handheld fundus camera device called EyeFundusS-
cope (EFS) A009. A DCT-based focus metric is proposed and compared against a group of Gradient-based,
Statistical-based, and Laplacian-based functions in the same experimental setup. The paper also presents the
EFS image acquisition logic and the protocol for creating the necessary NIR dataset with the optic disc region
around the centre of the image. The results were obtained within 853 images acquired from 8 volunteers. The
developed method combined with other features, and a SVM classifier in a Machine Learning approach which
attained an AUC of 0.80, has shown to be a viable solution to integrate into the EFS mobile application.
1 INTRODUCTION
Globally, it is estimated that approximately 1.3 bil-
lion people live with some form of vision impairment.
As the prevalence of diseases that affect the eyes
is expected to increase, more and more people will
have potentially blinding conditions (WHO, 2019).
Glaucoma and Diabetic Retinopathy are emerging
causes of visual problems and represent around 14%
of the total cases of blindness in the world. For both
diseases, early diagnosis and treatment are essential
for slowing their progression and prevent irreversible
damage, which makes fundus imaging extremely im-
portant (Rani et al., 2018). Despite the current aware-
ness on the importance of regular examinations, many
patients do not have the possibility to have a frequent
follow-up due to the high-cost of the equipment and
shortage of trained personnel, making it difficult to
distribute them in isolated and less developed areas.
Retinal cameras can be mydriatic or non-
mydriatic. Mydriatic cameras require pharmacolog-
ical eye dilation which can bring burdensome side
effects to allow wide-field photographs of the ocu-
a
https://orcid.org/0000-0002-2047-2254
b
https://orcid.org/0000-0001-6118-2600
c
https://orcid.org/0000-0001-8994-5104
d
https://orcid.org/0000-0002-8727-2636
e
https://orcid.org/0000-0002-2881-313X
lar fundus (P
´
erez et al., 2012). On the other hand,
non-mydriatic cameras use near-infrared (NIR) illu-
mination systems to exploit patient’s natural dilation
in ambients with low light levels. Usually, NIR illu-
mination is used to preview the retina on the device
screen, and, once the monitor’s image is focused and
aligned, a flash of visible light is enabled for the im-
age capture moment.
Recent technological developments have enabled
use of smartphones in designing small-sized and af-
fordable biomedical imaging devices, since they can
perform imaging, processing, and wireless commu-
nication tasks. Thus, the creation of mobile retinal
screening devices can play a fundamental role in over-
coming these barriers allowing the feasibility of oph-
thalmological telemedicine solutions (Karakaya and
Hacisoftaoglu, 2020). In this way, the EyeFundusS-
cope (EFS) A009 is a non-mydriatic handheld fundus
camera prototype that consists of a mobile device that
can illuminate the human eye fundus and captures im-
ages of it through a smartphone camera (Melo et al.,
2019). The illumination of the device consists of a
NIR system that is used during the alignment of the
prototype with the eye, being useful for the examiner
guidance, and a white visible system that is used in a
short period of time, during the final moment of image
acquisition (Melo et al., 2018). The NIR illumination
is useful to ensure the mentioned non-mydriatic ac-
Nedelcu, T., Veiga, F., Santos, M., Liberal, M. and Soares, F.
Smartphone-based Approach for Automatic Focus Assessment in NIR Fundus Images Targeted at Handheld Devices.
DOI: 10.5220/0010325100730081
In Proceedings of the 14th International Joint Conference on Biomedical Engineering Systems and Technologies (BIOSTEC 2021) - Volume 2: BIOIMAGING, pages 73-81
ISBN: 978-989-758-490-9
Copyright
c
2021 by SCITEPRESS – Science and Technology Publications, Lda. All rights reserved
73

quisition, since this wavelength light is not perceived
by the human eye, and therefore, does not lead to a
decrease of the pupil size (Toslak et al., 2018).
Regarding image focusing process, retinal cam-
eras can be equipped with a mechanical focusing
system that consists in displacing a compensation
lens that, when combined with the optics of the eye,
matches the image plane to the retina. This focus con-
trol mechanism is conceived to compensate for possi-
ble refractive errors in subject’s eyes (which can be
different for each eye). The EFS presents in its opti-
cal system an aspheric objective lens that minimizes
dioptre errors and the level of optical aberrations pro-
duced in the retinal image (Melo et al., 2018). How-
ever, this manual focusing process is error prone, es-
pecially when performed by inexperienced examin-
ers operating a handheld device, and may lead to sub-
optimal images which is not desirable for eye screen-
ing purposes.
This work presents an automatic focus assessment
approach for non-mydriatic NIR fundus images that
can be executed by a smartphone on a handheld de-
vice. Our method allows the system to find the best
focus value based on the NIR preview images during
the manual alignment step, optimising the retinal im-
age quality at the moment of image capture.
We will also present an extensive comparative
analysis of focus features and measures, proposing a
new DCT-based function against a group of Gradient-
based, Statistical-based and Laplacian-based func-
tions in the same experimental setup. The first ap-
proach consisted of a discriminative analysis of all
metrics performance and later, the authors decided to
observe the impact of the implementation of Machine
Learning models in the analysis, trying to take into
account the balance between performance and com-
putational processing time.
This paper is structured as follows: Section 1
presents the motivation and objectives of this work;
Section 2 summarizes the related work and applica-
tions found on the literature; Section 3 provides an
overview of the system architecture including the data
collection, followed by the methodologies studied for
the retinal focus assessment; in Section 4, the results
and discussion are presented; and finally, the conclu-
sions and future work are drawn in Section 5.
2 RELATED WORK
Unlike tabletop retinal cameras, EFS is a handheld
device and despite the help of its image acquisition
logic, it requires a low level of training. Therefore,
our research group developed strategies to maximize
the quality of the acquisition, minimizing reflections
associated with poor alignment of the device and non-
focused images due to errors in manual focus process.
Through the implementation of a flexible eyecup and
an internal luminous fixation system, the examiner
can ask the patient to fix his gaze on a certain point,
stabilizing the acquisition device and making all the
images consistent in terms of imaged area (Soares
et al., 2020). In addition, the authors sought to imple-
ment other strategies that could enable a more robust
imaging system, which is fundamental for medical
screening purposes. Since the native digital camera
applications of state-of-the-art smartphones are not
able to use their automatic focus tool in NIR images,
the team felt the need to create a suitable focus assess-
ment pipeline that will be integrated into a previously
developed EFS mobile application.
To the best of our knowledge, the number of pub-
lished works on autofocusing in retinal imaging is
scarce. In the work of (Moscaritolo et al., 2009), it
is proposed an algorithm to assess optic nerve sharp-
ness with generation of a quantitative index. How-
ever, the authors use images captured with conven-
tional tabletop mydriatic devices in the visible spec-
trum, and does not present an extensive study compar-
ing focus metrics with the same experimental setup.
Regarding automatic focus algorithms for non-
mydriatic retinal imaging with NIR illumination,
(Marrugo et al., 2012) proposes a passive auto-focus
measure based on the directional variance of the nor-
malized discrete cosine transform (DCT). A focusing
window is selected such that there are retinal struc-
tures within for computation of the normalized DCT.
Consequently, a weighted directional sampling on the
normalized DCT is calculated and finally the focus
measure is the variance from all considered direc-
tions. Although a comparative analysis of the results
with other metrics is presented, the data is from table-
top retinal cameras (Marrugo et al., 2014), unlike the
present work that refers to a mobile and handheld
imaging system. The proposed approach performs the
focus score by using the ratio between high and low
frequencies of the DCT image. By using pre-defined
masks, there are avoided regions from the DCT im-
age related to the noise component and others related
with the basic frequencies. In addition, the work aims
to study the impact of feature-based machine learning
with a set of classifiers evaluated in the EFS use case.
BIOIMAGING 2021 - 8th International Conference on Bioimaging
74
Light Control
Turn on
Fixation Point
Enable continuous
NIR LED
White LED flash
EFS Device
Handheld
Alignment
Is best focus
locked?
Focus value
variation
Image Storage
Yes
No
Camera API
Get frame preview
Image capture
Start EFS App
Start
End
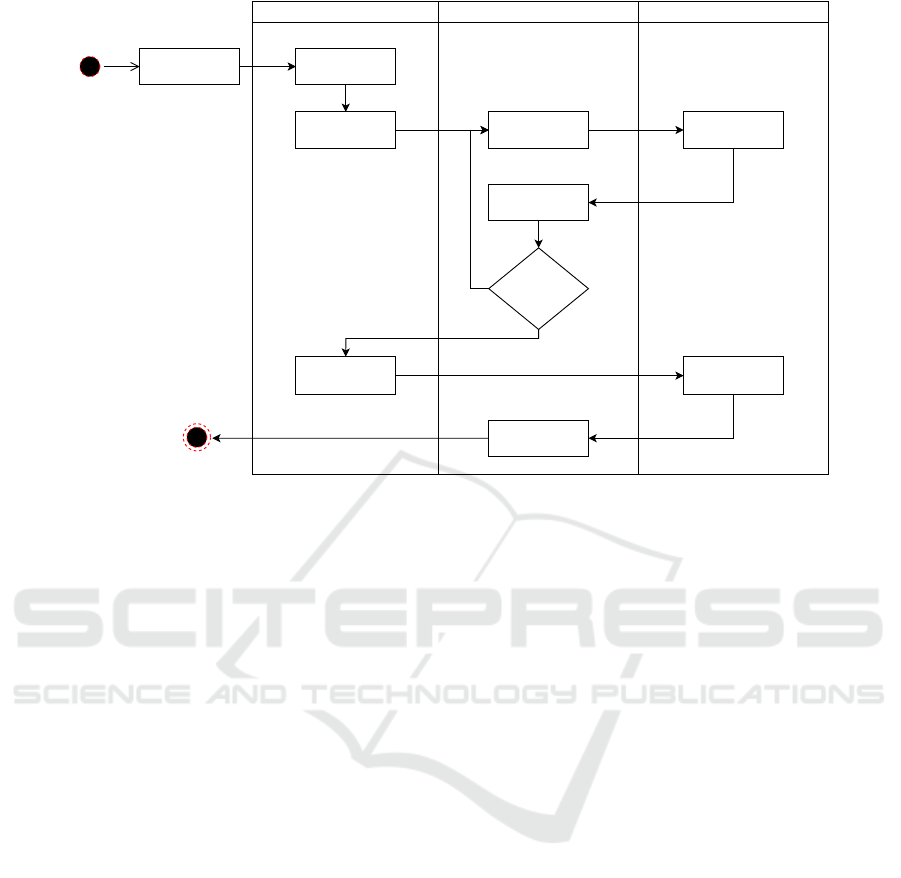
Figure 1: EFS Image Acquisition Logic with focus assessment.
3 METHODOLOGY AND
EXPERIMENTAL SETUP
The proposed software and hardware systems allows
the automatic focus assessment of NIR fundus images
targeted at handheld devices. The architecture of the
developed approach, illustrated in Figure 1, is divided
into three main modules: Light Control, EFS Device
and Camera API. When starting the mobile applica-
tion, the examiner has the possibility to choose a lu-
minous fixation point of his choice to fix the patient’s
eye gaze, which for this use case was the point that
maximized the centrality of the optic disc. After that,
the continuous light from the NIR LED is turned on,
which allows the handheld alignment of the device in
low levels of ambient light, getting several preview
frames of the retina. This induces the system to go
through different focus values under NIR illumina-
tion, a process that ends when the focus assessment
algorithm locks the best one. Finally, a white LED
is turned on, enabling the capture and storage of the
retinal image.
3.1 Data Collection
In order to study multiple approaches to evaluate the
best focus of NIR fundus images captured by the EFS,
a dataset of images with discrete steps of focus vari-
ation was collected using an Android application. A
session is considered by a set of images acquired from
the same eye, with a variation of focus from an initial
focus distance to a final one. From the entire dataset a
number of 115 sessions were acquired. The dataset
is composed of a total of 853 NIR fundus images
from both eyes of 8 different volunteers (32 years-
old in average, with brown or blue eyes, 50% female,
5 of them wearing glasses that were removed for the
study). The written informed consents were obtained.
The EFS prototype was the only imaging device, in
order to assure overall consistency of the proposed so-
lution. Moreover, the optical focus distance was man-
ually determined by a panel of image quality experts
(see Figure 2) for each acquisition session (one posi-
tive label, among all the focus variation steps).
3.2 Focus Metrics
A set of metrics regarding image focus assessment
were evaluated considering feature extraction meth-
ods, followed by a dimensionality reduction approach
to compute the final score (Table 1). Several measures
are used to reduce the dimension (mean, maximum
value, minimum values, sum of the values, skewness,
kurtosis, standard deviation) for a better usage of the
extracted features. By using feature functions which
were designed based on different principles, we gain
more insight regarding the possible capabilities of an
autofocusing algorithm. A wide range of features and
combined measures were selected in this study to pro-
Smartphone-based Approach for Automatic Focus Assessment in NIR Fundus Images Targeted at Handheld Devices
75
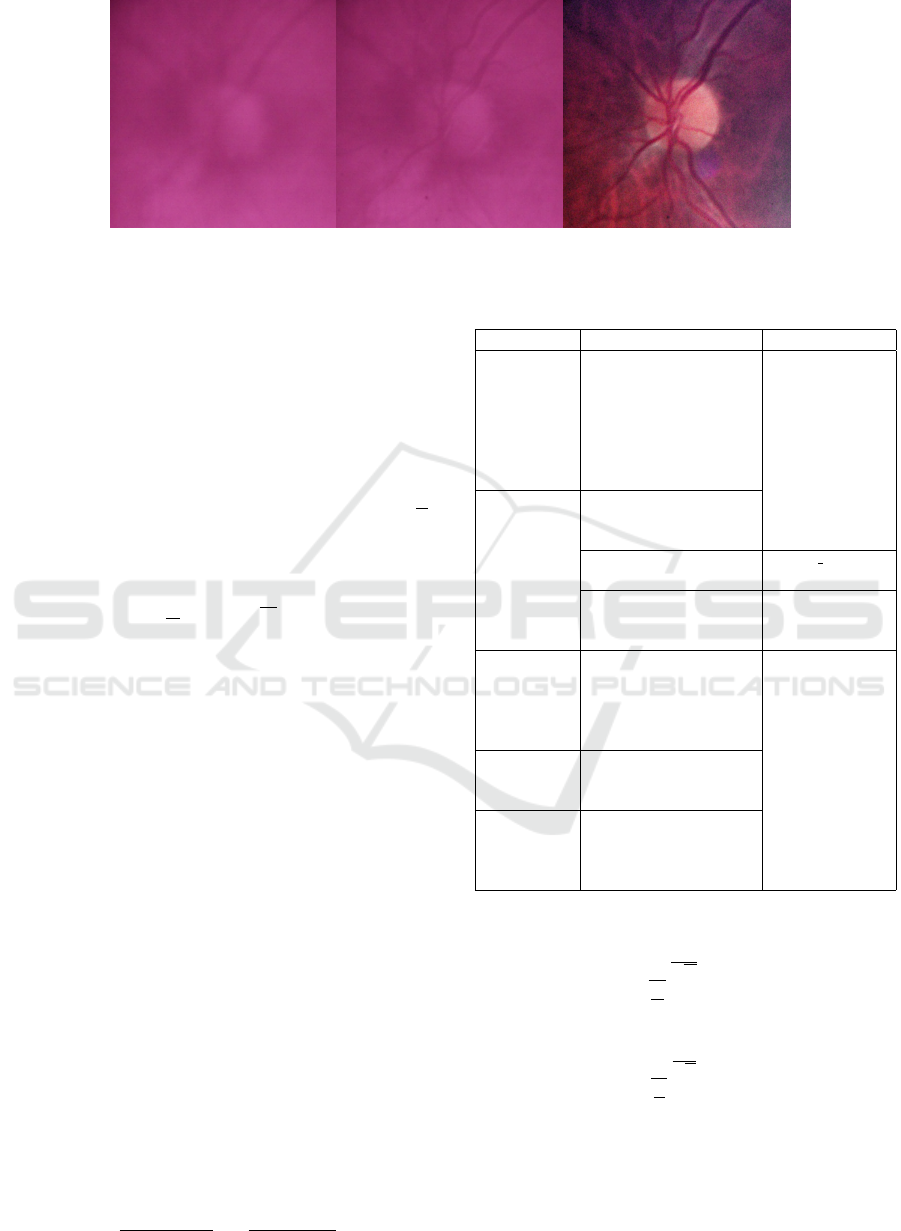
(a) Unfocused NIR. (b) Focused NIR. (c) Captured White.
Figure 2: Examples of images in the dataset.
vide a better overview of the focusing performances,
in the present use case of low contrast NIR images.
For each score computed using the feature metrics
in Table 1 and the one proposed in Section 3.3, the
focus distance is predicted by selecting the minimum
or maximum values within a session. Since the iden-
tification of the exact focus distance is a challenging
task, in this work it is also evaluated the mean squared
error (MSE) based on the computed focus distance.
Considering f the ground-truth focus distance and f
the computed value, the MSE score s for the dataset
is computed as:
s =
1
N
N
∑
n=0
( f
n
− f
n
)
2
, (1)
where N = 115 represents the number of sessions.
3.3 DCT-HLM Presentation and Mean
Square Error Strategy
The proposed metric is based on a DCT ratio of high
and low frequencies, and the authors call it DCT-
HLM (High and Low Masks). Instead of applying
the algorithm over the entire image, to provide a fast
and reliable metric due to lower optical quality at the
edges of the illuminated field-of-view, the DCT-HLM
is applied in a small region of interest (ROI) (Figure
3a). From the initial preview NIR image with the di-
mensions of 640 by 480 pixels, a ROI is centred in the
middle of the image and cropped for 200 by 200 pix-
els. The optic disc is usually centred due to the afore-
mentioned fixation points feature and only the blue
channel is used. Over this image I (with the width
and length M = N = 200) the DCT transform is ap-
plied:
D
pq
= α
p
α
q
M−1
∑
m=0
N−1
∑
n=0
I
mn
·
cos
π(2m + 1)p
2M
cos
π(2n + 1)q
2N
,
(2)
Table 1: Summary of focus functions and measures.
Group Feature function Measure
Brenner Function
Gaussian Derivative
Gradient- Squared Gradient mean, std, min
based Thresholded Absolute Grad max, sum, L2norm
Gradient Energy skew, kurt
Tenenbaum Grad
Tenenbaum Grad Variance
Variance
Normalized Variance
Statistics Histogram Entropy entropy b
-based
Vollath’s F4 mean, std, min
Vollath’s F5 max, sum, L1norm
L2norm, skew, kurt
Modified Laplacian
Laplacian- Energy of Laplacian
based Diagonal Laplacian
Variance of Laplacian
Laplacian Filter
DCT Energy Ratio mean, std, min
DCT-based DCT Reduced Energy Ratio max, sum, L2norm
Modified DCT skew, kurt
Image Curvature
Miscellaneous Spatial Frequency
Image Contrast
Helmli & Scheres Mean
where
α
p
=
(
1
√
M
, p = 0
q
2
M
, 1 ≤ p ≤ M −1
(3)
and
α
q
=
(
1
√
N
, q = 0
q
2
N
, 1 ≤q ≤ N −1
(4)
Over the image in DCT domain D, the absolute values
are computed:
D
a
= |D| (5)
To compute the ratio of high and low frequencies,
specialised masks are used (M
h
and M
l
). In Figure 4
BIOIMAGING 2021 - 8th International Conference on Bioimaging
76

(a) Image ROI. (b) DCT representation.
Figure 3: Image ROI (a) and DCT representation (b).
(a) Low frequency
mask.
(b) High frequency
mask.
Figure 4: Low (a) and high (b) DCT masks used to compute
the metric score.
the masks for high and low coefficients of image in
the DCT domain are presented.
The metric score s is computed as the ratio of DCT
low frequency component over the high frequency
one:
s =
∑
M−1
m=0
∑
N−1
n=0
D
a
M
l
∑
M−1
m=0
∑
N−1
n=0
D
a
M
h
(6)
where M and N represents the image dimensions of
the cropped image (M = N = 200), and () is the
element-wise product.
Since it is desirable to obtain a sharp image re-
gardless of the existing noise, the ratio of the high and
low frequencies is used, eliminating the top and bot-
tom frequencies (see masks in Figure 4). By remov-
ing the last lines and columns from the high frequency
mask, the noise related components are omitted while
keeping most of the information related to that spe-
cific frequency. A similar procedure is adopted to re-
move the base frequencies for the mask of low fre-
quencies.
The DCT-HLM focus metric in Equation 6 was
tested multiple times with sets of 500 previews, re-
sulting in an average computational time of 0.0034
seconds running in a Smartphone Galaxy S8 (G950F)
with a Octa-core CPU (4x2.3 GHz Mongoose M2 &
4x1.7 GHz Cortex-A53).
3.4 Study of Discriminatory Metrics
with Optimal Threshold
Most of the focus functions found in the literature
(Pertuz et al., 2013), the higher the value of the focus
metric the more focused the image is. To understand
the discriminatory ability of a single metric, we could
specify a threshold or cut-off probability at which an
image is classified as focused or unfocused. The se-
lection of a threshold can have a dramatic effect on a
focus metric Accuracy.
The selection of an optimal threshold for each fo-
cus metric was performed by using the optimal thresh-
old module of the Image Focus Assessment (IFA)
component developed at Fraunhofer Portugal. The
IFA component is composed by two modules: the fea-
ture extraction and the optimal threshold module. The
feature extraction module, given a set of images, ex-
tracts the focus metrics values of each of the focus
functions (see Table 1), outputting a dataset where
the features are these focus metrics values. The op-
timal threshold module was based on an open source
R package (Freeman and Moisen, 2008) and, given
the dataset outputed by the feature extraction module,
it determines the discriminatory ability of the focus
metrics by finding the optimal threshold for each of
the metrics.
Having the collected data as described in Section
3.1, we used the IFA component to find the most dis-
criminatory metrics, following the steps enumerated
below:
1. Dataset Creation: The feature extraction module
was used to create the dataset of the focus metrics
of the focused and unfocused images. One of the
options chosen when producing the dataset was to
output the normalized values of the focus metrics,
using the Scaling normalization. This is impor-
tant because for the next steps the values of the
features must be normalized between 0 and 1.
2. Dataset Split: The dataset was split into train and
test samples by a ratio of 70/30 (see Table 2). This
step is important to validate the optimal threshold
found for each metric. Also, the same train and
test data was used in Section 3.5 to have a more
accurate comparison between methods.
3. Find the Optimal Threshold: There are multi-
ple criteria by which we can calculate the opti-
mal threshold (e.g. to maximize the Area Under
the ROC curve (ROC-AUC), to define minimum
Sensitivity or Specificity, to find the best sum of
Sensitivity and Specificity). After testing differ-
ent criteria, the one which yield better results in
test data was to set the minimum Sensitivity as
0.7, which allows to find the optimal threshold
that meets that requirement (e.g find the highest
specificity while meeting the required sensitivity).
4. Produce Tables and Plots: To summarize the
process of finding the most discriminatory met-
rics, the optimal threshold module outputs a table
Smartphone-based Approach for Automatic Focus Assessment in NIR Fundus Images Targeted at Handheld Devices
77

with the performance metrics for each of the focus
metrics (see Table 3) and plots: bar plot of the ob-
served values as predicted probability, ROC plot,
Error Rate vs Threshold (e.g. bar plot Figure 5).
Table 2: Distribution of train/test datasets with a 70/30 split.
Dataset
Focused
Images
Non Focused
Images
Total
Train 80 517 597
Test 35 221 256
Total 115 738 853
As mentioned previously, for most of the focus
function in the literature the higher the value of the
metric, the more focused the image is. In these cases
after normalizing the focus metrics values, a perfectly
focused image would have a value of 1 and a perfectly
unfocused image would have a value of 0. However,
this is not always the case since there are some met-
rics that the distribution of the data does not follow
this pattern. In these situations we create a symmetric
representation of the data.
A focus metric with a good discriminatory power
will have all or most of its focused values close to
the extremes. Otherwise, it means that this metric by
itself does not discriminate well. A good indicator
that it does, is when all of the optimised thresholds
fall into the center of the double humped histogram
(see Figure 5).
Figure 5: Example of a focus metric where the optimized
threshold falls near the center (see mark) of the double
humped histogram.
3.5 Evaluation with Machine Learning
In order to train a model that correctly predicts if an
image is focused or unfocused, one must find and op-
timise an appropriate machine learning pipeline. For
instance, feature engineering and model parameter
tuning are some of the most time consuming tasks
when developing machine learning and usually re-
quire some expertise.
In this work, the selection and optimisation of
the machine learning pipeline was performed using
a Feature-based Machine Learning (FbML) frame-
work introduced by (Gonc¸alves et al., 2019). This
framework enables fast exploration of machine learn-
ing models and has an optimisation tool which in-
cludes features such as search space initialization via
meta-learning (search for similar datasets and ini-
tialize hyper-parameter optimisation algorithm with
the found configuration), data pre-processing (balanc-
ing, imputation of missing values, re-scaling), feature
transformation, and feature and classifier selection.
To find the best machine learning pipeline several
options were explored in the FbML framework:
1. Feature Transformation/Selection: Principal
component analysis (PCA); Univariate Feature
Selection; Classification Based Selection (L1-
regularized Linear SVM); None.
2. Classifiers: K-Nearest Neighbors; Decision
Trees, Random Forest, AdaBoost, Linear and
Non-linear Support Vector Machines.
3. Validation Strategy: 5-Fold Cross Validation.
4. Optimisation Metric: ROC-AUC.
The data used to train and test the model was the
same used in Section 3.4 (see Table 2) plus the pro-
posed DCT-HLM. To evaluate the machine learning
models, k-fold cross-validation was performed. Also,
the resulting model was furthered tested on the test
dataset to ensure the model Accuracy.
4 RESULTS AND DISCUSSION
One may think that the number of subjects in the
present study was small. However, the image ac-
quisition protocol applied with the EFS prototype in-
troduces a natural variability in the acquisitions, be-
cause the examiner (photographer) can achieve a good
alignment with the pupil with slightly different angles
of light incidence. It can also approximately achieve
the centrality of the optic disc while activating the in-
ternal fixation point (that the patient eye should aim
for). This was manually verified for all the images
from all the sessions, as well as the natural variability
of focus.
The MSE presents useful results regarding the
overall performance of each individual focus metric.
The focus functions provided satisfactory predictions
of the focus distance as it can be seen in the initial
results in Figure 6 (the smaller the value, the bet-
ter). The last metric of the plot (number 177) rep-
resents the score of the DCT-HLM. Although the re-
sults are not outstanding, since the DCT-HLM is a
BIOIMAGING 2021 - 8th International Conference on Bioimaging
78
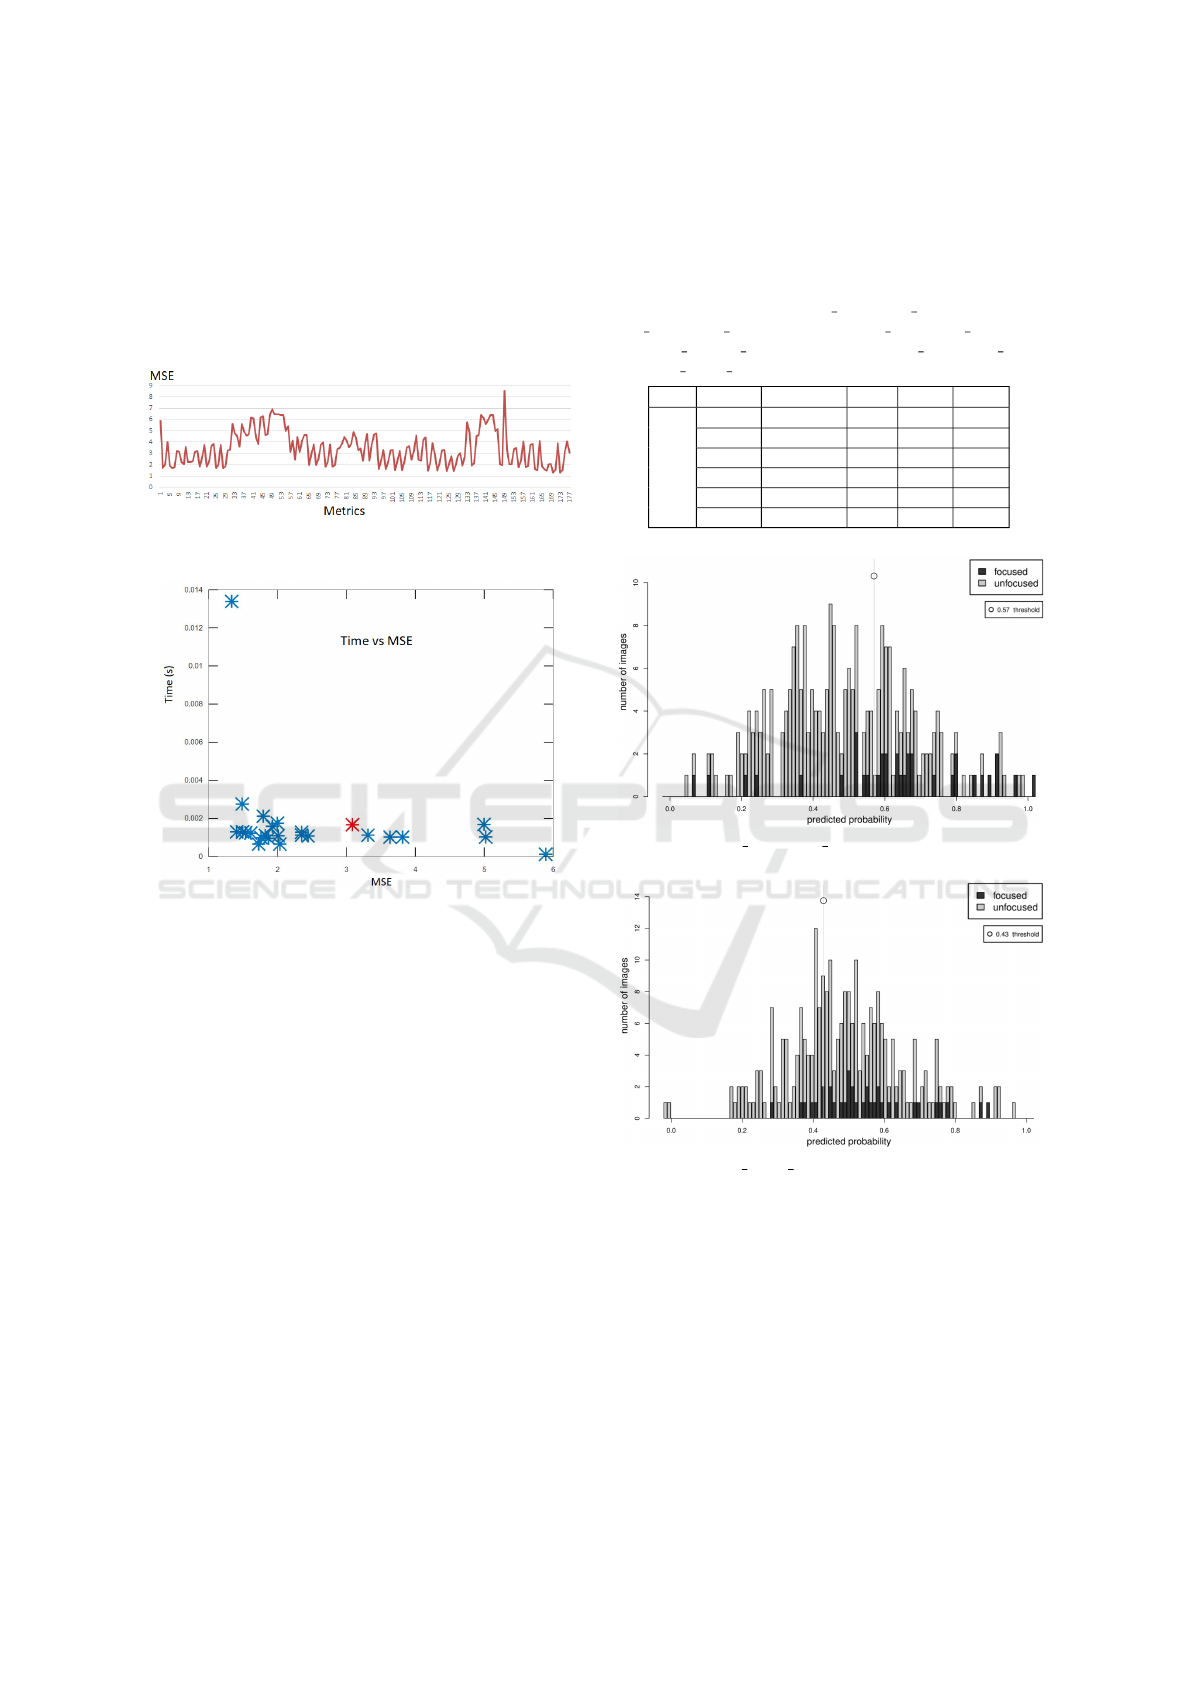
lightweight metric (low complexity) it is able to run
in real time (CPU runtime in a Hexa-core Intel
R
Core
TM
i7-10710U on a laptop: 0.00167 seconds) be-
ing a suitable approach for this problem (Figure 7). In
spite of the Laplacian filter is providing the best MSE
score, we can notice that it requires 0.013 seconds to
process an image being also the slowest of them all.
Figure 6: MSE score of the focus distance prediction of
each individual metric.
Figure 7: MSE score with respect to the computational
time. In red is represented the result for DCT-HLM.
For the task of predicting the exact focus distance,
the Precision usually provides an interesting overview
since it can show the correctly identified focus dis-
tance for each session (considering 115 as the total
number instances). Because the Precision was never
above 40% for each measure individually, the authors
decided to optimise thresholds using the full range of
images and evaluate the impact of adding Machine
Learning to the problem.
As explained before, the MSE offers interesting
information about the performance of the focus func-
tions, regarding the variation between the ground-
truth focus distance and the detected one. In the initial
stage the Laplacian filter with the absolute values of
the sum (LapFiltSUMVALABS) was already provid-
ing the best value of MSE and DCT-HLM was per-
forming reasonably.
For these two specific features, the optimised
thresholds are shown in Figure 8 and Figure 9. As it
can be seen there is a better separation for Laplacian-
based than the DCT-based one. From all the individ-
ual features, a subset of the ones achieving better per-
formance after the threshold optimisation procedure
are shown in Table 3.
Table 3: Top performing features after threshold
optimisation: (1) LapFilt SUMVAL ABS; (2) Lap-
Filt L2NORM ABS; (3) ModDCT SUMVAL ABS; (4)
TenGrad MEAN ABS; (5) BrennFunc SUMVAL ABS;
(6) DCT HLM centred.
Metric Threshold Acc. Sens. Spec.
1 0,57 0,69 0,69 0,69
2 0,49 0,68 0,66 0,69
Test 3 0,47 0,69 0,57 0,71
4 0,47 0,64 0,66 0,64
5 0,41 0,61 0.60 0,62
6 0,43 0,44 0,86 0,37
Figure 8: LapFilt SUMVAL ABS test data Histogram plot.
Figure 9: DCT HLM centred test data Histogram plot.
The top performing models among the multiple
classifier architectures are presented in Table 4, us-
ing the ROC-AUC as optimisation metric and feature
selection. We can see that the SVM was not the best
in the training phase but it generalized well for the
test set, achieving better AUC and higher Sensitiv-
ity than the others. The best performing model was
obtained using the optimization pipeline described in
Section 3.5 with a linear kernel and C=20, using 43
features selected. The computational time need to run
the SVM model was 2.97 ×10
−6
seconds, evaluated
Smartphone-based Approach for Automatic Focus Assessment in NIR Fundus Images Targeted at Handheld Devices
79

in the inference job with the selected test data.
Table 4: Classification results for the two best performing
models for preview NIR image focus assessment.
Model Data Acc. Sens. Spec. AUC
AdaBoost Train 0.94 1 0.93 0.97
Test 0.79 0.71 0.80 0.76
Random Train 0.95 1 0.95 0.97
Forest Test 0.87 0.60 0.91 0.75
Linear Train 0.79 0.86 0.78 0.82
SVM Test 0.77 0.83 0.76 0.80
In the present use case, if the Sensitivity is too low
it may result that not a single frame is selected as well
focused in a given eye session, making the user repeat
the acquisition and hampering the usability of the so-
lution in daily life. For this reason and taking into ac-
count the unbalanced dataset, the authors were firstly
optimising the models for the best possible AUC and
then selecting the one with best Sensitivity (among
the 30 top models of each type of classifier). On the
other hand, the False Positives cases may be not so
critical as long as they are near the unique optimal
distance that was selected by the experts. For this
reason, the authors went to investigate the 52 False
Positives cases provided by the best performing SVM
model and concluded that 87% of them were cases ad-
jacent to the selected ground-truth value of each ses-
sion. Since in general these adjacent values in the fo-
cus variation levels show very close sharpness to the
human expert, the authors consider these as very rel-
evant results.
5 CONCLUSION
Mobile screening devices have the potential to play a
key role in the decentralization of ophthalmological
screening actions, making the range of telemedicine
solutions greater and, consequently, contributing to
the early diagnosis of diseases such as Diabetic
Retinopathy and Glaucoma in underserved areas.
Since manual focusing process is error prone, espe-
cially when performed by inexperienced examiners, it
may lead to unfocused images which is not desirable
for medical screening purposes.
In this paper, a new smartphone-based approach
for automatic focus assessment in NIR fundus images
targeted at handheld devices has been proposed. An
acquisition pipeline was developed and implemented
into the mobile application of a non-mydriatic fundus
camera developed in previous works, the EFS. This
approach allows the device to search for the best fo-
cus value when the examiner is previewing the retinal
image, under NIR illumination.
A new focus measure was presented, DCT-HLM,
which is based on the ratio between high and low
frequency values of the image DCT, by using pre-
computed masks. Despite not having the best score,
the proposed measure is suitable for this use case due
to the short time of computational power that requires.
Besides the proposed method, a second study was per-
formed considering the best performing metrics ex-
tracted by using a machine learning approach. Al-
though this approach can be more time consuming, it
can be performed after a set of images is acquired to
perform the focus assessment. By using a machine
learning approach, namely with SVM classifiers, the
results are improved considerably as described in the
Section 4.
In future work, the outcomes of the top perform-
ing models found in this work, will be verified again
after running the respective classifiers integrated in
the Android application. The balance between com-
putational performance and autofocus performance
will be calibrated. The application front-end may be
adapted to provide highly visual feedback of the fo-
cused retina, as one of the ways to simplify the us-
ability and adoption of EFS prototype by non-experts
in ophthalmology. These developments will be tested
during a pilot study in a private hospital.
ACKNOWLEDGEMENTS
This work was supported by EyeFundusScopeNEO:
Demonstration of EyeFundusScope with Non-Expert
Ophthalmology users, co-funded by Portugal 2020,
framed under the COMPETE 2020 (Operational Pro-
gram Competitiveness and Internationalization) and
European Regional Development Fund from Euro-
pean Union, with operation code POCI-01-0247-
FEDER-038400.
A special acknowledgement to all participants in
the data collection, and to Ruben Moutinho and Cris-
tiana Braga for helping with raw materials used dur-
ing the data collection.
REFERENCES
Freeman, E. A. and Moisen, G. (2008). PresenceAbsence:
An R package for PresenceAbsence analysis. Journal
of Statistical Software, 23(11):1–31.
Gonc¸alves, J., Conceic¸
˜
ao, T., and Soares, F. (2019). Inter-
observer reliability in computer-aided diagnosis of di-
abetic retinopathy. In Proceedings of the 12th Inter-
national Joint Conference on Biomedical Engineering
Systems and Technologies. SCITEPRESS - Science
and Technology Publications.
BIOIMAGING 2021 - 8th International Conference on Bioimaging
80

Karakaya, M. and Hacisoftaoglu, R. E. (2020). Comparison
of smartphone-based retinal imaging systems for dia-
betic retinopathy detection using deep learning. BMC
Bioinformatics, 21(S4):259.
Marrugo, A., Mill
´
an, M., Cristobal, G., Gabarda, S., and
Abril, H. (2012). Anisotropy-based robust focus mea-
sure for non-mydriatic retinal imaging. Journal of
biomedical optics, 17.
Marrugo, A. G., Millan, M. S., and Abril, H. C. (2014).
Implementation of an image based focusing algorithm
for non-mydriatic retinal imaging. In 2014 III Inter-
national Congress of Engineering Mechatronics and
Automation (CIIMA). IEEE.
Melo, D., Costa, J., Soares, F., and Vieira, P. (2018). Op-
tical Design of a Compact Image Acquisition De-
vice for Mobile Diabetic Retinopathy Screening:. In
Proceedings of the 11th International Joint Confer-
ence on Biomedical Engineering Systems and Tech-
nologies, pages 63–70, Funchal, Madeira, Portugal.
SCITEPRESS - Science and Technology Publications.
Melo, D., Soares, F., Felgueiras, S., Gonc¸alves, J., and
Vieira, P. (2019). A new compact optical system pro-
posal and image quality comparison against other af-
fordable non-mydriatic fundus cameras. In Biomedi-
cal Engineering Systems and Technologies, pages 26–
48. Springer International Publishing.
Moscaritolo, M., Knezevich, F., Jampel, H., and Zeimer, R.
(2009). An Image Based Auto-Focusing Algorithm
for Digital Fundus Photography. IEEE Transactions
on Medical Imaging 28(11):1703-7.
Pertuz, S., Puig, D., and Garcia, M. A. (2013). Analysis of
focus measure operators for shape-from-focus. Pat-
tern Recognition, 46(5):1415–1432.
P
´
erez, M. A., Bruce, B. B., Newman, N. J., and Biousse, V.
(2012). The Use of Retinal Photography in Nonoph-
thalmic Settings and Its Potential for Neurology. The
Neurologist, 18(6):350–355.
Rani, P., Nangia, V., Murthy, K., Khanna, R., and Das, T.
(2018). Community care for diabetic retinopathy and
glaucoma in India: A panel discussion. Indian Journal
of Ophthalmology, 66(7):916.
Soares, F., Gonc¸alves, J., Felgueiras, S., Peixoto, R., Mene-
ses, R., and Melo, D. (2020). Smartphone-based hand-
held optical device and method for capturing non-
mydriatic retinal images, Patent EP3695775A1.
Toslak, D., Liu, C., Alam, M. N., and Yao, X. (2018).
Near-infrared light-guided miniaturized indirect oph-
thalmoscopy for nonmydriatic wide-field fundus pho-
tography. Optics Letters, 43(11):2551–2554.
WHO (2019). World report on vision. World Health Orga-
nization, Geneva. Licence: CC BY-NC-SA 3.0 IGO.
Smartphone-based Approach for Automatic Focus Assessment in NIR Fundus Images Targeted at Handheld Devices
81
