
Detecting Anomalies from Human Activities by an Autonomous Mobile
Robot based on “Fast and Slow” Thinking
Muhammad Fikko Fadjrimiratno
1
, Yusuke Hatae
2
, Tetsu Matsukawa
2
a
and Einoshin Suzuki
2 b
1
SLS, Kyushu University, Fukuoka, 819-0395, Japan
2
ISEE, Kyushu University, Fukuoka, 819-0395, Japan
Keywords:
Fast and Slow Thinking, Anomalous Image Region Detection, Deep Captioning, Autonomous Mobile Robot.
Abstract:
In this paper, we propose an anomaly detection method from human activities by an autonomous mobile robot
which is based on “Fast and Slow Thinking”. Our previous method employes deep captioning and detects
anomalous image regions based on image visual features, caption features, and coordinate features. However,
detecting anomalous image region pairs is a more challenging problem due to the larger number of candidates.
Moreover, realizing reminiscence, which represents re-checking past, similar examples to cope with overlook-
ing, is another challenge for a robot operating in real-time. Inspired by “Fast and Slow Thinking” from the dual
process theory, we achieve detection of these kinds of anomalies in real-time onboard an autonomous mobile
robot. Our method consists of a fast module which models caption-coordinate features to detect single-region
anomalies, and a slow module which models image visual features and overlapping image regions to detect
also neighboring-region anomalies. The reminiscence is triggered by the fast module as a result of its anomaly
detection and the slow module seeks for single-region anomalies in recent images. Experiments with a real
robot platform show the superiority of our method to the baseline methods in terms of recall, precision, and
AUC.
1 INTRODUCTION
Detecting anomalies in images has attracted much
attention of the researchers. Some of the proposed
methods tackle medical images as input (Schlegl
et al., 2017) and others are designated to be used by
mobile robots (Paola et al., 2010; Kato et al., 2012;
Lawson et al., 2017; Contreras-Cruz et al., 2019;
Hatae et al., 2020). These works typically employ
a principle which is similar to fast thinking in hu-
man, as they target at relatively simple anomalies and
conduct no follow-up evaluation. For example, for
mobile robot applications (Paola et al., 2010; Kato
et al., 2012; Lawson et al., 2017; Contreras-Cruz
et al., 2019; Hatae et al., 2020), anomaly detection
is typically conducted for the current image or image
region and thus their combinations or past anomalies
are usually ignored. However, such kinds of anoma-
lies could be significant, though their detection poses
a challenge to a robot operating in real-time.
According to the dual process theory (Kahneman,
2011), a human thinks in a fast mode (intuition-based
a
https://orcid.org/0000-0002-8841-6304
b
https://orcid.org/0000-0001-7743-6177
thinking) and a slow mode (reasoning-based think-
ing) in everyday life, including when facing strange
occurrences or anomalies. The fast mode can rec-
ognize anomalies effortlessly, though it can be easily
fooled by illusions or biases. The slow mode consid-
ers what the fast mode overlooked, leading to a more
accurate thinking. The two kinds of thinking interact
with each other, e.g., the slow thinking could correct
past mistakes made by the fast thinking, which corre-
sponds to a reminiscence. Although the dual process
theory (Kahneman, 2011) has already been employed
in several machine learning methods (Anthony et al.,
2017; Silver et al., 2018; Chen et al., 2019), to the best
of our knowledge, no method for anomaly detection
adopts it. We believe that one of the main reasons
is the real-time nature of anomaly detection, which
poses a challenge to realize the slow thinking.
Inspired by the dual process theory (Kahneman,
2011), we propose a real autonomous mobile robot
which detects not only single-region anomalies but
also neighboring-region anomalies and recent over-
looked single-region anomalies. Here a neighboring-
region anomaly represents an anomaly based on an
image region and one of its neighbor image regions.
Fadjrimiratno, M., Hatae, Y., Matsukawa, T. and Suzuki, E.
Detecting Anomalies from Human Activities by an Autonomous Mobile Robot based on “Fast and Slow” Thinking.
DOI: 10.5220/0010313509430953
In Proceedings of the 16th International Joint Conference on Computer Vision, Imaging and Computer Graphics Theory and Applications (VISIGRAPP 2021) - Volume 5: VISAPP, pages
943-953
ISBN: 978-989-758-488-6
Copyright
c
2021 by SCITEPRESS – Science and Technology Publications, Lda. All rights reserved
943

We will explain the details in Section 3. Single-
region anomalies are detected by a simplified version
of our previous method (Hatae et al., 2020), which
corresponds to the fast thinking, while neighboring-
region anomalies are detected by our new method
which records neighboring regions and corresponds
to the slow thinking. Recent overlookedsingle-region
anomalies are sought by the slow thinking right after
a trigger from the fast thinking, which corresponds to
the reminiscence. We conduct experiments in a real
indoor environment with several students.
2 RELATED WORKS
2.1 Dual Process Theory
According to the dual process theory (Kahneman,
2011), human thinking consists of two different types
of processes: fast thinking and slow thinking. The fast
thinking is a fast, intuitive, and unconscious process
and is conducted by System 1. The slow thinking is a
slow, logical, and conscious process and is conducted
by System 2. Not only us but also Yoshua Bengio be-
lieves the theory is highly promising to leverage the
capability of an AI system
1
.
Recently, there are several works inspired by the
dual process theory (Kahneman, 2011) to solve com-
plex problems which require a reasoning capability
(Anthony et al., 2017; Silver et al., 2018; Chen et al.,
2019). These works follow a similar approach where
a standard machine learning method corresponding to
System 1 is assisted by their System 2, a reasoning
or search method. Some of them use Monte Carlo
Tree Search (Chaslot et al., 2008) to solve sequen-
tial decision making problems found in board games
(Anthony et al., 2017; Silver et al., 2018) while an-
other work uses a logical and constraint reasoning al-
gorithm in solving constrained unsupervised learning
problems (Chen et al., 2019). As we stated in the pre-
vious section, to the best of knowledge, none of these
works tackle anomaly detection.
2.2 Anomaly Detection by a Mobile
Robot
Several works employ or consider a mobile robot as
an anomaly detection platform (Paola et al., 2010;
Kato et al., 2012; Lawson et al., 2017; Contreras-
Cruz et al., 2019; Hatae et al., 2020). Di Paola
et al. developed a robot which uses the position it
1
Yoshua Bengio: “From System 1 Deep Learning to
System 2 Deep Learning”, invited talk at NeurIPS 2019.
captured images to detect anomalies from the differ-
ences in HS (hue and saturation) histograms (Paola
et al., 2010). Kato et al. used GIST feature (Oliva
and Torralba, 2001) as their low-level image repre-
sentation (Kato et al., 2012). More advanced meth-
ods used deep features to represent visual information
and detect anomalies based on the reconstruction er-
ror (Lawson et al., 2017; Contreras-Cruz et al., 2019).
For example, (Lawson et al., 2017) clustered features
of each image region from a deep neural network to
build a dictionary of the elements which are typically
found in each scene. It evaluated the image regions
observed in the test phase based on the dictionary.
Our previous method (Hatae et al., 2020), in ad-
dition to images, also analyzes textual information,
which is generated by deep captioning (Johnson et al.,
2016). From each captured images, Densecap (John-
son et al., 2016) detects salient image regions and
generates a caption from each of the regions. The
method is able to detect anomalies at the semantic
level based on the captions in addition to anomalies at
the visual level based on image regions and their mean
coordinates. To fulfill the requirements of a real-
time detection, we will simplify our previous method
(Hatae et al., 2020) as our System 1 and harness our
new System 2 in Section 4.
2.3 Modelling Relationships between
Image Regions
Detecting neighboring-region anomalies calls for
modeling relationships between image regions. Sev-
eral works consider relationships between image re-
gions or objects for various tasks, such as detecting
wrong labels in image-segmentation (Pasini and Bar-
alis, 2019), improving object detection quality (Liu
et al., 2018), and learning to detect human-object in-
teractions (Xu et al., 2019). The last two model the
relationships between image regions or objects with a
graph model (Liu et al., 2018; Xu et al., 2019), while
the first one uses a histogram-based method (Pasini
and Baralis, 2019).
These works consider all pairs of image regions
or objects inside an image, which would be demand-
ing for a robot operating in real-time. We will simply
limit our focus on neighboring regions in Section 4.
3 TARGET PROBLEM
We define the target problem of detecting anomalies
from the images captured by an autonomous mobile
robot. In the training phase, at each of time steps t =
VISAPP 2021 - 16th International Conference on Computer Vision Theory and Applications
944
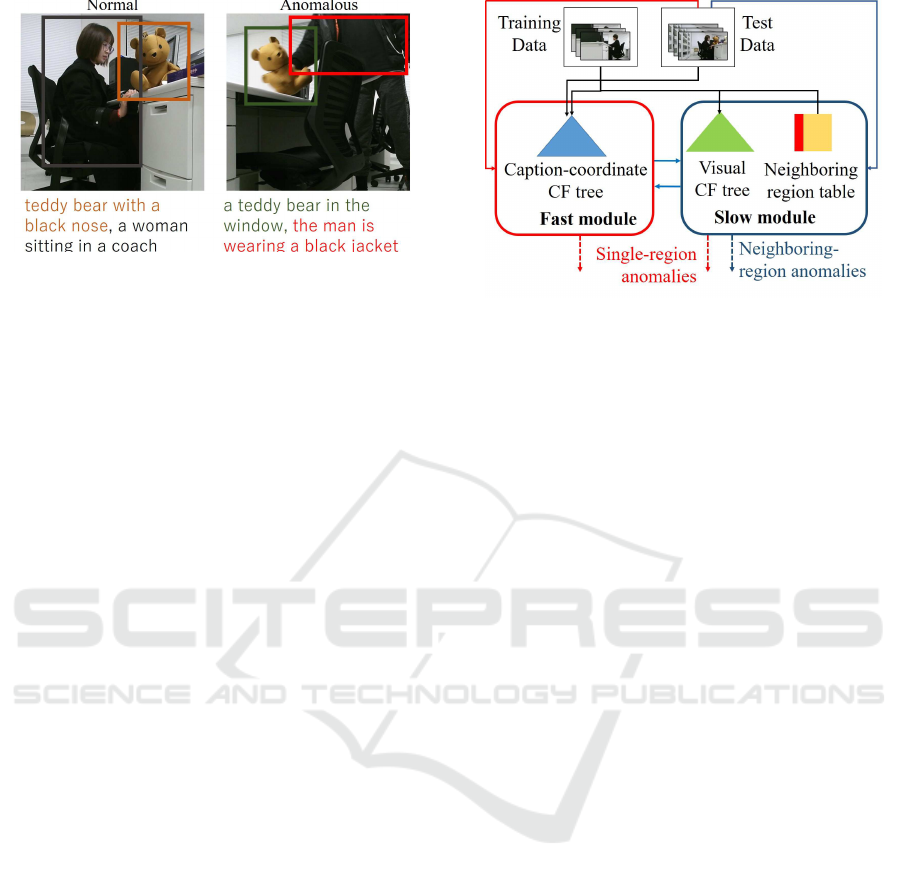
Figure 1: Example of a neighboring-region anomaly.
1, . . . , T, the robot captures image H
t
, where T repre-
sents the last time step in the training phase. Similarly
in the test phase, at each of time stepst = 1, . . . , T
′
, the
robot captures image H
′
t
, where T
′
represents the last
time step in the test phase. As in our previous work
(Hatae et al., 2020), the robot is able to conduct image
region captioning such as Densecap (Johnson et al.,
2016) on H
t
or H
′
t
. Their outputs are m(t) regions
with their captions c
c
c
t1
, . . . , c
c
c
tm(t)
and m(t)
′
regions
with their captions c
c
c
′
t1
, . . . , c
c
c
′
tm(t)
′
, respectively. Re-
gion r
r
r
ti
in the training phase is specified by the x and
y coordinates (x
max
ti
, y
max
ti
, x
min
ti
, y
min
ti
) of two diagonal
vertices (the upper right corner and the lower left cor-
ner) of the region rectangle and is associated with its
caption c
c
c
ti
that explains it. Likewise region r
r
r
′
ti
in the
test phase is specified by (x
max
′
ti
, y
max
′
ti
, x
min
′
ti
, y
min
′
ti
)
and is associated with its caption c
c
c
′
ti
.
By definition anomalous examples are extremely
rare compared with normal examples and rich in va-
riety. This nature makes it hard to collect anomalous
examples and include them in the training data. We
follow our previous works (Hatae et al., 2020; Fujita
et al., 2020) and tackle one-class anomaly detection,
in which the training data contain no anomalous ex-
ample. Note that we don’t have to label our train-
ing data and are possibly able to detect new kinds of
anomalies.
As kinds of anomalies, we assume single-region
anomalies and neighboring-region anomalies. A
single-region anomaly is an image region r
r
r
′
ti
which
a human evaluator recognizes as anomalous. As in
our previous work (Hatae et al., 2020), we consider
anomalous objects, anomalous actions, and anoma-
lous positions, which represent highly dissimilar ob-
jects, actions, and positions to those in the training
data, respectively. A neighboring-region anomaly is a
pair of image regions r
r
r
′
ti
, r
r
r
′
t j
which overlap each other,
i.e., the two rectangles have an overlapping part, and
a human evaluator recognizes as anomalous. We here
consider anomalous combinations of neighboring ob-
Figure 2: Diagram of the proposed system.
jects in the test data compared to those in the training
data. For instance, as shown in Fig. 1 right, a man
holding a teddy bear in the test data could be con-
sidered as a neighboring-region anomaly if he never
held it in the training data (a woman rather held it
as in Fig. 1 left). Though many anomaly detection
methods which are designed to be used by mobile
robots (Paola et al., 2010; Kato et al., 2012; Lawson
et al., 2017; Contreras-Cruz et al., 2019; Hatae et al.,
2020) tackle single-region anomalies, we also include
neighboring-region anomalies in this paper.
An anomaly detection method is evaluated in
terms of its accuracy and system performance. Here
the accuracy performanceis typically evaluatedby the
recall/precision and the AUC (Area Under the ROC
curve). The system performance refers to the required
robot platform and the detection throughput, i.e., the
frame rate in anomaly detection.
Note that the above accuracy evaluation is con-
ducted in the region level. We can do it in the image
level by considering the numbers of normal images
and anomalous images that were correctly/incorrectly
predicted. Here an anomalous image is defined as an
image which contains at least one anomalous region.
4 PROPOSED METHOD
4.1 Overview
Fig. 2 shows a diagram of the proposed system. As
we explained previously, our system consists of a fast
module and a slow module. Both modules detect
single-region anomalies and the slow module only de-
tects neighboring-region anomalies. The fast mod-
ule records the caption-coordinate pairs with a height
balanced tree, which is a simplification of our previ-
Detecting Anomalies from Human Activities by an Autonomous Mobile Robot based on “Fast and Slow” Thinking
945

ous work (Hatae et al., 2020)
2
. On the other hand,
the slow module models image visual features and
records neighboring regions.
The height balanced tree for the caption-
coordinate pairs is called the caption-coordinate CF
tree, which is a specialization of the CF (Cluster-
ing Feature) tree (Zhang et al., 1997). The caption-
coordinate CF tree is built incrementally during the
training phase and the test phase according to the pro-
cedure in BIRCH, an incremental clustering method
(Zhang et al., 1997). The height balanced tree for the
image visual features is called the visual CF tree. It is
built incrementally during the training phase and re-
ferred during the test phase. The neighboring regions
during the training phase are recorded in the neigh-
boring region table. The table consists of rows, each
of which contains an image region and its neighboring
image regions with their numbers of co-occurrences.
We will explain the detail in the next section.
4.2 Learning Application
4.2.1 Training Phase
In the training phase, our robot models the caption-
coordinate information and the image visual features
of image region r
r
r
ti
and records neighboring image re-
gions in the caption-coordinate CF tree, the visual CF
tree, and the neighboring region table, respectively.
These data structures are used in the test phase in our
anomaly detection.
At each time step t for every image region r
r
r
ti
, we
transform each caption c
c
c
ti
into a caption feature M
M
M
ti
by following our previous work (Hatae et al., 2020).
First each word in c
c
c
ti
except those in a stopword list
is transformed into a vector using a word embedding
method such as Word2Vec (Mikolov et al., 2013).
Then the mean of these vectors normalized with its
L2-distance is given as M
M
M
ti
. The x and y coordinates
(x
max
ti
, y
max
ti
, x
min
ti
, y
min
ti
) are transformed into their nor-
malized coordinates r
r
r
′
ti
= (x
center
ti
, y
center
ti
) as follows
(Hatae et al., 2020).
x
center
ti
=
x
min
ti
+ x
max
ti
2w
(1)
y
center
ti
=
y
min
ti
+ y
max
ti
2h
, (2)
where w and h are the horizontal and vertical sizes of
the image, respectively. Then we obtain the coordi-
nate caption vector F
cc
(r
r
r
ti
) as follows.
F
cc
(r
r
r
ti
) = M
M
M
ti
⊕ dr
r
r
′
ti
, (3)
2
Our previous work models image-caption-coordinate
triplets.
where d is a hyper-parameter which controls the in-
fluence of w and h. ⊕ represents the concatenation
operator. The caption-coordinate CF tree is built with
F
cc
(r
r
r
ti
) for t = 1, . . . , T and i = 1, . . . , m(t).
Similarly, at each time step t for every image re-
gion r
r
r
ti
, we transform r
r
r
ti
into its image visual feature
V
V
V
ti
based on (Hatae et al., 2020). V
V
V
ti
is the penul-
timate layer of the Convolutional Neural Network
(CNN) (Krizhevsky et al., 2012) normalized with its
L2-distance. The visual CF tree is built with V
V
V
ti
for
t = 1, . . . , T and i = 1, . . . , m(t).
Note that the two CF trees model the caption-
coordinate information and the image visual infor-
mation in the training data. Their leaf nodes repre-
sent clustering features which consist of similar fea-
tures and thus a leaf ID is a compact representation
of the corresponding information. In the neighbor-
ing region table, which we propose in this paper, we
represent each image region by the closest leaf ID
of the caption-coordinate CF tree. The closeness is
measured in terms of the mean Euclidean distance
between F
cc
(r
r
r
ti
) and the CF vector of the leaf node
to simulate the fast thinking of a human. The neigh-
boring region table records the leaf IDs of the image
region r
r
r
ti
and its neighboring image regions r
r
r
t j
with
their numbers of the co-occurrences, where j 6= i and
r
r
r
ti
and r
r
r
t j
have an overlapping part. The neighboring
region table enables a quick reference of the overlap-
ping image regions in terms of the caption-coordinate
pairs, which results in a quick detection of anomalous
region pairs.
4.2.2 Test Phase
In the test phase, our robot detects the single-region
anomalies with both of its fast and slow modules. It
also detects the neighboring-region anomalies with
its slow module. Each detection is conducted on H
′
t
(t
′
= 1, . . . , T
′
) based on the three data structures that
it constructed during the training phase.
Detecting single-region anomalies is conducted
with a simplified method of our previous work (Hatae
et al., 2020)
3
. At each time step t for every im-
age region r
r
r
′
ti
, the caption c
c
c
′
ti
and the coordinates
(x
max
′
ti
, y
max
′
ti
, x
min
′
ti
, y
min
′
ti
) are transformed into the co-
ordinate caption vector F
cc
(r
r
r
′
ti
) as in the previous sec-
tion. F
cc
(r
r
r
′
ti
) is fed into the caption-coordinate CF
tree to update it. If the mean Euclidean distance be-
tween F
cc
(r
r
r
′
ti
) and the CF vector of the corresponding
leaf node
4
is above user-specified threshold R, r
r
r
′
ti
is
3
We also used image visual features in constructing the
CF tree in (Hatae et al., 2020).
4
The leaf node which is selected to decide whether it
absorbs r
r
r
′
ti
.
VISAPP 2021 - 16th International Conference on Computer Vision Theory and Applications
946
returned as a single-region anomaly.
Once the fast module detects at least one single-
region anomaly r
r
r
′
ti
in H
′
t
and a similar leaf
5
exists in
the visual CF tree, the slow module starts checking
recent images H
′
t−1
, H
′
t−2
, . . . for possible overlook-
ing, which corresponds to our reminiscence. Note
that the fast module relies on caption-coordinate in-
formation for real-time detection and neglects image
visual features. It is possible that similar anoma-
lies to the detected single-region anomaly r
r
r
′
ti
exist in
H
′
t−1
, H
′
t−2
, . . . , which are overlooked. As in the train-
ing phase, image visual feature V
V
V
′
ti
is obtained from
r
r
r
′
ti
. Then, if the mean Euclidean distance between
V
V
V
′
ti
and the CF vector of its closest leaf node is no
greater than user-specified threshold S, then the leaf
is judged to be visually similar to the single-region
anomaly r
r
r
′
ti
. The slow module first checks each re-
gion r
r
r
′
(t−1) j
( j = 1, . . . , m(t − 1)
′
) in H
′
t−1
with the
visual CF tree. Using the above procedure, the leaf
that is similar to r
r
r
′
(t−1) j
in the visual CF tree is iden-
tified. r
r
r
′
(t−1) j
is judged a single-region anomaly if its
leaf node is identical to the leaf node of r
r
r
′
ti
. If the
slow module detects such a single-region anomaly in
the current image, it then checks the previous image
6
.
This reminiscence process is iterated until the slow
module finds no anomaly in the current image.
The slow module at each time step t for every
image region r
r
r
′
ti
checks its overlapping regions r
r
r
′
t j
.
Since the caption-coordinate CF tree is also updated
in the test phase, both r
r
r
′
ti
and r
r
r
′
t j
have their corre-
sponding leaf nodes in the tree. The slow module
judges the pair r
r
r
′
ti
and r
r
r
′
t j
as a neighboring-region
anomaly if r
r
r
′
t j
is not stored or its number of co-
occurrence is no greater than user-specified threshold
Q in the row of r
r
r
′
ti
in the neighboring region table.
It should be noted that this process is conducted in
terms of the leaf ID in the caption-coordinate CF tree
and the CF vector of a leaf node is continuously up-
dated. Hence the same leaf ID could represent differ-
ent CF vectors. To cope with this problem, when we
split a leaf into two, we assign new IDs to the new
leaves. Thus the splitted (and hence deleted from the
tree) leaf ID will no longer affect the anomaly detec-
tion. Note also that the CF vector of a leaf node is
continuously updated by absorbing new regions even
if the leaf node is not splitted. Since the leaf node is
not splitted, we assume that the change of the CF vec-
tor is small and thus can be safely neglected. Hence
we regard the CF vector of a leaf ID as constant.
5
We will explain how to check the similarity below.
6
If H
′
t−1
is the current image and the fast module detects
a single-region anomaly, after checking all regions in H
′
t−1
the previous image H
′
t−2
becomes the (new) current image.
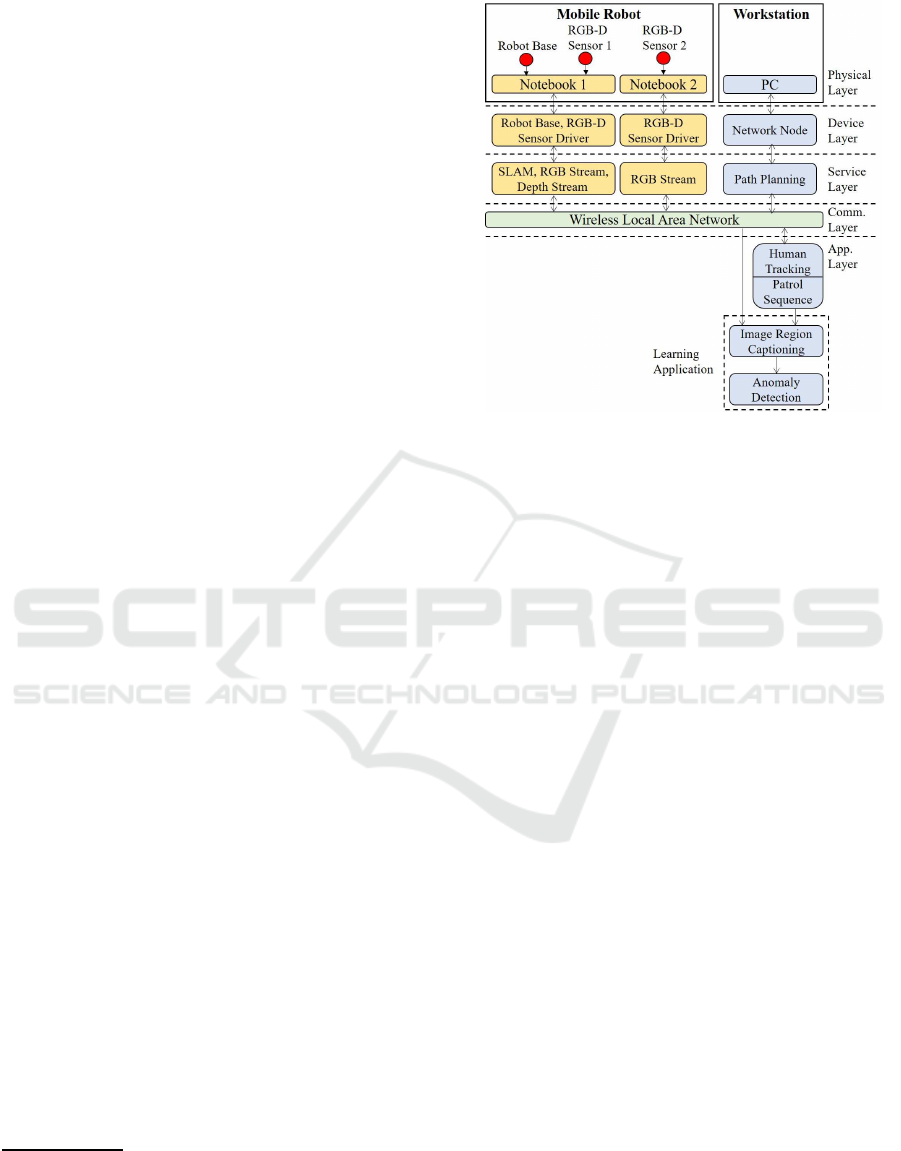
Figure 3: Architecture of the proposed system.
4.3 Robot Platform
Fig. 3 shows our layered architecture that consists of
heterogeneous components to process different kinds
of tasks. Our architecture is composed of five layers,
which allows the basic services to be executed in each
layer without disrupting each other. The layers work
simultaneously and information is provided to appli-
cations in the higher level. The first layer is a physical
layer, which includes the hardware of a mobile robot
and a workstation. The device layer manages the
hardware by providing device drivers for the mobile
robot and its sensors. The service layer consists of
several basic services that handle primitive behaviors
of the robot such as its movement, its visual capturing,
its path planning, and its obstacles avoidance. The
application layer consists of high-level applications
that control complex tasks, especially our proposed
anomaly detection method (our learning application
in Section 4.2), and the control algorithms of the
robot. We used wireless local area network (WLAN)
as our communication layer to provide seamless con-
nection between the application layer and the service
layer.
We employed TurtleBot 2 as a robot base in our
platform, which is equipped with two RGB-D sen-
sors (Kinect) and two notebook PC’s, as shown in
Figure 4. The notebook PC 1 runs a Kinetic ver-
sion of ROS (Robot Operating System), which han-
dles the robot base and the first RGB-D sensor 1 (lo-
cated on the lower part of the robot). Notebook PC 1
runs several services for navigation purposes, such as
handling primitive behaviors of the robot and provid-
ing SLAM (Simultaneous Localization and Mapping)
Detecting Anomalies from Human Activities by an Autonomous Mobile Robot based on “Fast and Slow” Thinking
947
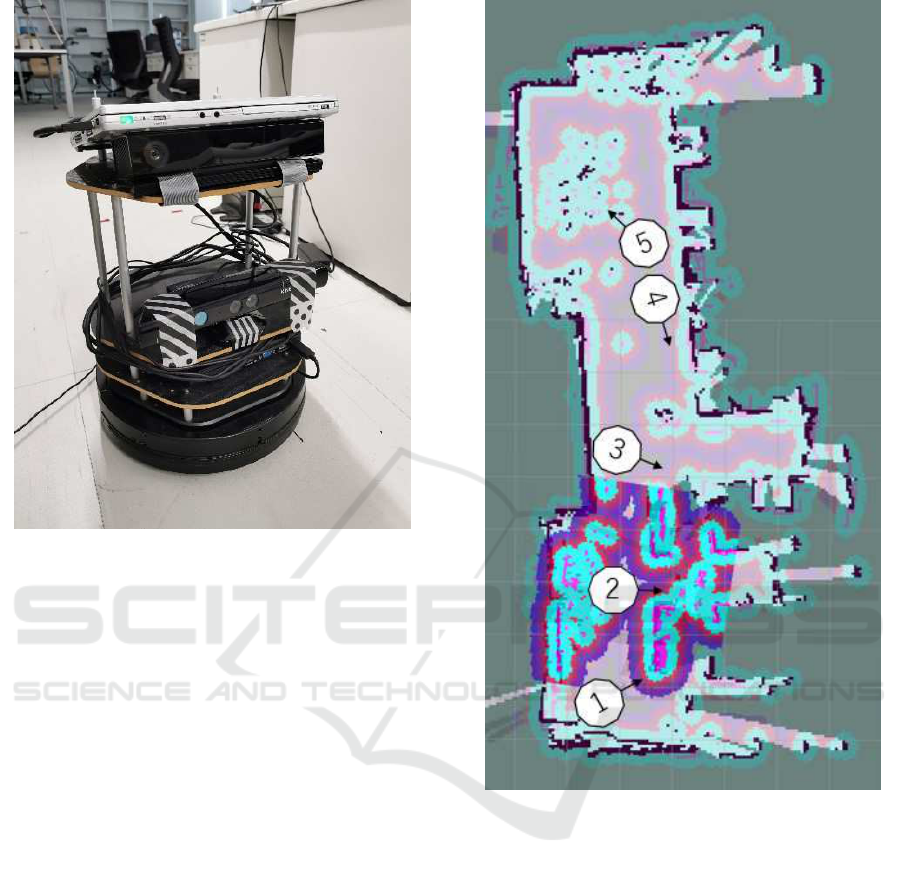
Figure 4: Robot platform used in the proposed system.
service with the odometry data and RGB-D data from
the RGB-D sensor 1. We used OpenNI driver in the
device layer to run the RGB-D sensor 1.
Notebook PC 2 solely handles the RGB-D sensor
2 through Kinect for Windows SDK 2.0. Notebook
PC 2 runs a service that feeds our anomaly detection
module with RGB data from RGB-D sensor 2. For
our experiments, we used Kinect as it provides broad
possibilities with its depth data, which would be also
useful in our future works. Furthermore, we also need
depth data for a more accurate face and skeleton fea-
ture extraction for the human tracking procedure in
our application layer.
We also used a desktop PC as a workstation to
monitor the robot movement while running several
services and applications which require a lot of pro-
cessing powers. Desktop PC provides a service to
plan the navigation path given the designated loca-
tions and several high-level applications in our appli-
cation layer such as human tracking, patrol sequence,
and the learning application. However, it is also pos-
sible to run all services and high-level applications in
the notebook PC 2 if a dedicated GPU for the deep
captioning is available, which allows a faster data
transmission. In this case, the desktop PC is used only
for monitoring the robot.
Figure 5: Mapping results and designated positions for
monitoring the target persons.
5 EXPERIMENTS
5.1 Navigation and Monitoring
Methods
In our experiments, our mobile robot patrolled inside
a room and moved to the designated locations to mon-
itor target humans. We employed GMapping (Grisetti
et al., 2007), a highly efficient Rao-Blackwellized
particle filter for learning grid map scanned from laser
range data, which in our case is depth data scanned
with RGB-D sensor 1. We used this method to map
the room and extracted coordinates and orientation at
designated positions to monitor the target humans, as
shown in Figure 5. By inputting these coordinates and
VISAPP 2021 - 16th International Conference on Computer Vision Theory and Applications
948

orientations to the patrol sequence module in our ap-
plication layer, our robot can navigate to the desig-
nated positions sequentially while avoiding obstacles
and localizing itself. The numbered circles in the Fig-
ure represent monitoring points of the robot.
1
is the
place to monitor either of two female students.
2
is
for monitoring a male student sitting on a chair.
3
is for monitoring any student sitting on a chair.
4
is for monitoring a specific female student.
5
is for
monitoring around a bicycle.
After arriving at the designated position, the robot
activates RGB-D sensor 2 and starts checking if there
is any person in that location. If the robot finds a tar-
get person, it will start tracking his/her movement and
monitoring him/her. Our robot tracks his/her move-
ment to match its orientation with his/her position us-
ing the PID (Proportional, Integral, Derivative) con-
trol (Rivera et al., 1986). The robot monitors the per-
son for approximately 60 seconds before moving to
the next designated position.
5.2 Datasets
We used our mobile robot to collect the training
dataset and the test dataset. The composition of the
two datasets are shown in Table 1.
At the training phase, our robot observed normal
activities and collected the training dataset, which
consists of sequence of images with no anomalous re-
gion. Several examples are shown in Figure 6. The
collection was done in three days, each lasting from
about 20 minutes to about 3 hours. In each day, a
male student and a female student were observed by a
robot. The same male person participated during the
three days while one female student during the first
two days and another one during the last day.
At the test phase, our robot collected the test
dataset, which contains anomalies. The collection
was done during our real-time anomaly detection ex-
periments. These experiments were conducted in two
days, each lasting 10 minutes. During the first day,
we intentionally included two kinds of neighboring-
region anomalies, i.e., holding a teddy bear belong-
ing to another person, and carrying a pile of books.
We also included one kind of single-region anoma-
lies, i.e., opening an umbrella, to evaluate our rem-
iniscence under a possible presence of wrong cap-
tions. Similarly, during the second day, three kinds of
neighboring-region anomalies were included. They
are playing with a basketball, riding a bicycle, and
holding a bag belonging to another person. Several
examples of anomalies are shown in Figure 7.
5.3 Design of the Experiments
Following (Hatae et al., 2020), we used Word2Vec
(Mikolov et al., 2013) as the word embedding method
and set the number of dimension to 300. Similarly,
we used Densecap (Johnson et al., 2016) as the deep
captioning method. We set the threshold for non-
maximum suppression among region proposals in the
region proposal network to 0.7 and the threshold for
non-maximum suppression among final output boxes
to 0.3. For extracting image visual features, we re-
sized each image region to 224 x 224 pixels and used
VGG-16 (Simonyan and Zisserman, 2015). We re-
moved the final layer of VGG-16 (Simonyan and Zis-
serman, 2015), input each image region into the mod-
ified VGG-16, and obtained image visual features,
each having 4096 dimensions. As the stopword list
we used a list in nltk library
7
of Python. We set the
hyper-parameters as d = 1, R = 1.5, S = 0.35, Q = 1.
We conducted two kinds experiments to compare
the detection quality and performanceof our proposed
platform with baseline methods. In the first experi-
ments, we conducted anomaly detection evaluation at
the image level in real-time. Our robot conducted a
round of patrolling activity while detecting anomalies
in real-time from the students inside a room. When
the robot found an anomaly in an image, the robot re-
ported the image to the human
8
. In turn, the human
immediately verified whether the image contains an
anomaly.
In the second experiments, we tested each method
in detecting anomalies at the region level. We con-
ducted the evaluation after the patrolling task in the
first experiments had been finished. We evaluated the
performance of detection in terms of recall, precision,
and AUC (area under the ROC curve).
As the baseline methods, in the first experiments,
we adopted GANomaly (Akcay et al., 2018) (B1), our
previous method (Hatae et al., 2020) (B2), our pro-
posed method without the slow module (B3), and our
proposed method which does not detect neighboring-
region anomalies (B4). In the second experiments,
we did not use GANomaly because it cannot detect
anomalies at the region level.
5.4 Results and Analysis
The results of our first experiment are shown in Ta-
bles 2 and 3. Table 2 shows that our proposed method
achieves a smaller number of overlooking of anoma-
lies compared to the baseline methods, proven by its
low number of FN (False Negative). The low num-
7
https://www.nltk.org/index.html
8
The detected image was displayed on the desktop PC.
Detecting Anomalies from Human Activities by an Autonomous Mobile Robot based on “Fast and Slow” Thinking
949
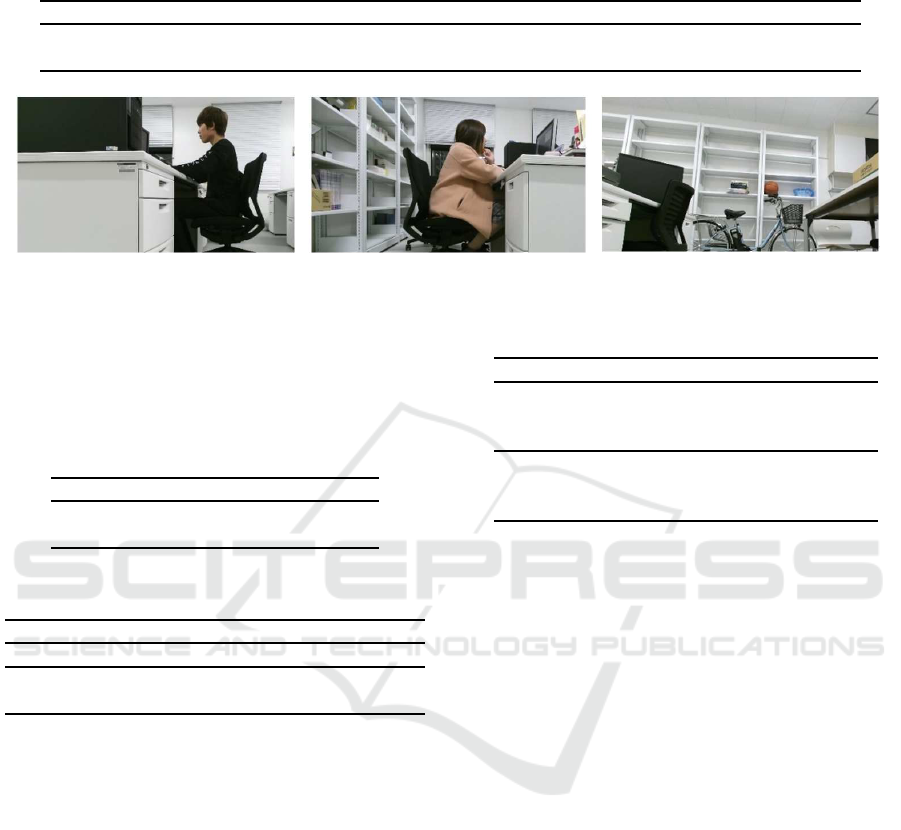
Table 1: Dataset composition, where img and reg represent images and regions, respectively. Each value represents the
corresponding number.
Dataset Total img Normal img Anomalous img Total reg Normal reg Anomalous reg
Training 11777 11777 0 105993 105993 0
Test 631 94 537 5679 3667 2012
Figure 6: Several examples of the (normal) images in the training data.
Table 2: Numbers of errors for each method in the first ex-
periments (anomalies at the image level), where GANomaly
(Akcay et al., 2018) (B1), our previous method (Hatae et al.,
2020) (B2), our proposed method without the slow mod-
ule (B3), and our proposed method which does not detect
neighboring-region anomalies (B4). FN and FP represent
the numbers of false negatives and false positives, respec-
tively.
B1 B2 B3 B4 Ours
FN 256 312 383 302 91
FP 71 26 19 16 22
Table 3: Statistics of the first experiments, where acc. and
prec. represent accuracy and precision, respectively.
B1 B2 B3 B4 Ours
Acc. 0.468 0.450 0.345 0.482 0.816
Recall 0.504 0.402 0.264 0.420 0.825
Prec. 0.786 0.889 0.879 0.931 0.951
ber of FN is reflected in its higher recall, as shown in
Table 3.
Figure 7 shows several examples of images con-
taining anomalies which have been successfully de-
tected by our proposed method but overlooked by the
baseline methods. Most of the images in the Fig-
ure contain anomalies involving multiple image re-
gions, which are difficult to be detected by the base-
line methods but can be detected by our method. For
example, the upper left image and lower middle im-
age in the Figure are anomalous as we explained in
Sections 3 and 5.2. The upper middle image, the
upper right image, and the lower right image in the
Figure are also anomalous because the robot found
that the stack of books, the basketball, and the bicy-
cle were not touched at all in the training phase. The
lower left image in the Figure is an example when an
anomalous image region is wrongly captioned but can
be detected with our method even though similar cap-
tions exist in our training dataset.
Table 4: Numbers of overlooking for each kind of anoma-
lies.
Anomaly Total img Overlooked img
Umbrella 16 2
Teddy bear 95 7
Pile of books 141 28
Basketball 135 17
Bicycle 68 12
Bag 82 25
Table 2 also shows that our proposed method can
suppress the numbers of FP (False Positives) com-
pared to the first two baseline methods, showing rea-
sonably low rate of false alarms with our proposed
method. The low numbers of FP of our proposed
method are also reflected in its high precision as
shown in Table 3. On the other hand, the numbers
of FP in our proposed method is larger than the last
two baseline methods (B3 and B4), showing that our
method inflicts a slightly higher risk of false alarm.
These results make sense because our method tries
to reduce overlooking of anomalies with its reminis-
cence and overlapping region modeling.
Figure 8 shows several examples of normal im-
ages which have been misdetected as anomalies by
our proposed method. For example, inaccurate cap-
tioning “a white towel on the floor” in the left image
in the Figure produced a pair of image regions that
does not exist in the neighboring region table, result-
ing in a misdetection. Similarly, wrongly captioning
a woman as a man in the middle image in the Fig-
ure also resulted in a misdetection. The right image
shows another example.
Table 4 shows the number of overlooking for each
kind of anomalies. Recall that the first three kinds
were collected on the first day while the remaining
three the second day. We see that the last two kinds
were relatively overlooked, which are due to the fol-
lowing reasons. The bicycle region sometimes did
VISAPP 2021 - 16th International Conference on Computer Vision Theory and Applications
950
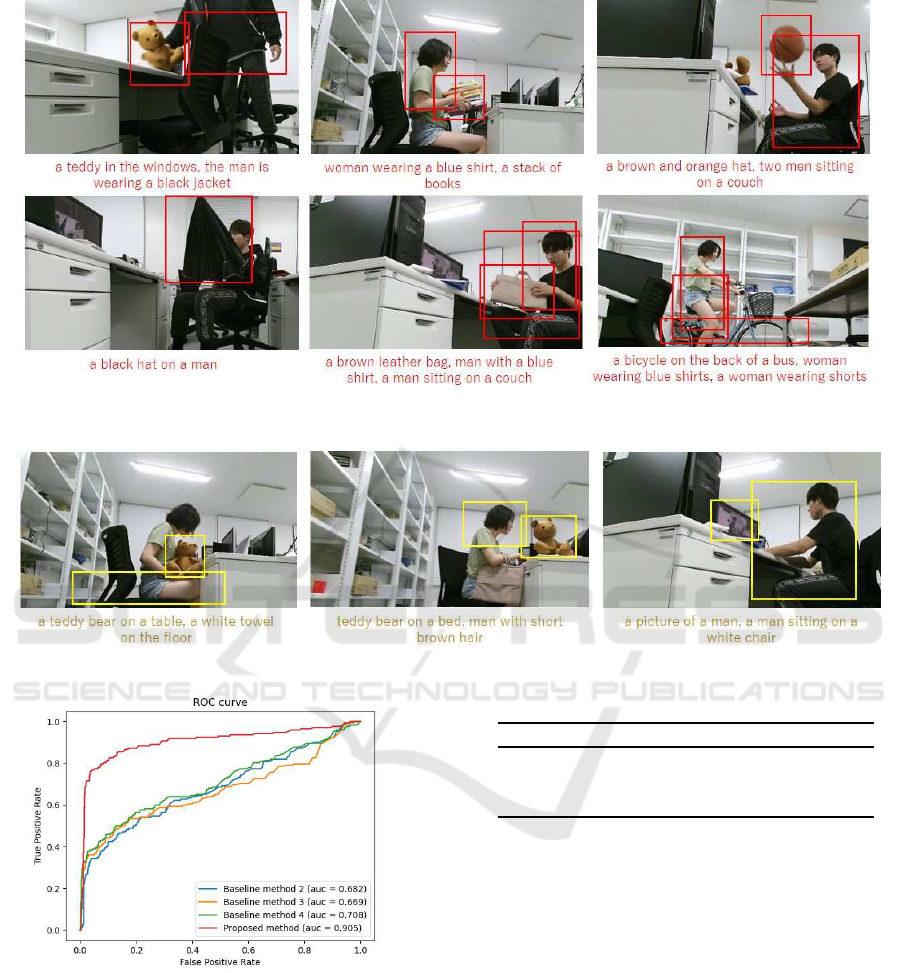
Figure 7: Several examples of the first experiment results where anomalous events that have been detected by our proposed
method but failed to be detected by the baseline methods.
Figure 8: Several examples of the normal region pairs that have been misdetected by our proposed method.
Figure 9: ROC curves and AUCs in the second experiments.
not overlap with the human region. The bag region
was sometimes overlooked by the deep captioning
method. Other kinds of anomalies have less problems
than these two, which are the reasons for their better
performance.
Figure 9 and Table 5 show the results of our sec-
ond experiments. The Figure shows that our method
largely outperforms other methods in AUC. The Table
shows that our method outperforms other methods in
Table 5: Statistics of the second experiments.
B2 B3 B4 Ours
Accuracy 0.216 0.203 0.273 0.698
Recall 0.804 0.778 0.887 0.902
Precision 0.340 0.323 0.418 0.787
accuracy, recall, and precision. Though our method
achieves the highest recall among the tested methods,
the gain is small compared with B4, which is a sim-
plification of our method. Note that B4 exhibits low
precision (0.418), which would be the reason.
Note that compared to the first experiments, these
results show significant performance decreases on all
tested methods because the evaluation at the region
level demands more accuracy than evaluation at the
image level. Furthermore, our test dataset mostly con-
sists of anomalous events involving multiple regions,
which requires accurate detection of the related re-
gions in anomalies. It should be noted that our method
still achieves a high recall (0.902) and a relatively
high precision (0.787) in this setting.
In terms of the system performance, the through-
put varies because the experiments were conducted
in a real environment. Roughly speaking, it is 0.5
Detecting Anomalies from Human Activities by an Autonomous Mobile Robot based on “Fast and Slow” Thinking
951

frame/second in average. Note that as we discussed
in Section 4.3, we can improve it if the deep caption-
ing is conducted on the notebook PC 2. We will report
our progress on this issue in the next section.
6 CONCLUSIONS
Inspired by dual process theory in human thinking,
we proposed an anomaly detection method for an au-
tonomous mobile robot. We focused on anomaly de-
tection from student indoor activities. Our anomaly
detection method combines intuition-based thinking
and reasoning-based thinking through our fast and
slow modules. Unlike previous methods, our method
conducts a kind of reminiscence and is able to de-
tect anomalies which involve neighboring regions.
Our real-time anomaly detection experiments showed
that our proposed method almost always outperforms
the baseline methods and the gain is especially large
when the evaluation is conducted at the image level.
Several kinds of research activities are ongoing to
extend and improve the proposed method. One is to
better model region pairs in an image for detecting
more complex anomalies. Another one is to use hu-
man feedback for improving our reminiscence capa-
bility. We have also purchased GPU-equipped note-
book PCs and installed DenseCap on them toward a
better throughput.
ACKNOWLEDGEMENTS
A part of this work was supported by JSPS KAK-
ENHI Grant Number JP18H03290.
REFERENCES
Akcay, S., Atapour-Abarghouei, A., and Breckon, T. P.
(2018). GANomaly: Semi-Supervised Anomaly De-
tection via Adversarial Training. In Proc. ACCV,
pages 622–637.
Anthony, T., Tian, Z., and Barber, D. (2017). Thinking Fast
and Slow with Deep Learning and Tree Search. In
Proc. NIPS, pages 5360–5370.
Chaslot, G., Bakkes, S., Szita, I., and Spronck, P. (2008).
Monte-Carlo Tree Search: a New Framework for
Game AI. In Proc. AIIDE.
Chen, D., Bai, Y., Zhao, W., Ament, S., Gregoire, J. M.,
and Gomes, C. P. (2019). Deep Reasoning Net-
works: Thinking Fast and Slow. arXiv preprint
arXiv:1906.00855.
Contreras-Cruz, M. A., Ramirez-Paredes, J. P., Hernandez-
Belmonte, U. H., and Ayala-Ramirez, V. (2019).
Vision-Based Novelty Detection Using Deep Features
and Evolved Novelty Filters for Specific Robotic Ex-
ploration and Inspection Tasks. Sensors, 19(13).
Fujita, H., Matsukawa, T., and Suzuki, E. (2020). Detecting
Outliers with One-Class Selective Transfer Machine.
Knowledge and Information Systems, 62(5):1781–
1818.
Grisetti, G., Stachniss, C., and Burgard, W. (2007). Im-
proved Techniques for Grid Mapping with Rao-
Blackwellized Particle Filters. IEEE Transaction on
Robotics, 23(1):34–46.
Hatae, Y., Yang, Q., Fadjrimiratno, M. F., Li, Y., Mat-
sukawa, T., and Suzuki, E. (2020). Detecting Anoma-
lous Regions from an Image Based on Deep Caption-
ing. In Proc. VISIGRAPP, Vol. 5: VISAPP, pages 326–
335.
Johnson, J., Karpathy, A., and Fei-Fei, L. (2016). Dense-
Cap: Fully Convolutional Localization Letworks for
Dense Captioning. In Proc. CVPR, pages 4565–4574.
Kahneman, D. (2011). Thinking, Fast and Slow. Macmillan.
Kato, H., Harada, T., and Kuniyoshi, Y. (2012). Visual
Anomaly Detection from Small Samples for Mobile
Robots. In Proc. IROS, pages 3171–3178.
Krizhevsky, A., Sutskever, I., and Hinton, G. E. (2012). Im-
ageNet Classification with Deep Convolutional Neu-
ral Networks. In Proc. NIPS, volume 1, pages 1097–
1105.
Lawson, W., Hiatt, L., and K.Sullivan (2017). Finding
Anomalies with Generative Adversarial Networks for
a Patrolbot. In Proc. CVPR Workshop.
Liu, Y., Wang, R., Shan, S., and Chen, X. (2018). Structure
Inference Net: Object Detection Using Scene-Level
Context and Instance-Level Relationships. In Proc.
CVPR, pages 6985–6994.
Mikolov, T., Chen, K., Corrado, G., and Dean, J. (2013). Ef-
ficient Estimation of Word Representations in Vector
Space. In Proc. ICLR.
Oliva, A. and Torralba, A. (2001). Modeling the Shape of
the Scene: A Holistic Representation of the Spatial
Envelope. Int. J. Comput. Vis., 42(3):145–175.
Paola, D. D., Milella, A., Cicirelli, G., and Distante, A.
(2010). An Autonomous Mobile Robotic System for
Surveillance of Indoor Environments. International
Journal of Advanced Robotic Systems, 7(1).
Pasini, A. and Baralis, E. (2019). Detecting Anomalies in
Image Classification by means of Semantic Relation-
ships. In Proc. AIKE, pages 231–238.
Rivera, D. E., Morari, M., and Skogestad, S. (1986). Inter-
nal Model Control: PID Controller Design. Industrial
& Engineering Chemistry Process Design and Devel-
opment, 25(1):252–265.
Schlegl, T., Seeb¨ock, P., Waldstein, S. M., Schmidt-Erfurth,
U., and Langs, G. (2017). Unsupervised Anomaly
Detection with Generative Adversarial Networks to
Guide Marker Discovery. In Proc. International Con-
ference on Information Processing in Medical Imag-
ing, pages 146–157.
Silver, D., Hubert, T., Schrittwieser, J., Antonoglou, I.,
Lai, M., Guez, A., and Lillicrap, T. (2018). A Gen-
eral Reinforcement Learning Algorithm that Masters
VISAPP 2021 - 16th International Conference on Computer Vision Theory and Applications
952

Chess, Shogi, and Go through Self-Play. Science,
362(6419):1140–1144.
Simonyan, K. and Zisserman, A. (2015). Very Deep Convo-
lutional Networks for Large-scale Image Recognition.
In Proc. ICLR.
Xu, B., Wong, Y., Li, J., Zhao, Q., and Kankanhalli, M. S.
(2019). Learning to Detect Human-Object Interac-
tions with Knowledge. In Proc. CVPR, pages 2019–
2028.
Zhang, T., Ramakrishnan, R., and Livny, M. (1997).
BIRCH: A New Data Clustering Algorithm and its
Applications. Data Min. Knowl. Discov., 1(2):141–
182.
Detecting Anomalies from Human Activities by an Autonomous Mobile Robot based on “Fast and Slow” Thinking
953
