
Unsupervised Segmentation of Leukocytes Images using Particle Swarm
Jocival Dantas Dias J
´
unior and Andr
´
e R. Backes
School of Computer Science, Federal University of Uberl
ˆ
andia, Av. Jo
˜
ao Naves de
´
Avila, 2121, Uberl
ˆ
andia, MG, Brazil
Keywords:
Image Segmentation, Blood Cell, White Blood Cells, Leukocytes.
Abstract:
Blood smear image analysis is an essential task for many health related issues. Among the many blood
structures present in these images, leukocytes play an important role in the detection of many diseases (such
as leukemias), which can be detected by the amount, or abnormal aspect, of the leukocytes. To address this
problem, this paper presents an unsupervised segmentation method for the nuclear structures in leukocytes.
Our method uses color deconvolution to separate the dyes in different channels and a PSO algorithm to estimate
an optimal kernel filter to combine local features in different stain channels to emphasize the leukocytes
structures so that simple thresholding techniques are able to perform image segmentation. We also used a
postprocessing approach based on morphological operators to refine the border of detected structures, thus
improving our performance. We performed a comparison with different approaches found in literature using
367 images containing leukocytes and other blood structures and results demonstrated the superiority of our
approach in terms of Jaccard index.
1 INTRODUCTION
One of the main parts of the immune system are the
White Blood Cells (WBCs), also called Leukocytes,
which are produced in the bone marrow and lymphoid
tissues. These cells are divided into five types Lym-
phocytes, Monocytes, Eosinophils Basophils, and
Neutrophils. They are responsible for protecting the
body against infections such as bacteria, viruses, and
fungi.
Normally, a healthy human has four to eleven
thousand leukocytes per cubic inch of blood (Banik
et al., 2020), and the excess or lack of these cells can
cause several diseases (Kutlu et al., 2020). The pro-
cess for counting these cells usually involves the seg-
mentation and classification process. Hematologists,
with the aid of microscopes, have to manually seg-
ment the white cells to later classify them into their
types. This process, in addition to requiring several
hours from a trained professional, has its accuracy
quite dependent on the agent who is doing the mea-
surement (Banik et al., 2020).
Technological advances in the field of digital
pathology have brought automatic procedures for the
detection and classification of microscopic images of
WBCs. This procedure consists of connecting digital
cameras to microscopes to obtain high-resolution im-
ages to assist hematologists (Al-Dulaimi et al., 2020).
As a consequence, the use of image processing sys-
tems for this task have grown every day. Typically,
these systems have two main activities: segmentation
and classification of blood cells.
Given the importance of the segmentation process
for further classification, this work proposes an unsu-
pervised segmentation method for the nuclear struc-
tures in leukocytes. This approach separates the RGB
image into three channels and later uses the Parti-
cle Swarm Optimization(PSO) algorithm to estimate
an optimal kernel filter to combine local features in
different stain channels to emphasize the leukocyte’s
structures. After threshold segmentation, morpholog-
ical operators are used to refine the edges of the de-
tected structures.
The remainder of this paper is organized as fol-
lows: In Section 2, we present a review of the state
of the art in leukocyte segmentation. In Section 3, we
present the concepts used in this work. We present our
approach in detail in Section 4. Section 5 presents the
experiments and the results obtained. Finally, Section
6 concludes this paper.
2 RELATED WORKS
Due to its great scientific relevance, several works
were proposed for the segmentation of WBCs
Dias Júnior, J. and Backes, A.
Unsupervised Segmentation of Leukocytes Images using Particle Swarm.
DOI: 10.5220/0010309404390446
In Proceedings of the 16th International Joint Conference on Computer Vision, Imaging and Computer Graphics Theory and Applications (VISIGRAPP 2021) - Volume 4: VISAPP, pages
439-446
ISBN: 978-989-758-488-6
Copyright
c
2021 by SCITEPRESS – Science and Technology Publications, Lda. All rights reserved
439

(Rezatofighi et al., 2009) (Madhloom et al., 2010)
(Mohamed and Far, 2012a) (Mohamed and Far,
2012b) (Mohamed et al., 2012) (Tosta et al., 2015)
(Tareef et al., 2016) (Tareef et al., 2017). Below, we
highlight some works that were used as a comparison
with our approach.
The work of (Tosta et al., 2015) proposed an un-
supervised approach to the segmentation of nuclear
structures in leukocytes. The authors’ method con-
sists of four steps. Firstly, the deconvolution process
is applied to the image to separate two components
of Giemsa stained images, methylene blue and eosin,
based on optical density, which is proportional to the
concentration of each component in specific cellular
structures. Later, in the second stage, a median fil-
ter is applied to remove noise and standardize nuclear
regions. In the third stage, the Neighborhood Valley-
emphasis method automatically determines a thresh-
old value that separates regions of interest and back-
ground. In the last step, post-processing is performed
with the morphological opening and closing operators
to eliminate small holes. The work was evaluated us-
ing the Jaccard coefficient and Precision. The authors
obtained a result of 89.89% in the Jaccard coefficient
and 99.57% in Precision. In conclusion, the authors
point out that the main limitation of this work is the
low result in dealing with the edges of the structures.
In the work of (Tareef et al., 2016), a three-stage
approach to leukocyte segmentation is proposed. The
first step is the segmentation of the nuclei, this seg-
mentation consists of the transformation of the RGB
color space to the CIE LAB, having both the RGB
image and the CIE LAB, a grayscale image is gen-
erated by adding the red channel with the luminance
and subtracting the color component A from the CIE
LAB. With the grayscale image, the Poisson distri-
bution based minimum error thresholding algorithm
is applied to the obtained gray-scale image to get the
nuclei candidates. In the second step, which consists
of cytoplasm segmentation, the authors use discrete
wavelet transform (DWT) and morphological filtering
to eliminate small details and noise and to increase the
contrast between the cytoplasm and the other struc-
tures. At the end of this stage, cytoplasm candidates
are selected using the Otsu method. In the last step,
the authors perform a refinement and filtering to ob-
tain the final segmentation. First, the regularized level
set is applied to refine the cytoplasm candidate con-
tour. Subsequently, an opening is applied followed by
an expansion to remove the excess of edges. In the
end, a filtering process is carried out to remove false
candidates for nuclei and cytoplasm, which consists
of removing nuclei that are not surrounded by cyto-
plasm. The authors’ work was evaluated using the
similarity metric, obtaining a result of 85.10% for the
BloodSeg dataset.
In the paper (Tareef et al., 2017), the authors pro-
posed a framework based on four stages for the seg-
mentation of leukocytes: clustering-based color en-
hancement and reduction, nuclei segmentation, cyto-
plasm segmentation, and post-processing. In the first
stage, the authors created a technique that reduces
the range of colors while preserving the contours of
the cells. In this step, a median filter, followed by
a contrast adjustment, is applied to the original im-
age. Subsequently, they apply a clustering algorithm
to the image to divide it into coherent regions. For
each cluster found, they compute the median value for
each color channel. Then, the authors use the Gram-
Schmidt orthogonalization method to compute a vec-
tor of weights that is later used to highlight the re-
gion to be segmented. In the third stage, the method
applies the watershed transform to segments the cy-
toplasm. In the end, the authors apply several mor-
phological operations and filters to refine the results.
The authors evaluated their results using the similarity
metric, which obtained an average result of 88.2.
3 MATERIAL AND METHODS
3.1 Color Deconvolution
The main goal of color deconvolution is to separate
immunohistochemical dye channels such as hema-
toxylin (H) and eosin (E). In this paper we used the
method based on the orthonormal transformation of
the RGB image in order to separate the dyes in differ-
ent channels (Ruifrok et al., 2001; Wang et al., 2017).
When a monochromatic radiation passes through an
absorbing dye, that dye absorbs a fraction of the light
according to the Bouguer-Lambert-Beer equation:
I = I
0
.e
−δ.c
(1)
where I is the intensity of the monochromatic radia-
tion, I
0
is the intensity of the transmitted radiation, δ
is the spectral molar optical density for a unified layer
thickness and c is the dye concentration.
The optical density (OD) of a channel i is defined
as
OD
i
= −log
10
I
i
I
0
, (2)
and it has a linear relation with the concentration of
absorbing material so that it is useful to estimate the
contribution of each stain in a sample. The contri-
bution of each stain is given by a matrix where each
row represents a specific stain. After the orthonormal
transformation and normalization, the contribution of
VISAPP 2021 - 16th International Conference on Computer Vision Theory and Applications
440

H, E and DAB stains in a RGB image is given by the
following matrix, M:
0.65 0.70 0.29
0.07 0.99 0.11
0.27 0.57 0.78
(3)
Given a RGB image, y = CM describes the
amount of each stain in a particular pixel, where y and
C are 3 × 1 vector for, respectively, stains and RGB
colors. Then, color deconvolution is defined as the
matrix D = M
−1
y. For H, E and DAB stains, D is
defined as follows:
1.88 −0.70 −0.29
−0.07 1.13 −0.11
−0.55 −0.13 1.57
(4)
3.2 Particle Swarm Optimization
Nature has been inspiring of human development in
many subjects and it is not different in the computer
sciences area. There exists many methods and tech-
niques to solve computational problems that use mod-
els inspired in the biology, being one of them the Par-
ticle Swarm Optimization (PSO) algorithm. Proposed
by (Kennedy and Eberhart, 1995), PSO is a swarm
intelligent optimization algorithm. It is mostly in-
spired by the behavior of flocks of birds and schools
of fishes, where these animals are capable to move
synchronously while changing their direction, scat-
tering and regrouping. By mimicking this swarm be-
havior, a system of particles is capable to search for
global optimum by combining its own solution with
the one provided by other members of the swarm.
In PSO algorithm, given a system with N particles,
we associate a position, {X
1
i
(t), X
2
i
(t), . . . , X
D
i
(t)},
and velocity, {V
1
i
(t), V
2
i
(t), . . . , V
D
i
(t)}, to a particle
i, i = 1, 2, . . . , N, where D represents the number of
dimensions in the search space. For a current itera-
tion t, t = 1, 2, . . . , T
Max
, where T
Max
is the maximum
number of iterations, we update the velocity and po-
sition of each particle by using the following set of
equations:
V
i
(t + 1) = ω(t)V
i
(t) + c
1
.r
1
(Pbest
i
(t) − X
i
(t))+
c
2
.r
2
(Gbest(t) − X
i
(t)) (5)
X
i
(t + 1) = X
i
(t) +V
i
(t + 1) (6)
where c
1
and c
2
are the acceleration factors and r
1
and
r
2
are randomly generated values ranging from [0, 1].
ω is the inertia weight and it is defined as a linear
decreasing variable as follows:
ω(t) = ω
max
−
(ω
max
− ω
min
)
T
Max
(7)
where ω
max
= 0.9 and ω
min
= 0.4. Personal and
global best solutions, Pbest
i
and Gbest respectively,
are defined as follows:
Pbest
i
(t) = argmin{ f it(X
i
(1)), . . . , f it(X
i
(t))} (8)
Gbest(t) = arg min{ f it(Pbest
1
(t)),
. . . , f it(Pbest
N
(t))} (9)
3.3 Binarization
In many occasions it is necessary to reduce the num-
ber of gray-levels (or colors) of an image in order to
better evaluate its content. When the resulting im-
age is composed by only black and white pixels, this
process is called as image binarization (Sezgin and
Sankur, 2004).
Literature presents many and different approaches
to convert an image into a binary one, being the sim-
plest approach to apply a threshold value T to each
pixel. Thus, a pixel whose value is greater than the
threshold is classified as white or 1; otherwise, this
pixel is classified as black or 0.
Although this threshold T can be manually de-
fined, there is no guarantee that the chosen value
is the best threshold for images under different ac-
quisition conditions, such as illumination and con-
trast. This has motivated the development of algo-
rithm that compute the best threshold value for each
image based on the gray-levels distribution of the im-
age, such as the Otsu (Otsu, 1979), Valley Emphasis
(Ng, 2006), Modified Valley Emphasis (Fan and Lei,
2012) and Balanced Histogram (dos Anjos and Shah-
bazkia, 2008) methods.
It is also important to emphasize that due to fac-
tors such as non-uniform illumination, not all images
can be converted to a binary one by using a single
threshold value. For these images it is recommended
the use of adaptive image binarization, where differ-
ent threshold values are computed for different por-
tions of the image.
4 PROPOSED FRAMEWORK
In this section we describe the proposed framework
used to segment leukocytes from other blood struc-
tures in images. Given an input image, we compute
its deconvolution to emphasize the color information
of the leukocytes present in it. In the sequence, we use
a 3×3×3 kernel filter (computed using the PSO algo-
rithm) to convert the image resulting from deconvolu-
tion into a grayscale image that highlights the leuko-
cytes. Then we use a binarization algorithm to select
Unsupervised Segmentation of Leukocytes Images using Particle Swarm
441

the leukocytes regions of the images. Since more ob-
jects are present in the image (e.g., other blood struc-
tures) and may be detected as leukocytes, we apply
two a post processing steps to select actual leukocytes
and to ensure the quality of the leukocytes detected.
Figure 1 displays the framework of the method.
4.1 Image Segmentation using PSO
Cell staining, such as H&E, is a procedure used to
increase color contrast of different structures, thus al-
lowing for a clearer view and improving the perfor-
mance of segmentation algorithms. Therefore, in-
stead of using color segmentation algorithms or other
color space models, we propose to use a simple kernel
filter to emphasize the leukocytes in images by com-
bining local features in different stain channels.
We used a particle swarm algorithm to optimize
the 27 floating point values that composes a 3 × 3 ×3
kernel filter. After applying the color deconvolution
algorithm on an input image, we applied this kernel
filter to combine local characteristics present in each
stain channel, thus producing a single gray scale im-
age S. The main idea is that the kernel filter is able to
generate an image S that highlights the main charac-
teristics of leukocytes, so that it could be easily seg-
mented using a simple automatic threshold approach
(e.g., Otsu method), as shown in Figure 2. To mea-
sure how accurate the proposed segmentation is we
used Jaccard index (Ghose et al., 2012), as described
in Equation 10:
J(A, B) =
|A ∩ B|
A ∪ B
(10)
where A and B are two binary images, respectively,
our segmentation and the expert’s segmentation. D,
0 ≤ D ≤ 1, is the similarity level between the images,
and the more the value D is close to 1, the more simi-
lar the images are.
4.2 Leukocytes Selection
After the image segmentation, it is necessary to verify
whether each detected object is actually a leukocyte or
not. To accomplish that, we proposed the following
procedure. Initially we performed a morphological
opening using a disk of radius r = 5 in order to sepa-
rate near objects that are connected. We computed the
area of all objects. This area is normalized by the area
of the largest object. In the sequence, we removed all
objects with a normalized area smaller than or equal
to 0.2 from the image. We considered the remaining
objects as leukocytes. This step was performed in or-
der to remove objects that are too small in relation
to the others. These objects represent small segmen-
tation errors and noise present in the original image.
Finally, we computed the image complement of the
resulting segmentation containing the detected leuko-
cytes and removed all objects with an area smaller
than 100 pixels. The operation was carried out to
eliminate small background regions present inside the
leukocytes detected during the segmentation stage.
4.3 Border Refinement
When analyzing the leukocyte image it is possible
to notice that there is a diffuse region separating the
leukocyte from the image background. As a conse-
quence, the segmentation process may not correctly
detect the leukocyte border or to detect background
regions adjacent to a leukocyte as part of it. Thus, we
proposed a process of refining the leukocyte border
detected in the segmentation step. This process be-
gins with the dilation of the segmented image using
a disk of radius r = 5. This is performed so that un-
detected regions of the leukocyte border are included
in the refinement process. Then, we performed an
erosion process guided by the color of the leukocyte.
This process is executed for each leukocyte detected
and it is defined as follows:
1. Given an binary object A, compute its morpholog-
ical erosion using a disk of radius r = 2, B;
2. Compute the difference between objects A and B,
C = A − B, where C is the region removed in the
process of erosion;
3. Compute the average color of object B in the orig-
inal image,
¯
B
RGB
;
4. For each pixel of C, compute the Euclidean dis-
tance between its color in the original image and
the average color
¯
B
RGB
.
5. Remove from object A all point in C whose dis-
tance is greater than a threshold T = 75.
6. Repeat this process whenever more than 25% of
the pixels of C are removed from object A.
Figure 3 shows an example of border refinement
for a given leukocytes image.
5 RESULTS AND DISCUSSION
To evaluate our approach we used a dataset containing
leukocytes images (Tosta et al., 2015). This dataset
contains 367 color images of leukocytes stained with
hematoxylin and eosin (H&E). Each image has
640 × 480 pixels size and we applied color deconvo-
lution over them before applying any other step of our
VISAPP 2021 - 16th International Conference on Computer Vision Theory and Applications
442
(a) (b)
(c) (d)
(e) (f)
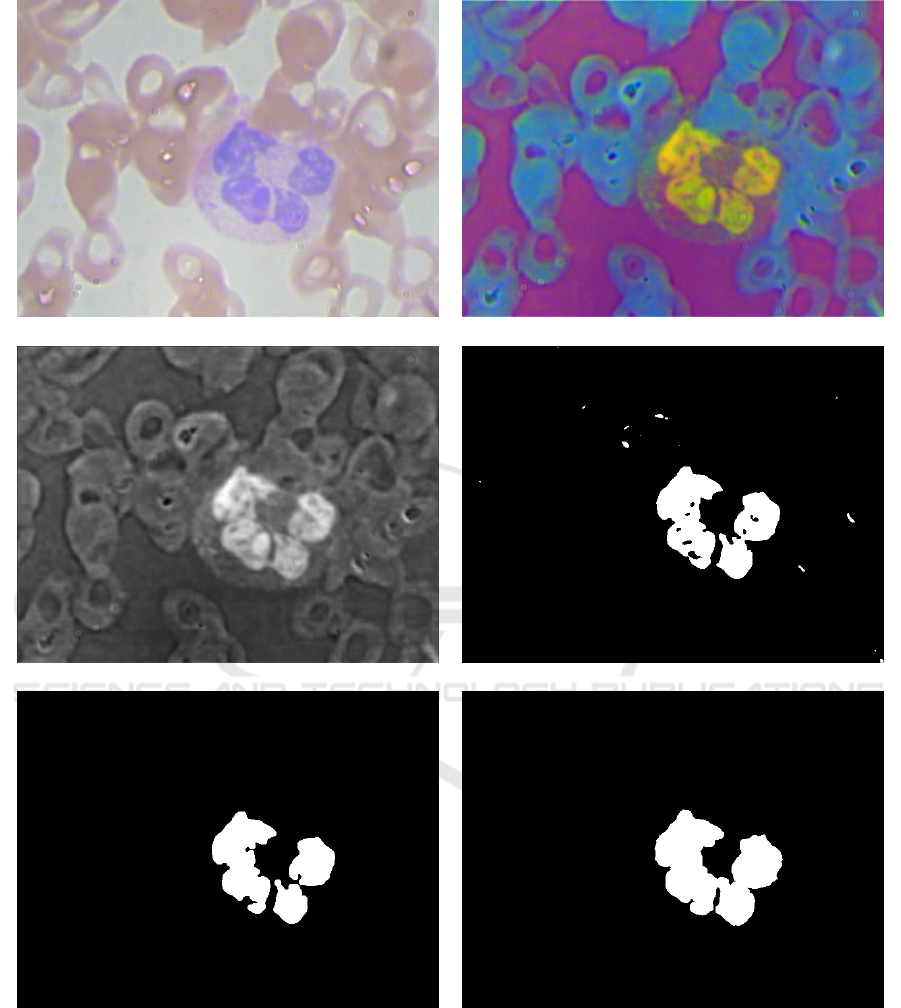
Figure 1: Proposed framework for leukocytes segmentation: (a) Input image; (b) Image deconvolution; (c) Filtered image; (d)
Image after Binarization; (e) Leukocytes selection; (f) Border refinement.
proposed methodology. In order to segment the image
we trained a PSO algorithm to optimize the 27 float-
ing point values that composes a 3×3×3 kernel filter.
To accomplish that we randomly select 10% of the
sample in the dataset for training. As for the fitness
function, the PSO algorithm aimed to search for the
kernel filter that maximized the average Jaccard index
of the images. To execute the PSO algorithm we con-
sidered a population size of 100 individuals running
for 5400 generations. In the sequence, we applied all
steps of the proposed framework in all images of the
dataset in order to report the average results obtained.
Unsupervised Segmentation of Leukocytes Images using Particle Swarm
443
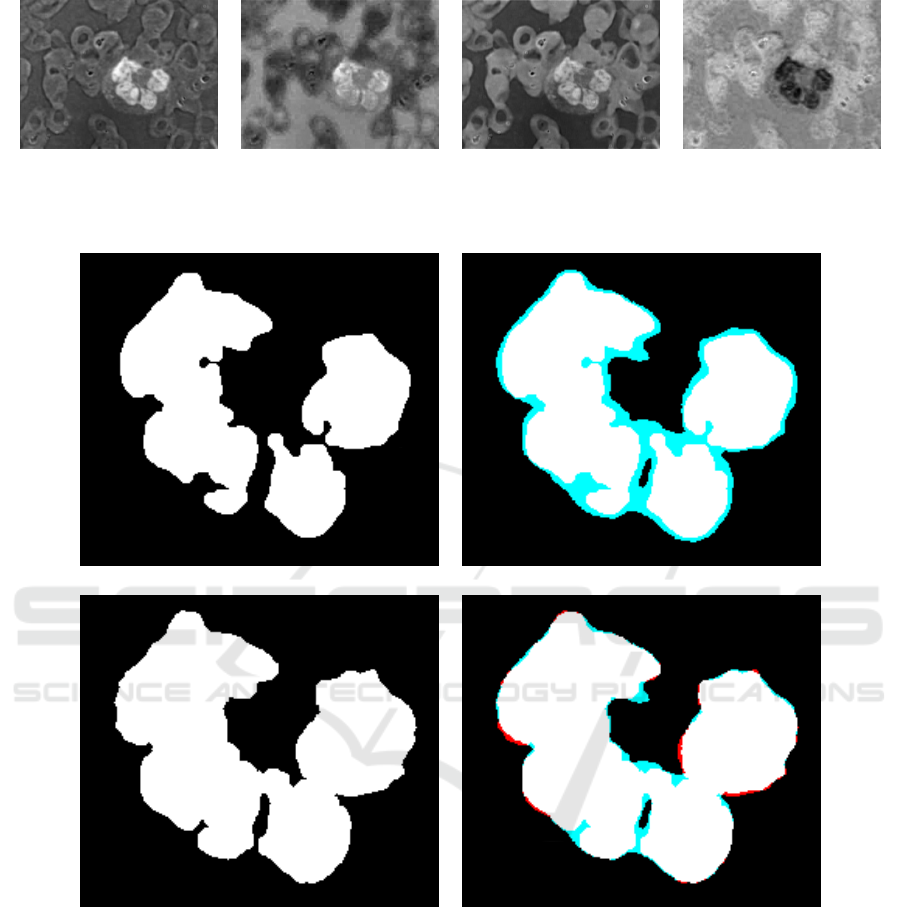
(a) (b) (c) (d)
Figure 2: Comparison of the proposed filtering scheme with image deconvolution: (a) Resulting filtered image; (b) Hema-
toxylin; (c) Eosin; (d) DAB.
(a) (b)
(c) (d)
Figure 3: (a) Selected Leukocytes; (b) Comparison of (a) with the markings provided by experts; (c) Image (a) after border
refinement; (d) Comparison of (c) with the markings provided by experts. Blue color indicates a region undetected by our
method while red color indicates a region wrongly detected.
In our proposed framework, we use a binarization
approach to convert the filtered image S into a binary
one. During the training of our PSO optimized kernel
filter we used Otsu method (Otsu, 1979) to compute
the global threshold for the image binarization. How-
ever, Otsu may not be the best choice for this given
problem so that we compared the results obtained by
Otsu with a more recent method, Modified Valley Em-
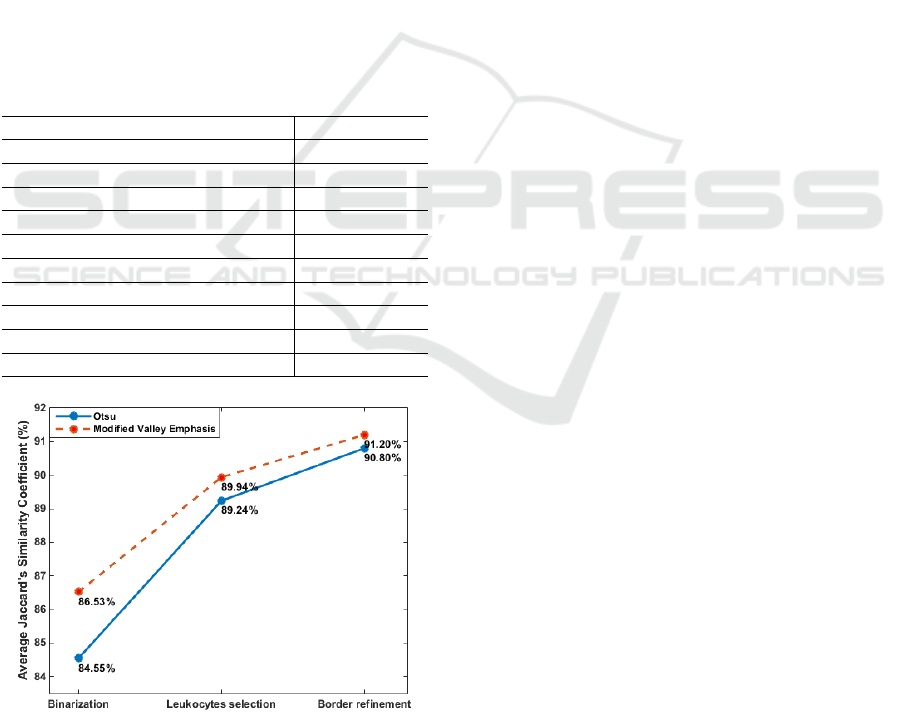
phasis (MVE)(Fan and Lei, 2012). Figure 4 presents
the average Jaccard index obtained for both Otsu and
Modified Valley Emphasis methods at each stage of
the proposed approach.
Results show that Modified Valley Emphasis
method performs better than Otsu in all steps of our
approach. However, the difference of performance is
the highest at the first step (i.e., binarization), where
the difference is of ≈ 2.00%. This indicates that Mod-
ified Valley Emphasis method is capable to achieve
VISAPP 2021 - 16th International Conference on Computer Vision Theory and Applications
444
a threshold value that is more suitable for the fil-
tered image S and its content, even though the PSO
was trained using Otsu. As we execute the other
steps of our framework (leukocytes selection and bor-
der refinement), this difference of performance de-
crease until only 0.40%. This is expected as these are
post-processing steps and they were proposed to com-
pensate small segmentation problems that could arise
from the initial step, such as the presence of noise or
a very smooth or poorly defined leukocyte border.
To improve our analysis we compared our ap-
proach with the results obtained by other segmenta-
tion methods found in literature. Table 1 show that
our approach is capable to surpass all compared ap-
proaches, independent of the binarization approach
used. When we consider our best result (i.e., Modified
Valley Emphasis), our framework achieves an aver-
age result 1.10% superior than the best compared ap-
proach, thus corroborating the effectiveness of our ap-
proach to segment leukocytes disregarding their size,
shape and spatial distribution of the cells in the image.
Table 1: Jaccard index achieved by different approaches.
Method Jaccard index
Paper (Rezatofighi et al., 2009) 83.20%
Paper (Madhloom et al., 2010) 55.90%
Paper (Mohamed and Far, 2012a) 85.40%
Paper (Mohamed and Far, 2012b) 80.60%
Paper (Mohamed et al., 2012) 79.70%
Paper (Tosta et al., 2015) 89.89%
Paper (Tareef et al., 2016) 85.10%
Paper (Tareef et al., 2017) 90.10%
Proposed approach (Otsu) 90.80%
Proposed approach (MVE) 91.20%
Figure 4: Average Jaccard index obtained for two differ-
ent binarization methods at each stage of the proposed ap-
proach.
6 CONCLUSION
In this paper we presented a methodology to detect
and segment nuclear structures in leukocytes. To ac-
complish that our methodology uses a PSO algorithm
to estimate an optimal kernel filter, which is applied
after the color deconvolution of the image, so that it is
capable to explore and combine local features in dif-
ferent stain channels. Evaluation using a set of 367
images containing leukocytes and other blood struc-
tures showed that the estimated kernel filter highlights
the structures composing the leukocyte so that sim-
ple thresholding techniques are able to perform im-
age segmentation with high accuracy, surpassing the
results of various compared approaches found in lit-
erature.
ACKNOWLEDGEMENTS
Andr
´
e R. Backes gratefully acknowledges the fi-
nancial support of CNPq (Grant #301715/2018-1).
This study was financed in part by the Coordenac¸
˜
ao
de Aperfeic¸oamento de Pessoal de N
´
ıvel Superior -
Brazil (CAPES) - Finance Code 001.
REFERENCES
Al-Dulaimi, K., Banks, J., Nguyen, K., Al-Sabaawi, A.,
Tomeo-Reyes, I., and Chandran, V. (2020). Segmen-
tation of white blood cell, nucleus and cytoplasm in
digital haematology microscope images: A review-
challenges, current and future potential techniques.
IEEE Reviews in Biomedical Engineering.
Banik, P. P., Saha, R., and Kim, K.-D. (2020). An automatic
nucleus segmentation and cnn model based classifica-
tion method of white blood cell. Expert Systems with
Applications, 149:113211.
dos Anjos, A. and Shahbazkia, H. (2008). Bi-level image
thresholding - A fast method. In BIOSIGNALS (2),
pages 70–76. INSTICC - Institute for Systems and
Technologies of Information, Control and Communi-
cation.
Fan, J.-L. and Lei, B. (2012). A modified valley-emphasis
method for automatic thresholding. Pattern Recogni-
tion Letters, 33(6):703–708.
Ghose, S., Oliver, A., Mart
´
ı, R., Llad
´
o, X., Vilanova, J. C.,
Freixenet, J., Mitra, J., Sidib
´
e, D., and Meriaudeau,
F. (2012). A survey of prostate segmentation method-
ologies in ultrasound, magnetic resonance and com-
puted tomography images. Comput. Methods Pro-
grams Biomed, 108(1):262–287.
Kennedy, J. and Eberhart, R. (1995). Particle swarm opti-
mization. In Proceedings of ICNN’95 - International
Conference on Neural Networks, volume 4, pages
1942–1948 vol.4.
Unsupervised Segmentation of Leukocytes Images using Particle Swarm
445

Kutlu, H., Avci, E., and
¨
Ozyurt, F. (2020). White blood
cells detection and classification based on regional
convolutional neural networks. Medical hypotheses,
135:109472.
Madhloom, H. T., Kareem, S. A., Ariffin, H., Zaidan,
A. A., Alanazi, H. O., and Zaidan, B. B. (2010). An
automated white blood cell nucleus localization and
segmentation using image arithmetic and automatic
threshold. Journal of Applied Sciences, (10):959–966.
Mohamed, M., Far, B., and Guaily, A. (2012). An efficient
technique for white blood cells nuclei automatic seg-
mentation. In SMC, pages 220–225. IEEE.
Mohamed, M. M. A. and Far, B. (2012a). A fast technique
for white blood cells nuclei automatic segmentation
based on gram-schmidt orthogonalization. In ICTAI,
pages 947–952. IEEE Computer Society.
Mohamed, M. M. A. and Far, B. H. (2012b). An enhanced
threshold based technique for white blood cells nuclei
automatic segmentation. In Healthcom, pages 202–
207. IEEE.
Ng, H. F. (2006). Automatic thresholding for defect detec-
tion. Pattern Recognition Letters, 27(14):1644–1649.
Otsu, N. (1979). A threshold selection method from gray-
level histograms. IEEE Transactions on Systems,
Man, and Cybernetics, 9(1):62–66.
Rezatofighi, S. H., Soltanian-Zadeh, H., Sharifian, R., and
Zoroofi, R. A. (2009). A new approach to white blood
cell nucleus segmentation based on gram-schmidt or-
thogonalization. In ICDIP, pages 107–111. IEEE
Computer Society.
Ruifrok, A. C., Johnston, D. A., et al. (2001). Quantifica-
tion of histochemical staining by color deconvolution.
Anal Quant Cytol Histol, 23(4):291–299.
Sezgin, M. and Sankur, B. (2004). Survey over image
thresholding techniques and quantitative performance
evaluation. Journal of Electronic Imaging, 13:13 – 13
– 20.
Tareef, A., 0001, Y. S., Cai, T. W., 0021, Y. W., Feng, D. D.,
and Chen, M. (2016). Automatic nuclei and cytoplasm
segmentation of leukocytes with color and texture-
based image enhancement. In ISBI, pages 935–938.
IEEE.
Tareef, A., 0001, Y. S., Feng, D., Chen, M., and Cai, W.
(2017). Automated multi-stage segmentation of white
blood cells via optimizing color processing. In ISBI,
pages 565–568. IEEE.
Tosta, T. A. A., de Abreu, A. F., Traven
˜
A§olo, B. A. N.,
do Nascimento, M. Z., and Neves, L. A. (2015). Un-
supervised segmentation of leukocytes images using
thresholding neighborhood valley-emphasis. In 28th
IEEE International Symposium on Computer-Based
Medical Systems, CBMS 2015, Sao Carlos, Brazil,
June 22-25, 2015, pages 93–94. IEEE Computer So-
ciety.
Wang, C., 0004, J. S., 0003, Q. Z., and Ying, S. (2017).
Histopathological image classification with bilinear
convolutional neural networks. In EMBC, pages
4050–4053. IEEE.
VISAPP 2021 - 16th International Conference on Computer Vision Theory and Applications
446
