
Comprehensive Statistical Analysis on Estimated Errors of Averagine
Model for Intact Proteins
Yuanxi Che
1,2
1
School of Information Science and Technology, Northwest University, Shaanxi, China
2
Department of Computer Science and Electronic Engineering, University of Essex, Colchester, U.K.
Keywords: Averagine Model, Average Mass, Monoisotopic Mass, Intact Protein.
Abstract: Averagine Model (AM) is a very popular and practical computing tool in top-down proteomics, which is
usually employed to predict the monoisotopic mass for an unknown protein or a peptide to be of interest.
However, with the significant advancement on high-resolution and high-accuracy mass spectrometry (MS)
instrumentation, AM’s limitation on its accuracy became more and more significant. Here we studied
statistically AM’s mass errors using all proteins in the Human databases. Both the mass errors of estimated
monoisotopic mass and average mass for all proteins from the Human protein database are analysed
comprehensively in this paper. According to the results obtained, we then found the error range difference
between these two different types of mass errors and then we further analysed the error contributions on the
individual elemental level of C, H, N, O and S which constitute the proteins. Our analysis will provide an
experimental basis to further improve the average model in the top-down proteomics.
1 INTRODUCTION
Modern mass spectrometry (MS) is widely utilized to
identify proteins in the field of proteomics no matter
the strategy being used is bottom-up or top-down. The
isotopic clusters of the protein in MS data are
typically the most abundant information also being
the most potential element when protein needs to be
identified.
Under the circumstance of the known protein
identity, i.e., the protein formula needed to be studied,
of which the isotopic distribution can be obtained by
theoretical predictions using the simulation
algorithms, such as emass. However, if the identity
of one protein is unknown, in order to search it out,
we will need to estimate its monoisotopic or average
mass from the database by using its molecular weight
(MW). To solve these types of problem, the averagine
model, utilizing a kind of an average amino acid, has
been developed and widely used in estimating
molecular weight of proteins by using the MS data.
Although this model can be utilized to identify
proteins in a relatively high accuracy for the most of
times, it still has some limitations when applied to
modern MS data which has level of high resolution
and high accuracy.
Therefore the model of averagine is generally
required when an unknown protein is needed to be
identified. Averagine is an average amino acid based
on the occurrences of all amino acids from protein
database (PIR) and it was proposed in order to
estimate the average mass of the targeted protein and
find their corresponding estimated formula.
Through past study, it could be discovered that
although Averagine Model (AM) may estimate the
true average molecular mass with an error up to 0.5
Dalton, it can still be improved further to reduce this
mass errors.
The issue that will be addressed in this paper is
about how to reduce the estimated errors in the real-
world MS data sets when applying AM to proteins
with a relatively large MW.
Firstly, the mass error distribution which covered
the full mass range for all proteins from the Human
database was computed. After this more emphasis
was put on the average mass errors as well as the
monoisotopic mass errors estimated by AM.
The reason why we chose these two types of mass
errors is that these two types of protein masses are the
most typical and crucial information that are required
to identify a certain protein when searching the
database.
136
Che, Y.
Comprehensive Statistical Analysis on Estimated Errors of Averagine Model for Intact Proteins.
DOI: 10.5220/0010299001360139
In Proceedings of the 14th International Joint Conference on Biomedical Engineering Systems and Technologies (BIOSTEC 2021) - Volume 3: BIOINFORMATICS, pages 136-139
ISBN: 978-989-758-490-9
Copyright
c
2021 by SCITEPRESS – Science and Technology Publications, Lda. All rights reserved
Later in order to improve the AM model, the
analysis of the individual elemental contributions is
furthered which is to estimate the errors may be
caused from C, H, N, O and S.
2 EXPERIMENT AND METHOD
Comprehensive simulation analysis can help us find
the essential pattern hidden behind the complicated
data sets in most cases. To find out the regular
patterns of mass errors estimated when applying the
averagine model on all human proteins, an in-house
program was developed using the MATLAB toolbox
which has multiple functions and bioinformatics tools
that can deal with massive amount of protein data, as
well as its capacity of transferring massive digital
results to visualized diagrams such as scatters and
bars conveniently.
The averagine model is used in the experimental
fundamentals which in this case offers the basic idea
of how to estimate unknown large proteins as well.
Here the molecular information for each protein
in human protein database were utilized and then the
estimated masses were compared with the actual
theoretical masses calculated using the formula
provided from the database. Both the average mass
errors and the monoisotopic mass errors are obtained
along with the different mass ranges.
All the statistical calculations presented here are
based on Human protein database, which is a
collection of 20,341 sequences of proteins (June,
2019). The primary task of our study is to get the mass
error distribution covered the full mass range, which
will provide the experimental foundation to improve
AM by reducing its estimated errors when applied to
large proteins with MW larger than 30 kDa.
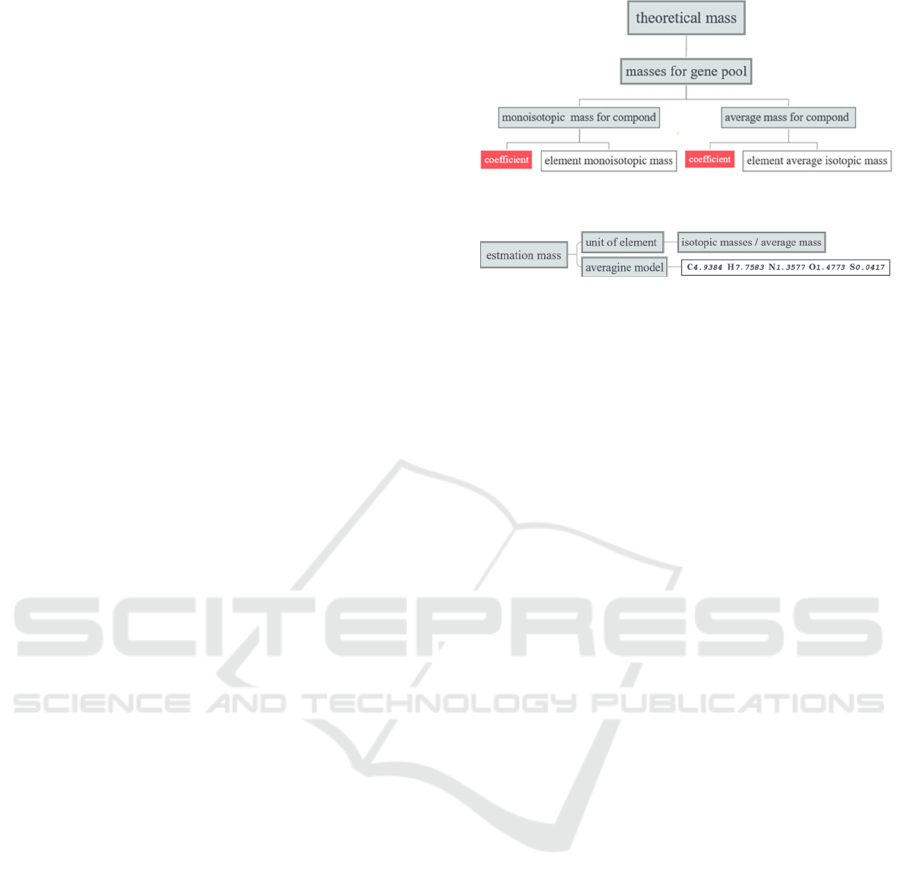
2.1 Main Analysis Process
To get the estimated mass errors, four computational
steps are conducted as below (figure 1):
Step 1: Computing every formula of protein in the
Human Protein Database;
Step 2: Using the obtained formula result from the
first step and the emass algorithm to compute the
theoretical isotopic distributions;
Step 3: Using the AM and the average mass
provided in the second step, estimate the formula
for each protein;
Step 4: Generating two types of mass errors, i.e.,
average mass errors and monoisotopic mass errors.
Figure 1: Diagram of the four computing steps.
Figure 2: Key process of AM application.
Although average mass is widely used for large
molecule mass estimation, the monoisotopic mass
still represents the most accurate mass for a
compound.
Here in this experiment, two sets of errors are
computed through the four computing processes
introduced which are monoisotopic and average
element mass. (figure 2)
The reason why for taking both errors in
consideration is that the former error could offer hints
on how to improve AM while the latter error offers
the information related to the unknown large
molecules validated by the information from the
database.
2.2 Simulation on the Estimated Mass
Errors for All Proteins from
Human Database
We statistically computed two types of mass errors
between Averagine-fit and theoretical isotopic
clusters. According to the distribution, we then
compared the differences between the mass error
ranges for both average masses and monoisotopic
masses. The results showed that the mass accuracy
can be improved remarkably for large proteins in
terms of the monoisotopic mass errors.
However, this is not enough for high-resolution
mass spectrometers, therefore, futher analysis of the
elemental contribution are provided to estimate the
mass errors from all individual elements which are C,
H, N, O, and S.
More detailed results will be shown in next
section.
3 RESULT AND CONCLUSION
As stated previously, the estimated average mass
Comprehensive Statistical Analysis on Estimated Errors of Averagine Model for Intact Proteins
137
errors and monoisotopic mass errors for all proteins
in the human database are firstly analysed
respectively, which their distributions covered the
whole mass range were acquired.
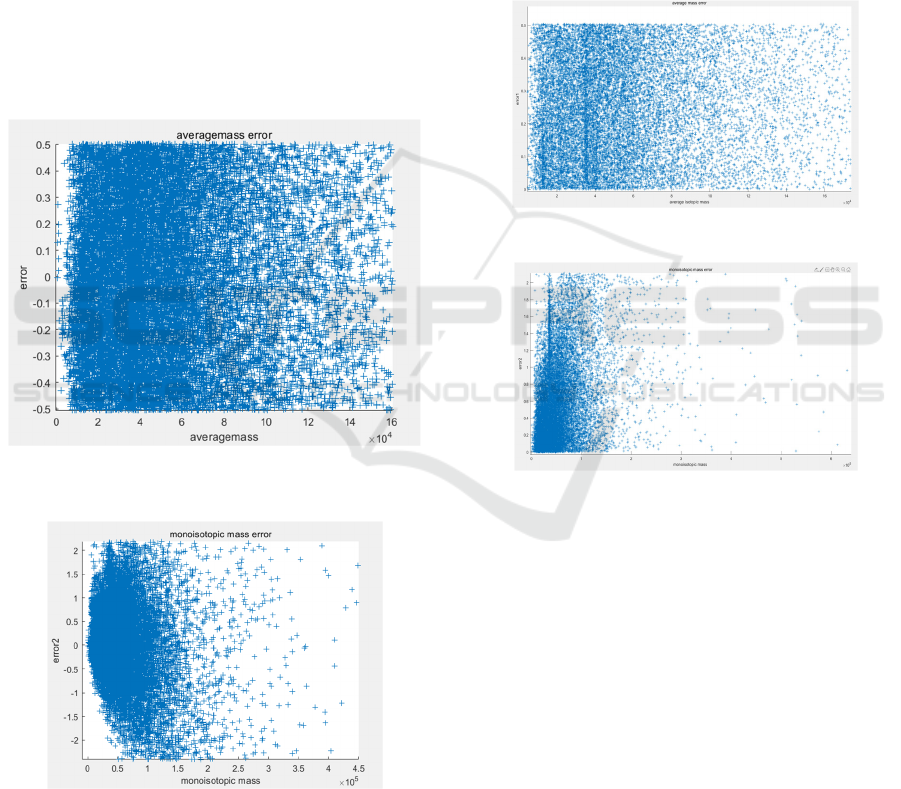
3.1 Estimated Mass Error
Distributions
Figure 3 shows the relationship between the estimated
average mass error in Dalton (vertical axis) and the
corresponding average mass (also in Dalton,
horizontal axis) for the 20,431 proteins in Human
Protein Database.
Each blue-cross designates one protein. For this
distribution, we can find the range of errors is
between [-0.5, 0.5] Dalton, which is due to the
estimated number of Hydrogen atom when
computing errors in the rounding process of AM.
Figure 3: The estimated average mass error using AM with
the average mass (unit: Dalton).
Figure 4: The estimated monoisotopic mass error with the
monoisotopic mass (unit: Dalton).
To our surprise, these errors’ ranges are much
larger than those of the corresponding average mass
errors, about [-2.5, 2.5] Dalton. We speculate that this
difference is caused by the different contribution of
the constituent elements: C, H, N, O and S (will be
detailed in later section).
We then extracted the absolute value of these two
types of errors, i.e. the average mass errors and the
monoisotopic mass errors, as shown in Figures 5 and
6. Unlike the relatively small errors, less than 0.5
Dalton for average mass errors across the full mass
range, the monoisotopic mass error is smaller under
the low mass, such as below 3000 Dalton.
However, the errors become larger as the mass
increases, which limited the application of AM when
applied to larger protein molecules.
Figure 5: Absolute monoisotopic mass error distribution.
Figure 6: Absolute average mass error distribution.
3.2 Comparisons of Mass Errors
between Close Masses
The masses with their corresponding estimated errors
on two straight lines around 13,000 Dalton and
35,000 Dalton are shown in Figure 7 after zooming in
for average mass error (left) or monoisotopic mass
error (right). Under this circumstance, we found that
even for the similar mass of molecules, they have
totally different estimated errors, whether for average
mass or monoisotopic mass. This has indicated that
the different element may play a differently important
role in the total contribution of mass errors caused.
In order to give a real-world validation of this
phenomenon, the function “isotopicdist” of
MATLAB was used to this comprehensive analysis.
BIOINFORMATICS 2021 - 12th International Conference on Bioinformatics Models, Methods and Algorithms
138
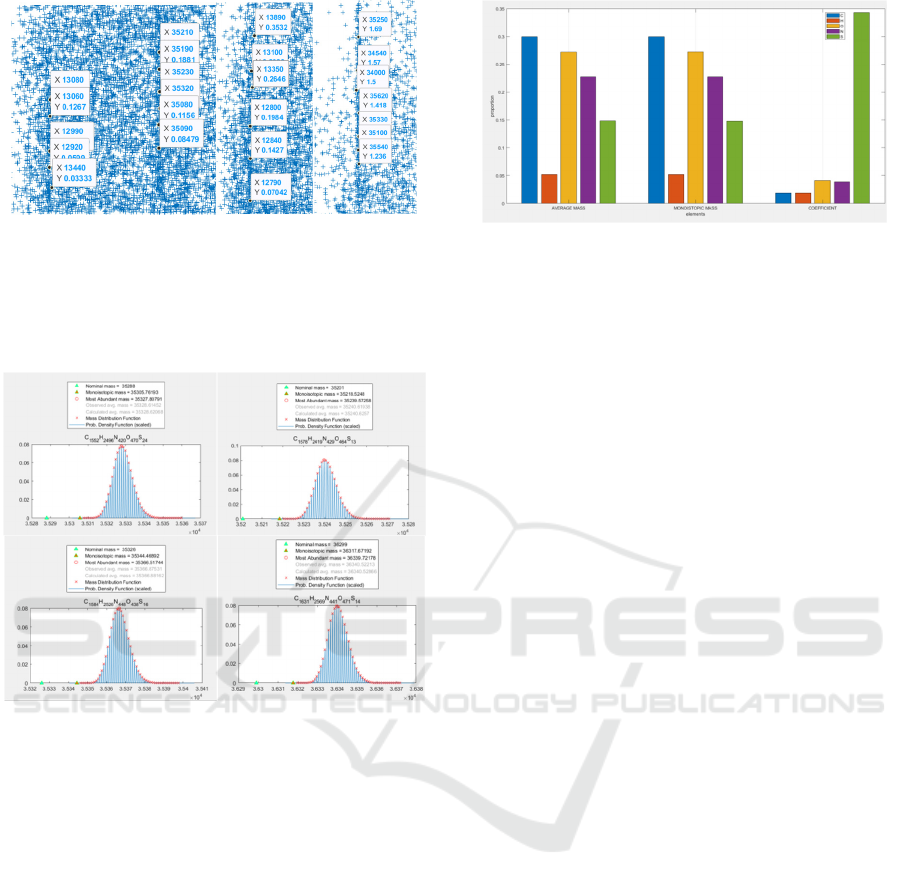
Figure 7: Examples of estimated error distributions for both
average and monoisotopic mass.
Figure 8 shows that similar nominal masses could
generate a remarkable difference for their most
abundant masses.
Figure 8: Computed isotopic distributions using
isotopicdist with the protein nominal mass around 35,000
Dalton.
3.3 Error Contribution on the Element
Level
In order to get the information on which element
contributes most to the total estimated errors, we also
analysed the individual contribution to mass errors on
the elemental level for all those 20,431 proteins from
the database.
Figure 9 shows the element contribution based on
isotopic masses, which indicates that Carbon plays
the most important mass role while Sulfur plays the
most important role based on element coefficient.
However, in no matter what circumstances,
Hydrogen always contributes the least in a single
element mass.
Figure 9: Element contribution using different relative error
calculation.
4 CONCLUSION
In order to further improve the accuracy of averagine
model (AM), we systematically analysed two types
of mass errors, i.e. monoisopis mass errors and
average mass errors estimated by AM.
A method of calculation of massive error
simultaneously has been developed through the
process of attempting to figure out what element
gives more contribution when forming a compound.
Our results on 20,431 human proteins (all of
human proteins) shows that the mass error ranges are
remarkablely different form these two types of errors.
Analysis of ours on the elemental level indicates
that the element Carbon has the most important mass
contribution while Sulfur contributes most in terms
of the element coefficients.
All of these studies will provide a clue on how to
further improve the performance of the averagine
model.
REFERENCES
Alan, L, Rockwood., Perttu, Haimi., 2006. Efficient
Calculation of Accurate Masses of Isotopic Peaks. J.
Am. Soc. Mass Spectrom.
Michael, W, Senko., Steven, C., Beu, Fred., McLafferty, W.,
1995. Determination of Monoisotopic Masses and Ion
Populations for Large Biomolecules from Resolved
Isotopic Distributions. J. Am. Soc. Mass Spectrom.
Comprehensive Statistical Analysis on Estimated Errors of Averagine Model for Intact Proteins
139
