
Surface EMG-based Profiling and Fatigue Analysis of the Biceps
Brachii Muscle of Cricket Bowlers
Muhammad Usama Rizwan, Nadeem Ahmad Khan, Rushda Basir Ahmad and Muneeb Ijaz
Department of Electrical Engineering, Lahore University of Management Sciences, Lahore, Pakistan
Keywords: EMG, Mean Power Frequency, Fatigue Analysis, Cricket Bowling, Player Profile, Player Development.
Abstract: Cricket bowling action is a complex repetitive task involving multiple muscles. In this paper we present a
protocol to analyse accumulated localized fatigue in muscles during cricket bowling action. Biceps Brachii
(BB) muscle in case of fast delivery for a novice player is analysed to illustrate the methodology.
Synchronized video recording with the surface EMG signal was captured from the medial position of the BB
muscle to enable segmentation of the EMG signal in six intervals corresponding to the six phases of the
bowling action. This enables study of the activation pattern of the muscle along with the fatigue trend during
bowling. Both integrated EMG and Mean Power frequency (MPF) are used as measures to analyse fatigue.
Though we have plotted the trends for a single muscle, a similar exercise should be repeated for all important
muscles involved. Analysing localized fatigue in individual muscles is important for injury prevention as well
as player performance development. It can help to see how individual muscle fatigue contributes in declining
performance during cricket bowling. Such an analysis can also be used to support minimum bowling overs
and suitable inter-over breaks for a specific bowler with regard to injury prevention and optimal performance.
1 INTRODUCTION
As sports are becoming more and more competitive
the maximum player performance has become
inevitable in order to outsmart others in this
competition. The repetitive muscles activity results in
the fatigue accumulation in the muscles. The fatigue
in the muscle results in the retarded muscles
efficiency and that is why the detection of fatigue in
athletes is a crucial task. The literature reviews in this
area suggest that a lot of attempts had been made to
model fatigue accumulation and fatigue graphs have
been plotted using non-invasive biopotential
techniques such as Electromyography (EMG). This
paper aims at EMG profiling of cricket bowlers of
Fast category and using it for performance
development of cricket bowlers in combination with
other captured sensory data.
The study includes the processing of EMG signals
as well as video data from a subject to correlate the
two and bring them in a form that enables us to see
how individual muscle fatigue contributes in
declining performance during cricket bowling. The
two sources of data have to be synchronized first in
order to develop correlation between them. EMG
signals were recorded using Shimmer device, which
is a commercially available device for acquiring bio-
potential data. The data is logged and stored in
Structured Query Language (SQL) based database
with configurable sampling rate. Whereas, videos
were recorded using high speed camera set up and
interfaced to VICON software by NEXUS.
This paper contributes with increase in the Quality
of Fast Bowling by giving a detailed interpretation of
the results concluded from recorded data. Detection
of partial range of performance can be done while
analysing the data, the level of muscle fatigue can be
interpreted using results. A degradation in the quality
of bowling in fast bowling, over the successive bowls
is an indicator of the rising level of fatigue in muscles.
In this way weak muscles can be identified that are
contributing to the decreasing performance and
deteriorating the quality of bowling. Such trends can
help us indicate severe injuries in players and reduce
such injuries by timely measures.
With the help of the protocol defined in this paper,
profiling will indeed help in Player development by
supporting a sports trainer who will be analyzing
current acquisition data with player profile. If trainer
identifies that muscle activation has reduced,
dedicated muscle exercises will be advised. If there is
a flaw in technique, that can be identified using video
192
Rizwan, M., Khan, N., Ahmad, R. and Ijaz, M.
Surface EMG-based Profiling and Fatigue Analysis of the Biceps Brachii Muscle of Cricket Bowlers.
DOI: 10.5220/0010250801920199
In Proceedings of the 14th International Joint Conference on Biomedical Engineering Systems and Technologies (BIOSTEC 2021) - Volume 4: BIOSIGNALS, pages 192-199
ISBN: 978-989-758-490-9
Copyright
c
2021 by SCITEPRESS – Science and Technology Publications, Lda. All rights reserved

analysis, then player will be working on correcting
the techique of bowling action that will lead to player
development.
The compact model for a bowling data cannot be
materialized due to inter-subject variability and wide
range of bowling actions. The solution to this is that
instead of developing a single model for Fast bowlers,
individual profiles of players should be built, and
each player should be analyzed based on his own
profile. For setting some standard for comparison a
profile of an elite can be logged but caveat will still
be inter-subject variability.
2 RELATED WORK
A lot of research has been carried out in the field of
sports kinematics and EMG. Our study expands on
the present work by integrating EMG techniques with
existing bio-mechanical techniques.
Surface Electromyography (EMG) is the science
and basic technique used for the quantification of
muscle activity during movement which is popular
being a non-invasive technique. It is a hassle-free
procedure that can be used to determine the amount
of muscle activation throughout a given movement
and its activation timings and is an essential tool in
biomechanical and biomedical investigations.
Normally the EMG signal is between 5-450 Hz
window. The importance of muscles is based on the
EMG activity shown by them. Based on above
discussion, muscle showing the higher trend during
fast cricket bowling should be selected. Therefore,
Biceps Brachii (BB) muscle has been opted for the
analysis.
The studies by (Schmidt et al.,1999) and (Lloyd
et al.,2000) observe only the physical movement of
upper extremities. Since sports techniques are much
more elaborate than joint angles, EMG signals can be
used to provide more information and insight into
different actions, as well as their relation to muscle
fatigue and injuries. EMG signals refer to the
electrical signals generated when a muscle contracts,
and are measured using EMG sensors.
During the delivery of the ball, the most upper
limb muscles; BB, pectoralis major, deltoid,
trapezius, latissimus dorsi, infraspinatus, trapezius,
serratus anterior, and supraspinatus muscles are
mostly active. (Ahamed et al.,2014)
The EMG frequency decreases with time,
indicating an increasing degree of fatigue. This
provides us with a useful method of injury prevention.
The relationship between EMG and fatigue is, as
(Florimond,2008) has written, that “muscle fatigue is
accompanied by a decrease in motor unit firing rate
and conduction velocity.” This result has been
observed in many studies, including those by (Raez et
al.,2006). Thus, the median and mean frequencies
decrease as fatigue increases therefore, muscle
fatigue index has been defined using the mean and
median frequency of the EMG spectrum. The muscle
fatigue index decreases as contraction time increases.
While both median and mean frequencies may be
used as the fatigue index, as per (Florimond,2008),
median frequency is less sensitive to noise and more
sensitive to biomechanical factors so using mean
power frequency can be used for analysis.
Furthermore, as another indicator of fatigue, the
EMG amplitude is also found to increase with fatigue.
This is due to additional fibres being used to generate
the same level of force. EMG amplitude is used to
indicate fatigue when movement is required, in
exercises (Florimond,2008). Similar results have
been drafted by (Shorter et. al. 2010) for
interpretation of injury which is done through muscle
activity.
(Ahamed et al.,2014) have defined phases of a
bowling action as Run-up, Pre-Delivery Stride, Mid
Bound, Back-Foot Contract, Front-Foot Contract,
Release of the Ball and Follow through and compared
different activation trends during these phases.
3 METHODOLOGY AND
PROTOCOL
This study focuses only on BB muscles but same or
similar procedure can be used to analyse fatigue in
other muscles such as latissimus dorsi and soleus
muscles also. We plan to design a protocol for
professional players and then increase number of
subjects under study.
3.1 Subject Preparation
The subject is given an overview of the experiment if
he is interested a consent form is to be signed by the
subject. Then the Subject Data Performa is filled in
order to have an idea of BMI and exercise history of
the subject. The subjects are specifically inquired
about any history of neuromuscular injury. The initial
biceps envelop recordings are made and trial EMG of
subject is recorded using bicep curls experiment to
see that recordability of the muscle of the specific
subject.
A Bicep envelop is formed using measurement
tape and the electrode positions are marked. A typical
Bicep envelop has been shown in Figure 1. The bold
Surface EMG-based Profiling and Fatigue Analysis of the Biceps Brachii Muscle of Cricket Bowlers
193
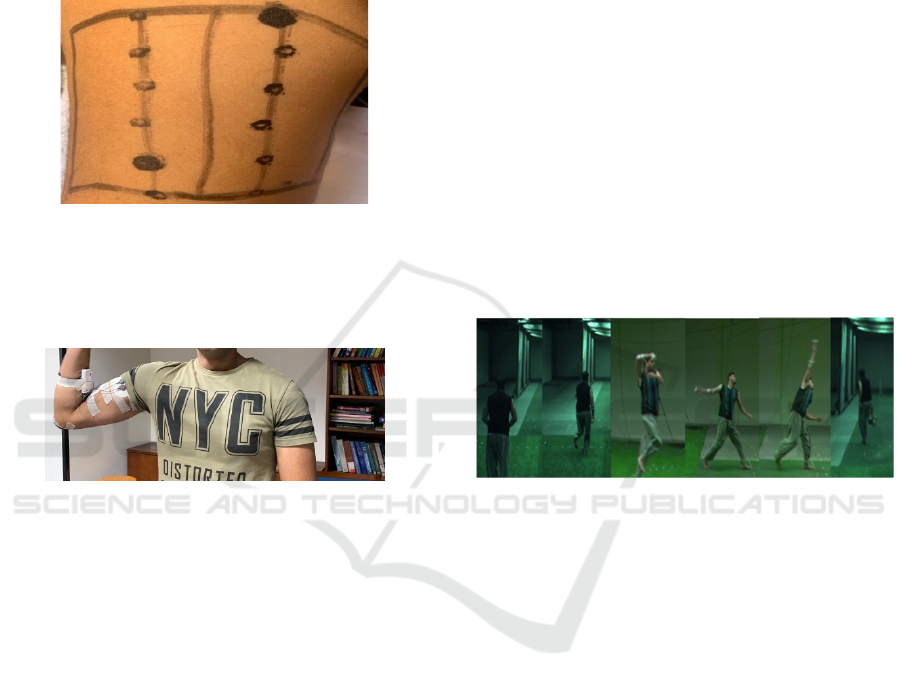
positions in Figure.1 are medial and lateral points, on
has been marked. For reference an electrode position
has been marked near bony structure of elbow. The
skin must be shaved and cleansed with alcohol so that
the EMG signal is noise free. After that the skin is
abraded with skin cleaning gel and alcohol swabs are
rubbed at skin contact point to remove dead skin cell
and to have better data capturing.
Figure 1: Biceps Envelop for Electrode placement.
For the scope of this paper the data acquired from
Medial Channel has been reported. The electrode
placement on subject has been shown in Figure 2.
Figure 2: Electrode Placement on a Subject.
3.2 Protocol of the Experiment
Each bowler must perform 3 overs as a trial. As there
are six deliveries in an over hence 18 bowls per trial
will be recorded. Players should not be exhausted or
should not have muscular tension prior to the trial.
Subjects should remain hydrated throughout the trail.
A rest period of up to five minutes is given between
the each over so to mimic the actual inter-over rest of
a cricket match. The Run ups for each delivery should
be constant.
3.3 Phases of Cricket Bowling
Following are the phase segmentation as described in
by (Ahamed et al.,2014) we segmented our deliveries
in six segments.
a) Run-Up (RU)
The ball is held in the palm with the arm hanging
straight down and the shoulder at 0
o
degree abduction
neutral rotation.
b) Pre –delivery Stride (PS)
Biceps muscle gets slightly contracted through the
external torque provided by low-load weihted ball.
This torque also enables elbow movement and the 90
o
abduction of shoulder muscles with max external
rotation
c) Mid Bound (MB)
Shoulder provided forward elevation and the arms are
lifted at greater than 90
o
angle backwards at ear level.
d) Back and Front-foot Contact (BFC)
Combined phase of Foot contractions. The end of the
stride will be identified by the contact of the back foot
with the crease.
e) Release of Ball (RB)
The point where the ball will be released and the arms
will be in a vertical condition. The elbow extension
strength at 100
o
– 120
o
of elbow joint continues until
the ball is released.
f) Follow-Through (FT)
The action after the ball release until the final interval
of arm motion dissipating the deceleration forces, is a
follow through.
Figure 3: Video Segmentation Results in Phases.
4 EXPERIMENTAL METHOD
The subject identification is important for the
experiment. For this experiment Novice subjects are
required who have at least 90 kph pace and level of
maturity in their line, length and bowling action
during a cricket bowling. The reason for selecting a
Novice Subject is a better fatigue development in the
subjects of this category due to less muscle
endurance.
Data Acquisition was conducted in ICC
Biomechanics Lab LUMS. EMG data lead us to
detailed muscle activity analysis while Video Data
was helpful in segmenting the deliveries of trial into
respective phases by picking the corresponding
segment in EMG data as given by the phase-wise
segmentation of Video of deliveries.
4.1 Set-up
With the help of Shimmer device multiple
Biopotential signals can be measured simultaneously
BIOSIGNALS 2021 - 14th International Conference on Bio-inspired Systems and Signal Processing
194

in real-time. ConsensysPRO software is helpful in
streaming for live visualization. The raw EMG data
can be logged in the personal computer storage and
also to an SD cards. Consensys Software interfaces
EMG data via Bluetooth and it is stored and compiled
in the form of definite sessions by labelling
descriptions and creating new Subjects for each trial.
Each over has six balls, so 18 sessions are stored per
trial. Consensys enables to visualize the live
acquisitions of data. The sampling rate of the software
must be matched with the hardware Shimmer device
in order to have synchronized data. After data logging
in Consensys the data is exported in the form of Excel
file which can be readable in MATLAB. For this
experiment the interfacing and analysis was
performed on MATLAB. It was the main software
used for data cleaning, pre-processing and data
analysis. From these corresponding points, data was
labelled using frame by frame video and the
corresponding per second reading of the data. This
project combines EMG with existing bio-mechanics
protocols. This addition of EMG can help the bio-
mechanics field expand its horizons in terms of player
injury profiles and fatigue analysis
4.2 Data Synchronization
The data from the phases was identified by looking at
the video after the correlation of EMG with the video
data. Shimmer device is used to acquire the EMG data
and is attached via electrodes on the Subject’s biceps
muscle. For this experiment we have selected
sampling rate to be 1024 samples per seconds.
Two high speed cameras, one was placed at the
back side and one was placed side-ways, recorded the
video data. The Video data is segmented into frames
using a MATLAB program. The Frame rate of high-
speed cameras is 125 fps whereas Sampling rate of
Shimmer is equal to 1024 samples per sec. So, each
frame of video data almost equals to 9 samples of
EMG data. First the delivery of a trial is segmented in
the subsequent phases as depicted in Figure 3 and the
starting and ending samples of Video are noted.
Based on the number of frames of video recording
and their relative fraction in the trial, the
corresponding EMG samples are then calculated
using the same fractional ratio in EMG data. Using
this technique and segmentation of video data, the
EMG signal is then segmented in the corresponding
windows of samples using frames of Video Data.
Each window of samples corresponds to the
segmented phase-wise activity of a cricket delivery.
There were some synchronization problems in few
deliveries, which were eliminated using the visual cue
analysis for phase segmentation in EMG data.
4.3 Data Processing
The processing starts from importing Raw EMG data
in MATLAB. A Moving average filter with window
size of 100 samples is applied, which has Low Finite
Impulse Response (FIR) hence is used to smoothen
the signal. After data smoothening, a Band pass filter
of pass band 5-450 Hz is applied using a MATLAB
program. The resultant is a denoised and smoothen
signal. After this the phase segmentation through
Video Data analysis is incorporated. The phases wise
time domain plots are then used to visualize the
activity in each phase. The mean activity of each
phase is then plotted per ball in order to validate the
data as given by the literature review.
The data was changed into its frequency domain
transform and from there, mean frequencies were
calculated. Mean Power Frequency (MPF) of each
phase is also computed an analysed. The Integrated
EMG (IEMG) and MPF activity of each bowl is
computed and cumulative plots per over and per trials
are also plotted.
The Integrated EMG (IEMG) is the cumulative
sum of the absolute value of EMG signal.
𝐼𝐸𝑀𝐺 |𝐸
𝑛
|
The E(n) is the discrete activity function of EMG
signal obtained from the sensor, normally in mV, and
summing this activity function over a definite interval
having N samples gives IEMG of this interval. In
continuous case summation will be mapped to
integration, but as far as the scope of this project is
concerned the data is discrete. As the muscle activity
increases more and more muscle fibers are being
activated and |E(n)| increases, therefore the value of
IEMG increases as subject’s activity is increased.
There is also a normalized version of IEMG which is
called as Sample Normal IEMG and defined as IEMG
per sample of a given data of N samples
𝑆𝑎𝑚𝑝𝑙𝑒 𝑁𝑜𝑟𝑚𝑎𝑙 𝐼𝐸𝑀𝐺
𝐼𝐸𝑀𝐺
𝑁
The Mean activity within a phase gives the
average unipolar IEMG of that phase per unit sample.
By definition, it is same as Sample Normal IEMG.
Mean activity of EMG data having N number of
samples is defined as
𝑀𝑒𝑎𝑛 𝐴𝑐𝑡𝑖𝑣𝑖𝑡𝑦
∑
|𝐸
𝑛
|
𝑁
Surface EMG-based Profiling and Fatigue Analysis of the Biceps Brachii Muscle of Cricket Bowlers
195
Mean Power Frequency is the average frequency
of a signal, which is calculated as the sum of product
of the EMG power spectrum and the frequency
divided by the total sum of the power spectrum.
𝑀𝑃𝐹
∑
𝑓𝑖 𝑃𝑖
∑
𝑃𝑖
where, fmax is the maximum frequency of the data
and fmin is the lowest one. And P(i) denotes the
power spectrum of the signal. There is a noticeable
decreasing trend in the MPF of an exercise. As the
fatigue point approaches the MPF shifts towards the
lower frequencies.
5 RESULTS
Once we had our data and it was processed, we
analysed the data to produce three distinct studies and
results; Phase-wise time segmentation, IEMG
Analysis and MPF analysis A detailed description of
these studies is given below:
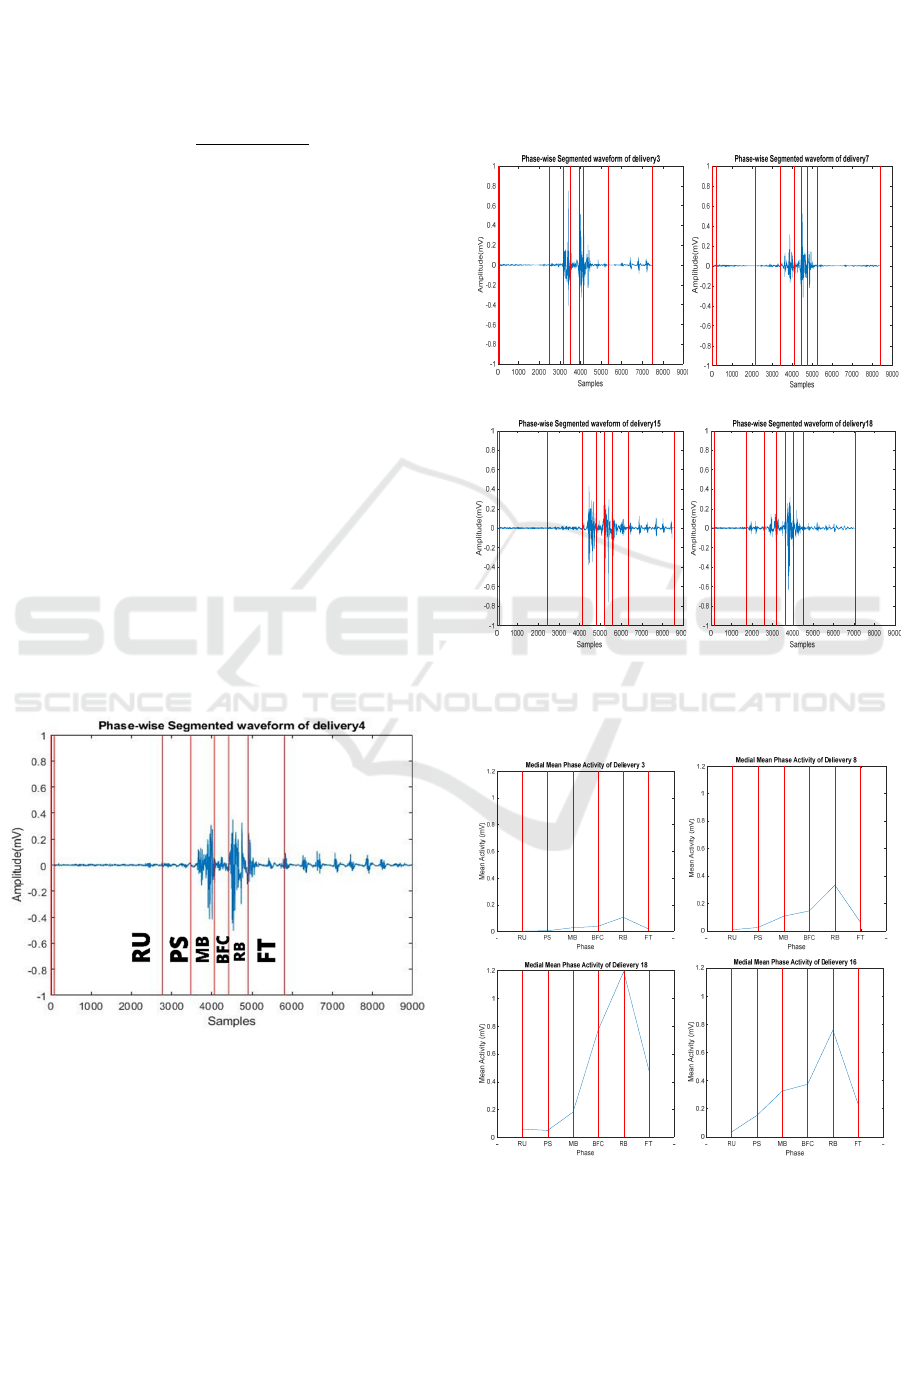
The phase-wise segmentation of the trial was
performed using video analysis data as explained in
section 4.2 in detail. A typical phase segmentation is
shown in Figure 4 where the red lines shows partition
of respective phases. Ball wise time domain
segmentation of some deliveries of the trial are given
Figure 5.
Figure 4: Labelling of six phases of a typical delivery.
By definition, the mean activity is the same as
sample normal IEMG. There is a gradual increase in
the activity as the deliveries progress in the trial.
Figure. 6 provides a detailed Medial mean phase
activity of the trial. It can be observed that there are
significant activity trends in MB, BFC and RB
phases.
After delivery wise phase segmentation analysis,
the averages of all phases have been computed over
the trial and plotted in Figure. 7. The results
elucidates that the RB phase is the most active phase
of cricket bowling followed by BFC and MB as
concluded by (Ahamed et al.,2014).
Figure 5: Segmentation in six phases of different deliveries
in the same sequence as identified in Figure 4.
Figure 6: Phase-Wise Mean Activity of individual Delivery
3 (a), Delivery 8 (a), Delivery 16 (a), Delivery 18 (a) of
Trial.
Delivery 3 Delivery 7
Delivery 15 Delivery 18
BIOSIGNALS 2021 - 14th International Conference on Bio-inspired Systems and Signal Processing
196
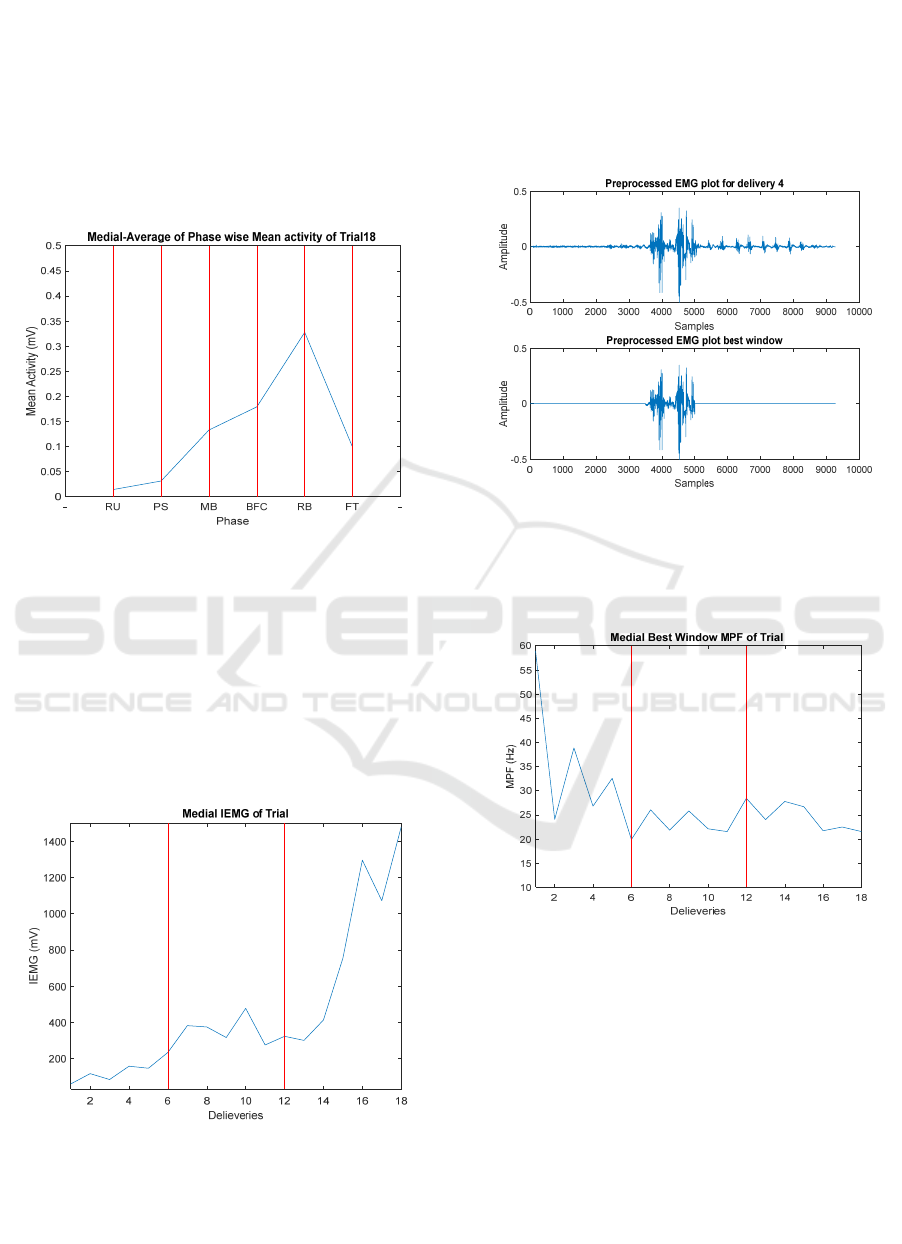
We computed the Average of Phase-wise Mean
activity of 18 Deliveries in Figure. 7, which helps in
player profile analysis and it gives the insight of
activity in each respective phase of cricket bowling.
The reason of not averaging different subjects in this
average is inter-subject variability. Due to Inter-
subject variability we cannot model all fast bowlers
using same model rather we have to analyze
individual player profiles (Rushda et al., 2020).
Figure 7: Average of Phase-wise Mean activity (in mV) of
18 Deliveries.
In Figure.8, complete trial IEMG of Medial channel
data is plotted. The general trends overwise shows an
increasing trend since, more action potentials are
being activated. The gap between the overs stabilize
the activity and due to this 5 to 7 minutes, rest IEMG
decreases before the onset of new over. The red line
marked in the graphs of Figure.8 shows the over
partition.
Figure 8: Delivery-wise IEMG trends for complete
Bowling Action.
The MPF trends are consistent for the segments of
the delivery in which there is relatively high activity
is observed. The Best window is the window of 1500
samples in a delivery having maximum activity as
shown in Figure 9. It is normally MB, BFC and RB
phases of the delivery. The reason for taking best
window is that MPF trends are significantly
decreasing in the areas of high activity i.e. best
window, in a trial.
Figure 9: Time Domain Best window plot of Delivery 4.
Best window MPFs of complete trial has be
plotted in the Figure. 10 while in Figure.11 phase-
wise MPF trends over the complete trial are plotted.
Figure 10: MPF trends of Best Window of complete trial.
Referring to the Figure.10 and Figure.11 the plots
are depicting that during all the phases of a cricket
bowling MPF values have different starting values.
This is due to the fact, that in different phases
different amount of power is required and therefore,
the MPF values have different values during each
phase. Another useful insight due from Figure.10 and
11 is that in all the phase of trial Medial side, the MPF
has a decreasing trend. With the onset of new over,
i.e.; at 7th and 13th delivery due to inter over resting
time the muscle activity is relaxed hence MPF results
are showing slight increases at those points, but the
Surface EMG-based Profiling and Fatigue Analysis of the Biceps Brachii Muscle of Cricket Bowlers
197
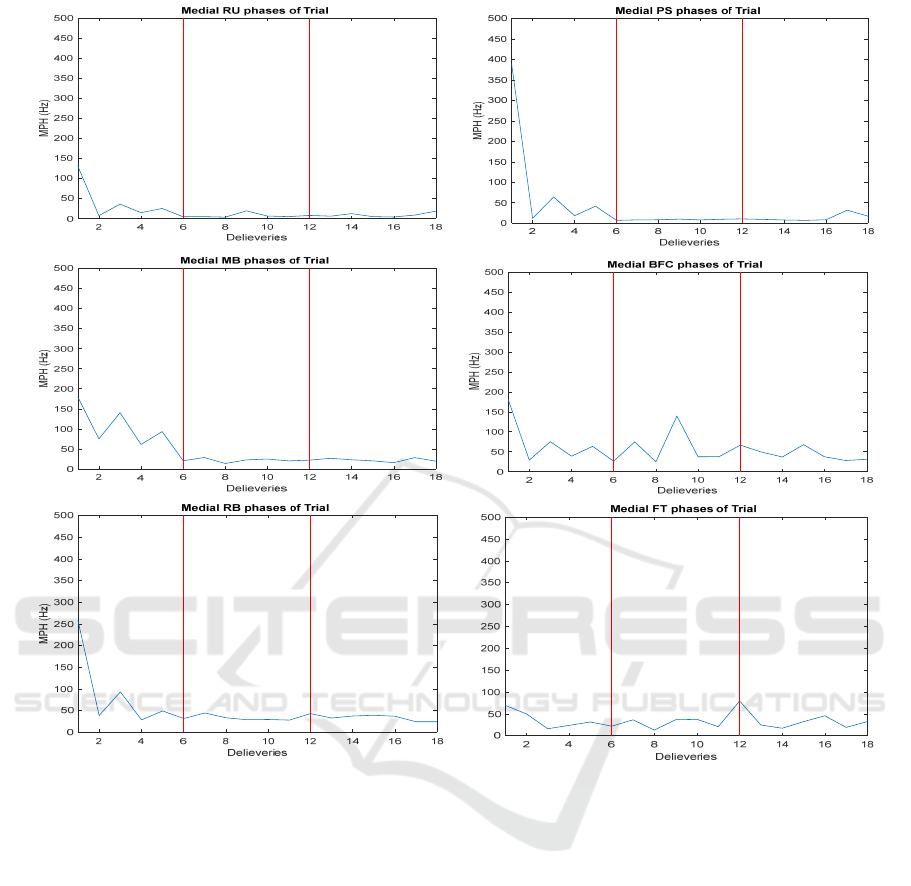
Figure 11: Separate MPF trends of six phases per trail.
overall trend is decreasing as supported by literature
review.
6 DISCUSSION AND
INTERPRETATION OF
RESULTS
MPF has been used as fatigue index, like stated in
(Hwaang et. al., 2016) that as fatigue sets in the
muscle the value MPF decreases to the 60% of its
initial value. This 60% point can be taken as failure
point or onset of fatigue. From Figure 10 and 11 it is
clear that in case of Novice subject the fatigue sets in
during the first over in BB muscle. BB muscle is
active during fast bowling. BB muscle is relatively
more active during MB and RB phases of cricket
Bowling trial. Significant differences between the
phases of fast bowling were found. The entire results
support our hypothesis and validate the trends as
explained through literature reviews.
The Figure 8 depicts that the IEMG trends are
increasing with the increase of number of deliveries
of the trial. During the overs especially if best
windows of each deliveries are considered MPF
activity is decreasing. Same trends were visualized
when we analyse phase-wise MPFs trends or best
activity phases.
Mean phase activity trends follow the same
pattern as describes by literature review. This provide
a basic understanding of the BB muscle activation
pattern during a typical cricket bowling. By the better
understanding of activity trends and identification of
important phases, using video analysis, a Sports
trainer can focus and analyse the phases RB, BFC and
MB because being the phases of higher activity
makes them more prone to injury.
BIOSIGNALS 2021 - 14th International Conference on Bio-inspired Systems and Signal Processing
198

7 CONCLUSIONS
The main objective of this paper was developing a
protocol to set up a support system for data
acquisition for a trainer or cricket coach. After the
detailed literature review and interviews of Cricket
Coaches protocol of the acquisition is being set up.
After that phase-wise analysis of deliveries was
performed which validate the results from literature
reviews and elucidate that RB and MB phases are the
relative active phases of a normal delivery and during
phases as muscles are mostly active it makes the
bowler more prone to injuries and it makes sense
because during Release of Ball bowlers jerk to pull
out maximum speed of the ball and resultantly they
injure themselves. So, the coach must study
kinematics specifically in high activity phases in
order to expound the patterns of muscles activity and
relate it with injury. These patterns can also be used
during the rehabilitation and fast recovery of an
injured player.
The compact model for a bowling data cannot be
materialized due to inter-subject variability and wide
range of bowling actions. The solution to this is that
instead of developing a single model for Fast bowlers,
individual profiles of players should be built, and
each player should be analysed based on his own
profile. For setting some standard for comparison a
profile of an elite can be logged but caveat will still
be inter-subject variability therefore, individual
profiles of players should be analysed.
Chances of incurring injury during bowling is
enhanced when a fatigued muscle exerts itself during
a bowling action. The above procedure can be used to
study phase-wise muscle activation pattern during a
bowling action and study the lowering of fatigue
index with repeated bowling actions. Based on
choosing a predefined threshold and the experimental
data acquired from a player, a safe number of allowed
overs and inter-over gaps can be selected for a player.
Fatigue related degradation in repeated
performance can be identified by collecting localized
fatigue data from multiple muscles during repeated
performance. Video monitoring and processing allow
computation of body kinematics in different phases of
bowling actions. Correlating this with fatiguing
pattern of individual muscles involved in the
kinematics can indicate which individual muscles
should be specifically focused for further training.
Improvement in bowling performance can be
planned better. Fast and slow fatiguing trend of a
muscle also indicate if the muscle can be invoked for
more power for better kinematics. Any lack in the
desired kinematics of a cricket bowling action can be
associated with either the lack in muscle capacity or
just the need of further training in a bowling
technique. In case of former the involved muscle
capacity shall be further improved before proceeding
with the latter.
REFERENCES
Ahamed, N.U, et al. “Surface electromyographic analysis
of the biceps brachii muscle of cricket bowlers during
bowling.” Australasian Physical & Engineering
Sciences in Medicine, vol. 37, no. 1, 2014, pp. 83-95
At, Au, and Kirsch RF. "EMG-based Prediction of Shoulder
and Elbow Kinematics in Able-bodied and Spinal Cord
Injured Individuals." IEEE Trans Rehabil Eng 8.4
(2000): 471- 80. Print.
Burden, Adrian. “Surface electromyography.”
Biomechanical Evaluation of Movement in Sport and
Exercise, edited by Carl J. Payton and Roger M.
Bartlett, Routledge, 2008, pp. 77-102.
Florimond, V. “Basics of Surface Electromyography
Applied to Psychophysiology.” eBook, Thought
Technology Ltd, 2008.
H.J Hwaang, W. H Chung, J.H Song, J.K Lim and H.S Kim,
2016. Prediction of biceps muscle fatigue and force
using electromyography signal analysis for repeated
isokinetic dumbbell curl exercise. Journal of
Mechanical Science and Technology, 30(11), Pp.
5329~5336.
Lloyd, David G., Jacqueline Anderson A., and Bruce Elliot
C. "An Upper Limb Kinematic Model for the
Examination of Cricket Bowling: A Case Study of
Mutiah Muralitharan." Journal of Sports Science 18
(2000): 975-82. Print.
Raez, M.B.I, et al. “Techniques of EMG Signal Analysis:
Detection, Processing, Classification and
Applications.” Biological Procedures Online 8 (2006):
11-35. PMC. Web. 4 Nov. 2016.
Ralf Schmidt, Catherine Disselhorst-Klug, Jiri Silny, and
Günter Rau. "A Marker-based Measurement Procedure
for Unconstrained Wrist and Elbow Motions." Journal
of Biomechanics 32.6 (June 1999): 615-21. Print
Rushda Basir Ahmad, Nadeem Ahmad Khan and
Muhammad Usama Rizwan.“A study on variation in
EMG trends under different muscular energy condition
for repeated Isokinetic Dumbbell Curl Exercise”
BioSignals 2020, December 2020.
Shorter K.,Smith N., Lauder M. and Khoury P., A
preliminary electromyographic investigation into
shoulder muscle activity in cricket seam bowling. In
Jensen R., Ebben W., Petushek C R. and Roemer, K
(Ed.), Proceedings of the XXVIII International Conf.
on Biomechanics in Sport, Northern Michigan
University, Michigan, USA, pp. 608-611, 2010.
Surface EMG-based Profiling and Fatigue Analysis of the Biceps Brachii Muscle of Cricket Bowlers
199
