
Comfort Evaluation from EEG Dipole Imaging
Yuna Shigematsu, Yuta Ueji and Atsushi Ishigame
Graduate School of Engineering, Osaka Prefecture University, 1-1, Naka-ku gakuen-cho, Sakai, Osaka
Keywords: Brain Activity, Comfort, EEG, Dipole Imaging, Evaluation.
Abstract: Different people may have different feelings even in the same environment. However, most of the evaluation
index in comfort are based on a fixed standard without considering individual differences. In this study, we
focus on the preference of comfort, and discussed the dipole imaging of brain waves to evaluate the comfort.
The amygdala is said to be one of the parts of the brain related to comfort. In this paper, we stated the
relationship between comfort and the area around the amygdala by dipole imaging.
1 INTRODUCTION
For humans, it is important to prepare an environment
where they spend a lot of time on a daily basis to lead
a comfortable and healthy life. If environmental
comfort can be improved, it can play a major role in
improving quality of life, and further improve
learning efficiency and work productivity (Vernon,
1919).
Depending on the surrounding environment, we
have various feelings such as heat cold, glare, and
noisiness as shown in figure 1. In addition, different
people may have different feelings even in the same
environment due to individual differences, gender
and age differences. Thus it is necessary to provide
each individual with an appropriate environment so
that everyone can have a comfortable life.
Figure 1: Conceptual diagram (Feeling comfort).
Most of the evaluation index are based on a fixed
standard without considering individual differences.
When it comes to a thermal environment, it is
evaluated by 4 environmental elements (the indoor
temperature, humidity, air flow velocity, radiation)
and 2 human body elements (human clothing amount,
metabolism). By using these, we evaluate a thermal
environment such as WBGT (Wet-Bult Globe
Temperature) for environmental elements, PMV
(Predicted Mean Vote), SET (Standard New Effective
Temperature), for human body elements. These index
are created based on the rule of thumb and the
questionnaire, which is a type of the subjective
evaluation.
The method using brain information can be
mentioned as a method of considering individual
differences. Research focusing on the brain, which
controls the majority of biological reactions, requires
expensive equipment. So those research was focused
on reports of applications in the medical field such as
epilepsy and sleep disorders. However, in recent
years, with the sophistication and price reduction of
devices, we have been actively researched on human
sensation by measuring brain function.
There are various types of devices that measure
brain function, such as MRI (Magnetic Resonance
Imaging), MEG (Magnetoencephalography), fNIRS
(functional Near-Infrared Spectroscopy), and EEG
(Electroencephalogram). MRI and MEG have high
spatial resolution as a merit, but they have low time-
resolving ability and restrain the body. On the other
hand, although NIRS and EEG have the
disadvantages that the measurement site is rough due
to the low spatial resolution and it is difficult to
measure deep brain, the device is simpler than MRI
and MEG, and can measure simply covering the
subject with a headgear-like device without restraint
of the body (Teodore, John, Greg, Dennis, Jose,
424
Shigematsu, Y., Ueji, Y. and Ishigame, A.
Comfort Evaluation from EEG Dipole Imaging.
DOI: 10.5220/0010243404240429
In Proceedings of the 14th International Joint Conference on Biomedical Engineering Systems and Technologies (BIOSTEC 2021) - Volume 5: HEALTHINF, pages 424-429
ISBN: 978-989-758-490-9
Copyright
c
2021 by SCITEPRESS – Science and Technology Publications, Lda. All rights reserved

2009). For this reason, we evaluate comfort
considering individual differences with EEG in this
paper.
The amygdala is one of the parts of the brain
related to comfort, and it is said that the amygdala is
excited in an uncomfortable state. In this paper, we
infer that there is a difference around the amygdala by
using EEG when comfortable and uncomfortable.
Frequency analysis is mainly used for EEG
analysis. However, detailed analysis can be difficult
due to the complexity of brain function. In addition,
EEG has a high temporal resolution, but has a low
spatial resolution. Therefore, it is difficult to directly
identify the electrical activity in the brain. Thus, in
this study, we decided to use dipole imaging to
identify the signal source by estimating the equivalent
dipole signal intensity distribution on the virtual
surface in the brain from the scalp potential. Then, we
hypothesized that comfort can be evaluated from the
difference around the amygdala when comfortable
and uncomfortable by using dipole imaging. To test
this hypothesis, we conducted an experiment showing
images that give comfortable feelings and
uncomfortable feelings, and analyzed EEG by dipole
imaging. By proving this hypothesis, we reveal that
comfort can be evaluated from amygdala information
by dipole imaging.
By further applying this, it is possible to consider
individual differences in a comfortable environment
for the current control of the environment such as air
conditioning and lighting. By adding the comfort
evaluation index that takes individual differences into
consideration as the element of environmental
control, we perform environmental control that takes
into consideration differences in comfort due to
differences in gender, age, amount of exercise, and
the situation that was placed until just before. By
doing so, we can create a comfortable environment
that suits each situation, and we believe that we can
improve QOL, reduce fatigue, and improve
productivity accordingly.
2 COMFORT AND DISCOMFORT
Comfort and discomfort are one of the most basic
psychological attributes for understanding behavior,
and it approaches a stimulus that causes pleasure but
tries to move away from a stimulus that causes
discomfort.
The amygdala is an important component of the
limbic system located inside the temporal lobe. The
amygdala is thought to play a central role in
controlling emotional behavior (Olds and Milner,
1954; Klüver and Bucy, 1937). It is expressed in
determining the behavior by judging the external
situation by judging whether it is advantageous for
the survival of the individual, the maintenance of the
species or not, and specifically the autonomic nervous
function, awakening, sleep, and attention. It is
considered to have a decisive influence on the
regulation of motor control. The amygdala is agitated
when it becomes psychologically burdensome such as
an unpleasant scene. The prefrontal cortex suppresses
amygdala excitement, but if the load continues to
occur, the amygdala remains agitated, resulting in
increased blood pressure and insomnia. By touching
the body, it is synthesized in the hypothalamus, and
oxytocin is secreted from the pituitary gland, whereby
the amygdala excitement can be sedated.
3 EEG ANALYSIS
The brain is a group of innumerable nerve cells,
which is said to have 14 billion cells, and is said to be
the highest center that not only controls human
thoughts and behaviors but also controls their
emotional and autonomic functions. Nerve cells
communicate with each other by weak electricity via
dendrites emerging from them. This phenomenon
occurs in the pyramidal cells of the cerebral cortex,
and their electrical activities are superimposed on
each other and transmitted to the surface of the head.
The EEG is a measurement of this transmitted
electrical activity.
3.1 Source Imaging
The electroencephalogram is an effective method to
elucidate the brain function in an environment close
to nature because the measurement environment is
not limited and can be easily measured non-
invasively. However, the spatial resolution of EEG is
low due to the limited number of electrodes and the
low conductivity of the skull. Therefore, it was
difficult to identify the electrical activity in the brain
directly from the potential distribution on the scalp
surface. As a method to solve this problem, brain
dipole imaging has been proposed in which the
equivalent dipole signal strength distribution on the
virtual surface in the brain is estimated from the scalp
potential and the signal source is specified. According
to this method, the signal source generated in the
brain can be equivalently expressed by the
distribution of multiple dipole signal intensities on the
virtual surface in the brain, without being limited in
the number and direction. The solution to this inverse
Comfort Evaluation from EEG Dipole Imaging
425

EEG problem is affected by noise due to
measurement and errors in the transfer matrix caused
by distortion during model design. The measurement
noise is caused by measurement environment such as
electrode impedance and artifacts such as blink and
body movement. On the other hand, the error of the
transfer matrix is caused by the distortion in the
model design such as the displacement of the
electrode attachment position, the individual
difference in the head shape, and the variation in
conductivity. Therefore, it is important to consider the
influence of noise in the solution of the inverse EEG
problem, due to estimate brain dipole imaging with
high accuracy (Rush and Driscoll, 1969; Ary, Klein
and Fender, 1981; Salu, Cohen, Rose, Sato, Kufta,
and Hallett, 1990).
3.2 Event-related Potential
Among the observed EEGs, those that spontaneously
and continuously appear on spruce are called
background EEG. Background EEG occurs because
the activity of neurons on the surface of the cerebral
cortex is constantly occurring throughout the cortex.
On the other hand, the brain potential that occurs after
stimulation of receptors and events related to
psychological processes such as perception, attention,
cognition, and memory is called event-related
potential (ERP). Since ERP is a minute potential
change of about 0.1 μV to several tens of μV
compared with the background EEG, multiple
waveforms measured under the same conditions are
arithmetically averaged to identify the ERP
component. In addition, the positive wave that
appears at about 300 ms is called P300 among ERP
(Sidman, Ford, Ramsey and Schlichting, 1990). P300
is thought to be involved in stimulus comparison,
evaluation, judgment, selective attention, and
cognitive context updating.
4 VERIFICATION EXPERIMENT
ON THE COMFORT
EVALUATION
4.1 Experiment Outline
As described in the previous section, the authors
believe that there is the difference of comfort and
discomfort in the amygdala using EEG source
imaging. To verify the hypothesis, we conducted an
experiment to show images that are thought to give
comfortable and uncomfortable feelings to the
subject. We show a conceptual diagram of the
experiments in Figure 2.
For the subject, 10 comfortable images and 10
uncomfortable images (20 in total) specified by
GAPED (Details explain in Chapter 4.2) were
randomly displayed for 3 seconds each. Figure 3
shows the examples of the displayed image. The
procedure was performed for 10 times. We show the
flow of the experiment in Figure 4.
Figure 2: Conceptual diagram of the experiments.
(a) (b)
Figure 3: The examples of the displayed image.
(a) The example of the comfortable image
(b) The example of the uncomfortable image.
Figure 4: The flow of the experiment.
HEALTHINF 2021 - 14th International Conference on Health Informatics
426
4.2 Used Equipment and Measuring
Method
The used instruments were as follows.
-Electroencephalogram measurement system
EMOTIV EPOC+ (14 Channel)
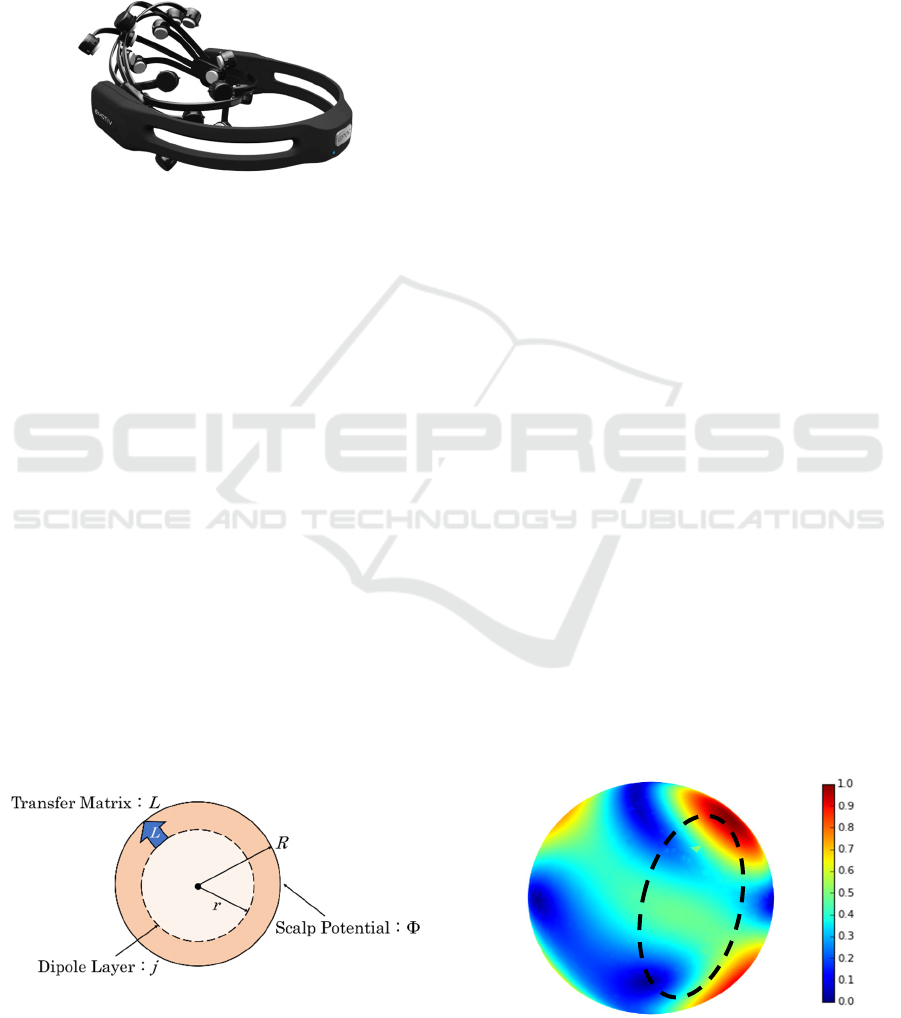
Figure 5 shows EPOC+ used in the experiment.
Figure 5: EMOTIV EPOC+.
-GAPED(The Geneva Affective Picture Database)
A Database of emotional visual stimuli. Those
with great valance and dominance and little
arousal are comfortable images, and the opposite
is uncomfortable images (Dan-Glauser and
Scherer, 2011).
The measured EEG was averaged to remove the
influence of background EEG. Then it was analyzed
by the method described below for the measured
brain waves.
-Dipole imaging
To evaluate the comfort state of the subject, we
determined the content of the dipole imaging(Cuffin,
1998).
A head model is set to estimate the signal intensity
distribution in the brain from the scalp potential. Head
models include sphere models, FEM (finite element
model)(Awada, Jackson, Williams, Wilton, Baumann
and Papanicolaou, 1997), and BEM(boundary
element model)( Fuchs, Drenckhahn, Wischmann
and Wagner, 1998.). However, since BEM and FEM
require MRI images of each individual, the head
model is the one-layer sphere in this study as shown
in Figure 6 (Baillet, Mosher, Leahy, 2001).
Figure 6: Head model.
A dipole layer was virtually placed in the brain of
this head model. On this layer, multiple dipole signal
sources in the radiation direction were installed at
equal intervals. The signal sources generated in the
brain can be equivalently represented by dipoles on
this layer, regardless of the number or direction.
Using the transfer matrix L from this dipole layer to
the scalp surface, the process of observing the scalp
surface potential Φ was modeled by the following
equation.
ΦL∙jn
(1)
j is the dipole signal strength distribution and n is
the noise. The transfer matrix L is determined by the
shape of the head model, conductivity, and electrode
placement.
That equation is a forward problem for dipole
imaging, and solve this inverse problem. In this
study, we solved the inverse problem by mne
(minimum norm estimation) as in the following
equation (Pascual-Marqui, 1999; Gramfort,
Luessi, Larson, Engemann, Strohmeier, Brodbeck,
Goj, Jas, Brooks, Parkkonen, Hämäläinen, 2013).
min |
|
ΦLj|
|
(2)
5 RESULT
5.1 Simulation Result
The result of simulation by dipole imaging is shown
in Figures 7 and 8. Figures show the parietal
hemisphere after normalizing the dipole signal
intensities to size 1. The upper part shows the frontal
region. Looking at Figures 7 and 8, there is a strong
dipole only in the simulation result at the time of
discomfort in the right central part (Broken line area),
that is, around the amygdala. That is, it is considered
that the signal source exists around the amygdala only
when the user is uncomfortable.
Figure 7: Simulation result (Comfortable images).
Comfort Evaluation from EEG Dipole Imaging
427
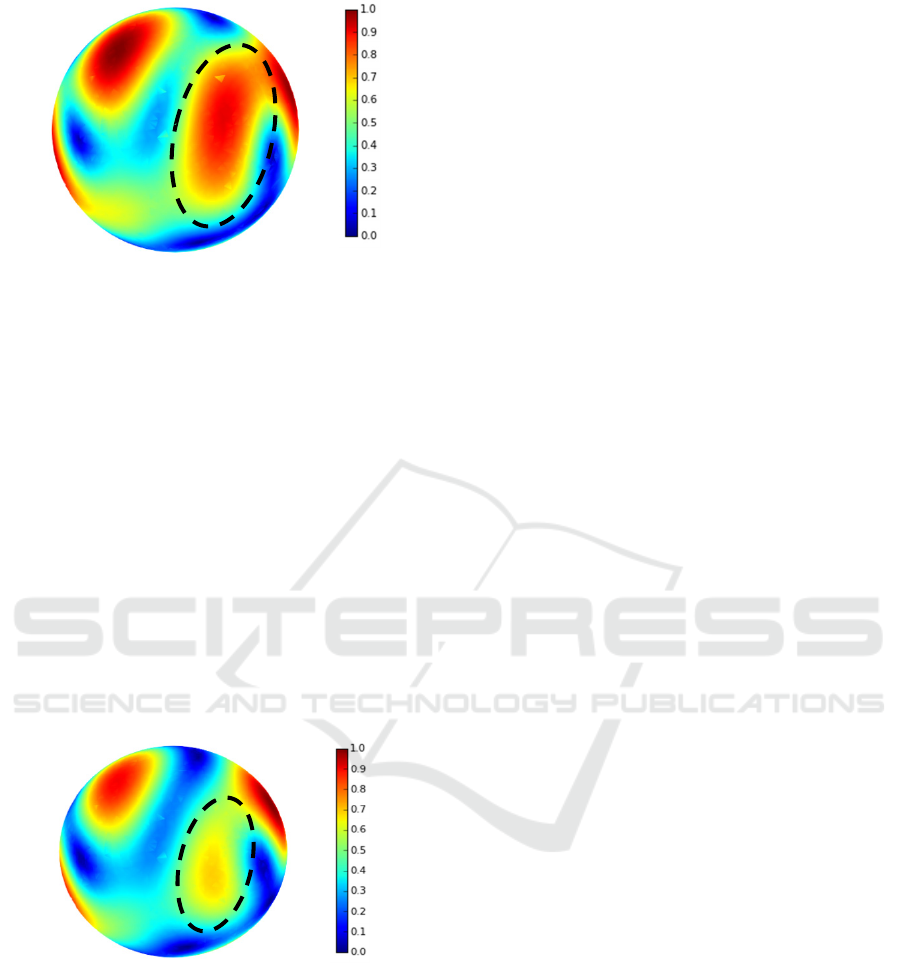
Figure 8: Simulation result (Uncomfortable images).
5.2 Discussion
From the results of this simulation, there was a
difference between the presentation of comfortable
images and the presentation of uncomfortable images.
When the uncomfortable image was presented, the
source signal was seen in the right central part, that is,
around the amygdala. However, in this study, the
results of the comfort image presentation and the
uncomfortable image presentation are added and
averaged to remove noise. Looking at the simulation
results for each image, there were cases where the
source signal was found around the amygdala even
when the comfort image was presented, and no signal
source was found around the amygdala even when the
uncomfortable image was presented. Figure 9 shows
the simulation result when a certain uncomfortable
image is presented.
Figure 9: Simulation result (A certain uncomfortable
image).
According to this result, a weak reaction is seen
around the amygdala, but the reaction is not strong
enough to be called a signal source. From this, it is
considered that the accuracy that can be evaluated in
consideration of individual differences, which was
the initial objective, has not been reached the level at
which individual comfort evaluation can be
performed in consideration of individual differences.
As a method for improving the accuracy, there is an
improvement of the head model. This time, a single-
layer sphere model was used as the head model. There
are various things such as the skull and the brain in
the head and it is not uniform. Therefore, we use a
three-layer sphere model in which the conductivity of
the scalp, the skull, and the brain are separately set
(Sidman, Ford, Ramsey and Schlichting, 1990). It is
possible to perform imaging in consideration of noise
caused by the scalp and skull, and it is considered that
the accuracy can be further improved. In addition, we
used mne as the solution of the inverse problem.
However, when mne is used, the current value may be
estimated over a wide range. Therefore, it is
considered that the accuracy of the signal source can
be further improved by using another method such as
MCE (minimum current estimation), LASSO (least
absolute shrinkage and selection operator), or
hierarchical variational Bayes estimation method.
6 CONCLUSION
In this paper, we examined the evaluation of comfort
and discomfort using dipole imaging. We presented
images that gave comfortable and unpleasant
emotions, and analyzed them using EEG dipole
imaging. As a result, it was found that the source
signal was found around the amygdala when the
uncomfortable image was presented. By adding the
proposed comfort evaluation index, that takes into
account individual differences, for environmental
control such as air conditioning and lighting as an
element of environmental control, we can control the
environment according to the differences in gender,
age, amount of exercise, and the situation that was
placed until just before. By doing so, we can create a
comfortable environment that suits individual
situations, improve QOL, reduce fatigue, and
improve productivity accordingly.
Therefore, the goal is to evaluate comfort
considering individual differences, the head model is
changed to a three-layer sphere model, and the
solution of the inverse problem is improved to
improve accuracy.
In the future, we would like to verify whether the
proposed comfort evaluation is practical. To that
purpose, we would like to compare the currently used
comfort evaluation indexes such as air conditioning,
lighting, and noise with the methods that add the
proposed method. And by adding the comfort
evaluation index proposed as an element of
environmental control such as air conditioning and
lighting as an element of environmental control, we
HEALTHINF 2021 - 14th International Conference on Health Informatics
428

would like to create a comfortable environment that
suits each individual.
REFERENCES
Vernon, H. M., 1919. The influence of hours of work and of
ventilation on output in tinplate manufacture, H.M.
Stationery Off. London
Teodore, W. B., John, K. C., Greg, A. G., Dennis, J. M.,
Jose C. P., 2009. Brain-Computer Interfaces: An
international Assessment of research and development
trend / Edition 1, Springer Nertherlands
Olds, J., Milner, P., 1954. Positive Reinforcement Produced
by Electrical Stimulation of Septal Area and Other
Regions of Rat Brain. Journal of Comparative and
Physiological Psychology, 47(6), 419–427
Klüver, H., Bucy, P. C., 1937. “Psychic blindness" and
other symptoms following bilateral temporal lobectomy
in Rhesus monkeys, American Journal of Physiology,
119, 352–353
Rush, S., Driscoll, D. A., 1969. EEG electrode sensitivity—
An application of reciprocity, IEEE Transactions on
Biomedical Engineering, 16, 15-22
Ary, J. P., Klein, S. A., Fender, D. H., 1981. Location of
Sources of Evoked Scalp Potentials: Corrections for
Skull and Scalp Thicknesses, IEEE Transactions on
Biomedical Engineering, 28(6), 447-452
Salu, Y., Cohen, L. G., Rose, D., Sato, S., Kufta, C., Hallett,
M., 1990. An improved method for localizing electric
brain dipoles, IEEE Transactions on Biomedical
Engineering. 37(7), 699-705
Sidman, R., Ford, M., Ramsey, G., Schlichting, C., 1990.
Age-related features of the resting and P300 auditory
evoked responses using the dipole localization method
and cortical imaging technique, Journal of
Neuroscience Methods. 33(1), 23-32
Dan-Glauser, E. S., Scherer, K. R., 2011. The Geneva
affective picture database (GAPED): a new 730-picture
database focusing on valence and normative
significance, Behavior Research Methods, 43(2), 468-
477
Cuffin, BN., 1998, EEG dipole source localization, IEEE
Eng Med Biol Mag. 17(5), 118-122
Awada, K. A., Jackson, D. R., Williams, J. T., Wilton, D.
R., Baumann, S. B., Papanicolaou, A. C., 1997.
Computational aspects of finite element modeling in
EEG source localization, IEEE Transactions on
Biomedical Engineering, 44(8), 736-752.
Fuchs, M., Drenckhahn, R., Wischmann, H. A., Wagner, M.,
1998. An improved boundary element method for
realistic volume-conductor modelling, IEEE
Transactions on Biomedical Engineering, 45(8), 980-
997
Baillet, S., Mosher, J. C., Leahy, R. M., 2001.
Electromagnetic brain mapping, IEEE Signal
Processing Magazine, 18(6), 14-30
Pascual-Marqui, R., 1999. Review of methods for solving
the EEG inverse problem, Bioelectromagnetism, 1, 1-
13
Gramfort, A., Luessi, M., Larson, E., Engemann, D.,
Strohmeier, D., Brodbeck, C., Goj, R., Jas, M., Brooks,
T., Parkkonen, L., Hämäläinen, M., 2013. MEG and
EEG data analysis with MNE-Python, Frontiers in
Neuroscience, 7, 267
Comfort Evaluation from EEG Dipole Imaging
429
