
Multi-view Planarity Constraints for Skyline Estimation from UAV
Images in City Scale Urban Environments
Ayyappa Swamy Thatavarthy, Tanu Sharma, Harshit Sankhla, Mukul Khanna
and K. Madhava Krishna
Robotics Research Center, International Institute of Information Technology, Hyderabad, India
Keywords:
Multi-view Planarity Constraints, Vanishing Lines, PlaneRCNN, Urban Environments, Vision for Aerial
Robots.
Abstract:
It is critical for aerial robots flying in city scale urban environments to make very quick estimates of a building
depth with respect to itself. It should be done in a matter of few views to navigate itself, avoiding collisions
with such a towering structure. As such, no one has attacked this problem. We bring together several modules
combining deep learning and 3D vision to showcase a quick reconstruction in a few views. We exploit the
inherent planar structure in the buildings (facades, windows) for this purpose. We evaluate the efficacy of our
pipeline with various constraints and errors from multi-view geometry using ablation studies. We then retrieve
the skyline of the buildings in synthetic as well as real-world scenes.
1 INTRODUCTION
Faster navigation of drones, in urban environments,
is a challenge as buildings and skyscrapers hinder the
long-range capability of on-board cameras. A dense
reconstruction of the scene within a few views enables
incremental path planning.
Therefore, this paper aims to propose a three stage
pipeline as depicted in Figure 1 to reconstruct the sky-
line of buildings using only 3-5 images of the scene
captured by an Unmanned Aerial Vehicle (UAV) or
an aerial robot. The three stages are 1) pre-processing
of the images, 2) initial estimation of the sparse struc-
ture followed by its refinement using a modified bun-
dle adjustment, and 3) retrieval of the skyline of the
scene by performing a dense reconstruction.
City scale urban environments are populated by
buildings with inherent piecewise planar structures.
To leverage these geometric cues, we employ a deep
neural architecture, PlaneRCNN proposed by (Liu
et al., 2018a), to detect visible planar facades with
their segmentation masks in the images.
We then extract the notable features such as line
junctions, vanishing points, and vanishing lines from
each detected plane mask. Orientation of the plane
segments is estimated by computing their normals us-
ing their corresponding vanishing lines. The geo-
metric constraints that bind the line junctions to the
planes in 3D are deduced from multiple views and are
stacked into a single constraints matrix. Solving this
matrix’s null space gives an initial sparse estimate of
the piecewise planar structure.
This structure is then refined using a modified
bundle adjustment step to minimize a combination of
residual terms, as explained in section 3. The facade
masks are then projected onto the refined sparse struc-
ture to obtain a dense reconstruction. Skyline of the
buildings is then retrieved using the dense reconstruc-
tion.
Our contributions are:
• a pipeline with several modules combining deep
learning and 3D vision to showcase a quick re-
construction of the skyline within a few views.
• a novel way of assimilating different geometric
constraints from multiple views for simultaneous
initialization of multiple planar structures.
• a study of the efficacy of various struc-
tural/geometric constraints, nascent to the 3D vi-
sion literature, on initialization, and bundle ad-
justment.
The paper is organized as follows. In section 2,
we list the works related to the current approach, and
in section 3, the methodology of our pipeline is pre-
sented. The results of our experiments are described
in section 4, followed by conclusions in section 5.
2 RELATED WORK
Reconstructing 3D geometry of an urban scene within
a few views from UAV images is not a well-studied
852
Thatavarthy, A., Sharma, T., Sankhla, H., Khanna, M. and Krishna, K.
Multi-view Planarity Constraints for Skyline Estimation from UAV Images in City Scale Urban Environments.
DOI: 10.5220/0010208408520860
In Proceedings of the 16th International Joint Conference on Computer Vision, Imaging and Computer Graphics Theory and Applications (VISIGRAPP 2021) - Volume 5: VISAPP, pages
852-860
ISBN: 978-989-758-488-6
Copyright
c
2021 by SCITEPRESS – Science and Technology Publications, Lda. All rights reserved
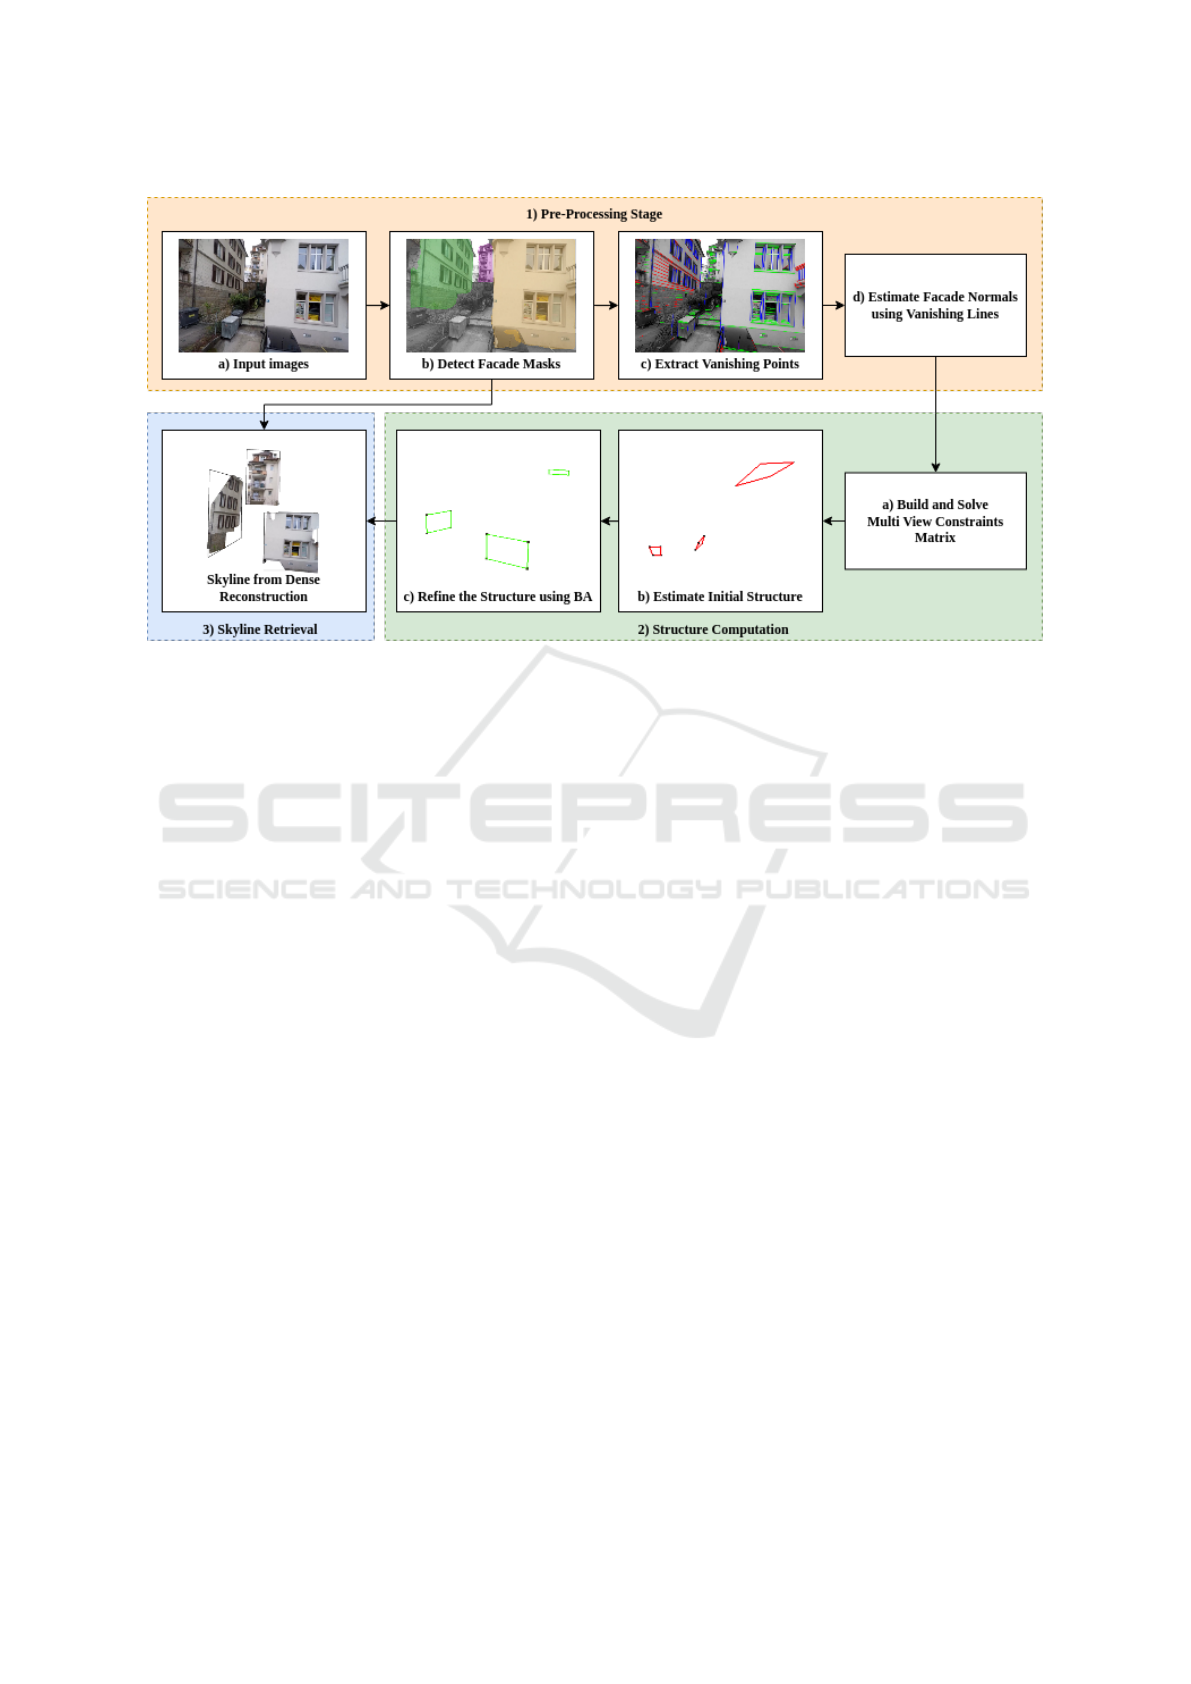
Figure 1: Overall pipeline of the proposed method. First four steps (in the top row) are part of the pre-processing stage (1).
The next three steps (from right of bottom row) form the structure computation stage (2). And the last step represents the
skyline retrieval stage (3). Images in each step represents the results obtained real world UrbanMAV dataset introduced by
(Majdik et al., 2017). Step 1(b) shows the segmentation masks of the planar facades generated by PlaneRCNN. Step I(c)
shows the line segments on the detected facades coloured by their vanishing point directions. Step 2(b) shows the initial
estimate of the 3D line junctions. Step 2(c) shows the refined 3D structure after bundle adjustment using various geometric
constraints. Step 3 shows the dense reconstruction and the retrieved skyline (black border surrounding each facade).
problem in Computer Vision literature.
Some methods (Zhou et al., 2017) use deep neu-
ral network architectures to predict depth and motion
from videos simultaneously. SLAM methods like (Li
et al., 2018), PL-SLAM(Gomez-Ojeda et al., 2019)
only focus on landmarks for localization and map-
ping. These landmarks are usually sparse and not very
useful for estimating the skylines in outdoor environ-
ments. They also require a good set of features to
track and initialize their system.
While there are many methods for detecting and
recovering building structures from aerial and satellite
images, approaches that reconstruct using low altitude
images are difficult to find in the literature.
For facade detection and segmentation from im-
ages, (Akbulut et al., 2018) have used LiDAR data.
There are a few learning based frameworks like
PlaneNet (Liu et al., 2018b), PlaneRecover (Yang and
Zhou, 2018) and PlaneRCNN (Liu et al., 2018a) to
detect planes from 2D images. Both PlaneNet and
PlaneRecover have a limitation on the number of
planes detected 10 and 5, respectively. We use Plan-
eRCNN for plane segmentation, as it uses a detection
network to overcome this limitation.
Most of the existing methods estimate the layout
of an urban scene from a single 2D image. These are
not directly useful to build a meaningful local map
useful for path planning and navigation. Some of the
single view based approaches that work in outdoor ur-
ban scenes are as follows. (Zhou et al., 2019) have
proposed a method to recover 3D wireframe from
single view images. Some other methods like (Ra-
malingam and Brand, 2013) and (Ranade and Rama-
lingam, 2018) use vanishing points and lines to lift the
2D features to 3D by imposing geometric constraints.
(Straub et al., 2018) have proposed the notion
of the Manhattan-Frame (MF) model to formalize
the surface normals of orthogonal and parallel planar
structures in man-made environments. Given a set of
surface normals or vanishing points, (Joo et al., 2019)
estimate the MF in near real-time and apply it to es-
timate multiple MFs. In general, a manhattan scene
is described by two mutually perpendicular vanish-
ing points and a vertical vanishing point. To model
more complex urban scenes, (Schindler and Dellaert,
2004) have proposed Atlanta World with more than
two horizontal vanishing point directions. (Li et al.,
2019) have used Atlanta World based constraints to
improve line based SLAM.
(Khurana et al., 2012) proposed geometric con-
straints for single-view reconstruction of buildings
with a user-guided interface. To avoid the depth am-
biguity due to projective single view geometry, they
also assume that a reference plane such as the ground
Multi-view Planarity Constraints for Skyline Estimation from UAV Images in City Scale Urban Environments
853
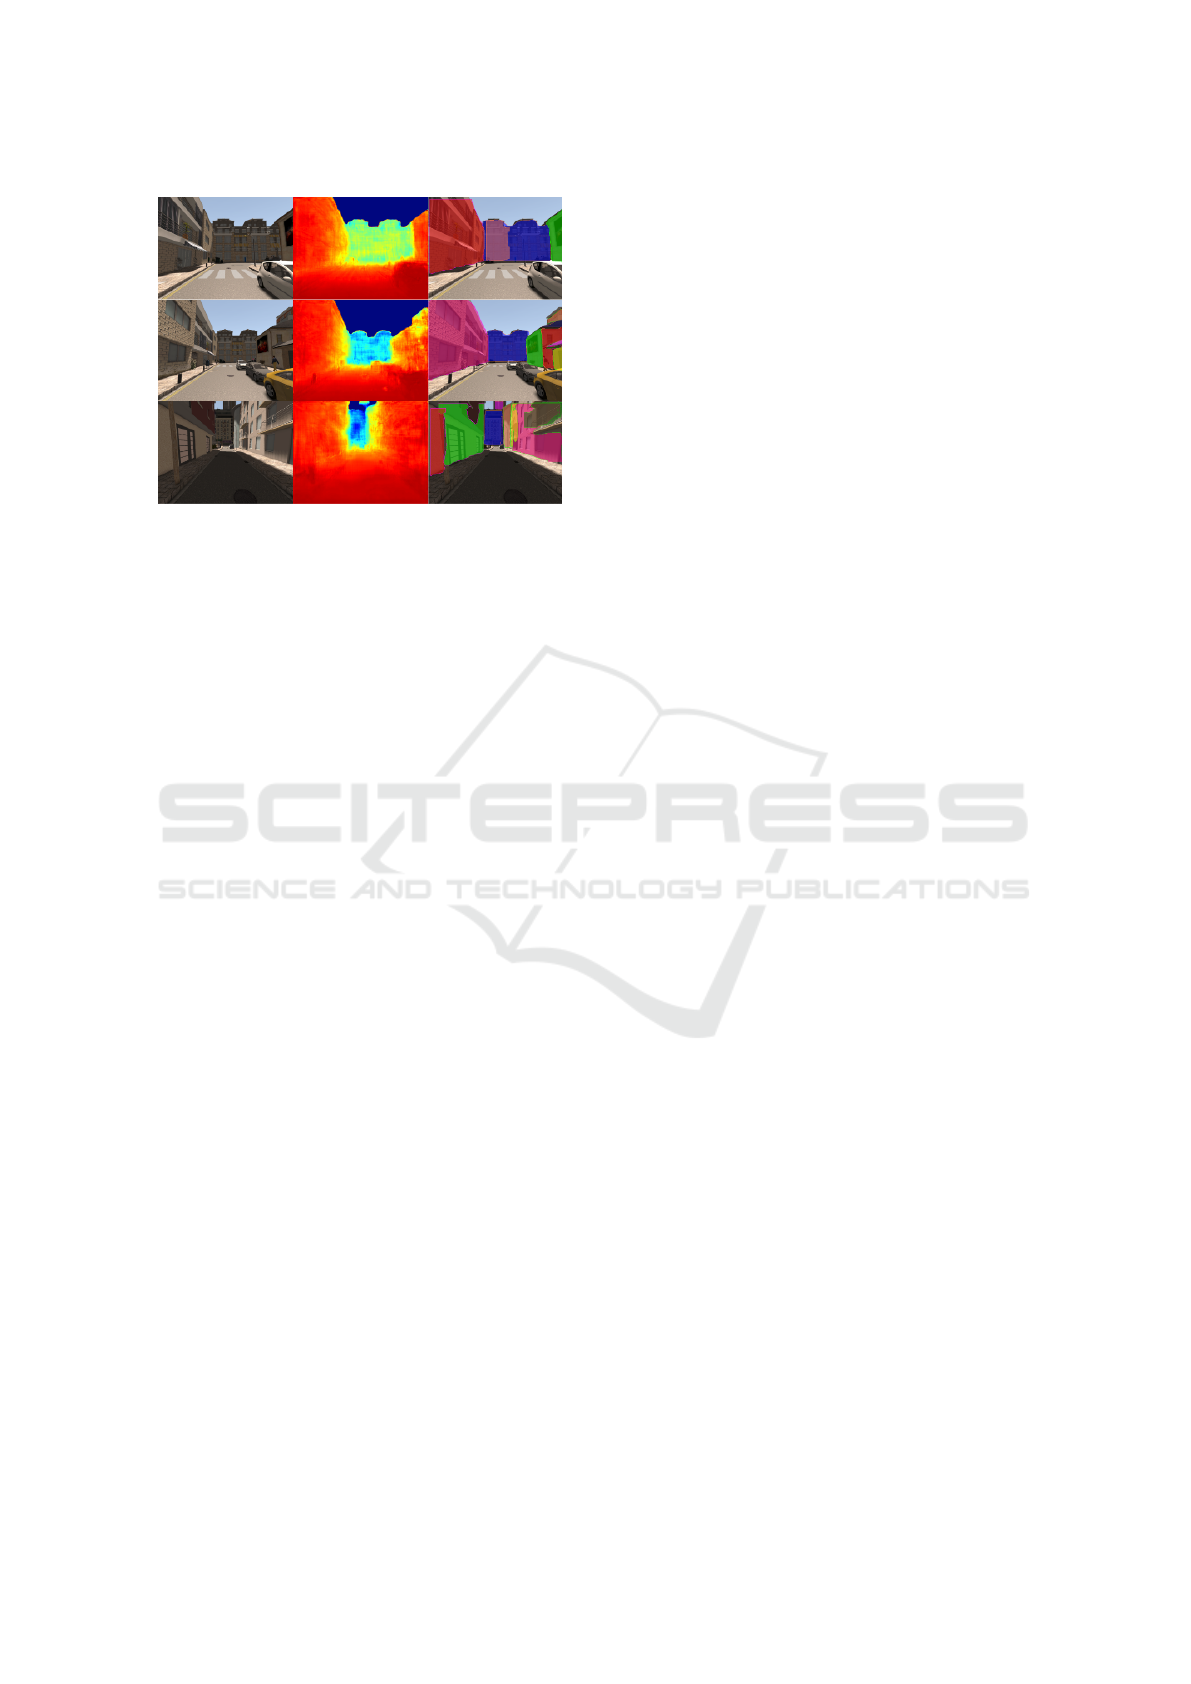
Figure 2: Results on test images after fine-tuning PlaneR-
CNN on SYNTHIA dataset.
or one of the building facades is reconstructed in 3D.
This assumption cannot be made when reconstructing
the buildings in real-time.
In contrast, we consider 3 to 5 images per scene
for reconstruction. Instead of a user-guided interface,
we use PlaneRCNN to automatically segment the in-
dividual planar facades of buildings in the scene. We
then utilize the information from nearby views in the
form of various planar constraints to avoid the need
for a reference plane.
3 METHODOLOGY
3.1 Pipeline
The steps involved in the proposed pipeline are de-
scribed as follows:
• Preprocessing of UAV images
• Initialization and refinement of sparse structure
using geometric constraints
• Dense reconstruction followed by skyline re-
trieval
3.2 Pre-processing
Each image in the sequence is pre-processed using the
steps depicted in Figure 1. Each step is described in
the following sections.
3.2.1 Facade Detection
In urban scenes, skyline is formed by planar facades
of buildings. For computational purposes, the facades
can be assumed to be planes in 3D.
To predict the facades/plane segment instances of
buildings, we have trained PlaneRCNN on SYNTHIA
dataset.
The architecture of PlaneRCNN is briefly de-
scribed as follows. It uses Mask R-CNN (He et al.,
2017) as its backbone to detect planar and non-planar
regions, where each planar region is considered an ob-
ject instance. Besides this, it contains two modules
viz., segmentation refinement network, and warping
loss module.
The segmentation refinement module jointly opti-
mizes all the detected masks by comparing them us-
ing a cross-entropy loss. Its U-Net architecture (Ron-
neberger et al., 2015) uses ConvAccu modules, which
are based on non-local modules (Wang et al., 2017).
The warping loss module enforces the consistency
of reconstructed 3D planes with a nearby view during
the training. The 3D points p
n
of a nearby view are
projected on the current view, and current view coor-
dinates p
c
are read using bilinear interpolation. Then,
p
c
are transformed to nearby coordinate frame p
t
c
to
compute the L2 norm between p
t
c
and p
n
.
PlaneRCNN detects plane instances, predicts
plane parameters, and per-pixel depthmap. However,
we have observed that discontinuities like balconies,
protrusions, and depression on the building walls lead
to a poor prediction of plane normals and depth map.
So, we limit its usage to predict plane segment masks.
3.2.2 Normal Estimation
Each facade contains a horizontal and a vertical van-
ishing point. A line joining any two vanishing points
is called a Vanishing Line. Normal (n) of the facade
plane can be computed using vanishing line (l
v
) using
the formula:
n = R
T
(K
T
l
v
) (1)
where R and K represent the rotation and camera cal-
ibration matrices respectively.
LSD algorithm, as mentioned in (Grompone von
Gioi et al., 2012) is used to extract the line segments
within the facade segment in the image. Vanishing
points are computed and are assigned to the line seg-
ments using the approach described in (Lezama et al.,
2017).
3.3 Initialization
Buildings can be reconstructed by considering the
piece-wise planar surfaces of the facades. To achieve
that, a 2D polygon (formed by joining the line junc-
tions) is detected on the facade’s image and tracked
across neighbouring views. We use this information
VISAPP 2021 - 16th International Conference on Computer Vision Theory and Applications
854

l
jT
1
P
j
0 0 0 l
jT
1
p
j
4
0 l
jT
1
P
j
0 0 l
jT
1
p
j
4
0 l
jT
2
P
j
0 0 l
jT
2
p
j
4
0 0 l
jT
2
P
j
0 l
jT
2
p
j
4
0 0 l
jT
3
P
j
0 l
jT
3
p
j
4
0 0 0 l
jT
3
P
j
l
jT
3
p
j
4
0 0 0 l
jT
4
P
j
l
jT
4
p
j
4
l
jT
4
P
j
0 0 0 l
jT
4
p
j
4
t
1 j
x
0 0 0 t
1 j
4x
t
1 j
y
0 0 0 t
1 j
4y
0 t
2 j
x
0 0 t
2 j
4x
0 t
2 j
y
0 0 t
2 j
4y
0 0 t
3 j
x
0 t
3 j
4x
0 0 t
3 j
y
0 t
3 j
4y
0 0 0 t
4 j
x
t
4 j
4x
0 0 0 t
4 j
y
t
4 j
4y
n
j
−n
j
0 0 0
0 n
j
−n
j
0 0
0 0 n
j
−n
j
0
n
j
0 0 −n
j
0
V
1
V
2
V
3
V
4
1
= 0
Figure 3: A sample constraints matrix built from j
th
view of a 3D quadrilateral defined by the vertices V
1
, V
2
, V
3
and V
4
. P
j
represents the projection matrix of j
th
view. t
x
and t
y
represent the standard point triangulation constraints. n
j
represents the
normal of the plane computed using the equation (1). First eight rows of the matrix represent frustum constraints. Next eight
rows are from the triangulation constraints. The last four rows arise from the orientation/normal constraints.
along with standard triangulation to build a multi-
view constraints matrix. This matrix’s null space is
found using SVD (Singular Value Decomposition) to
get an initial algebraic estimate of the structure. To
minimize the residual errors in the initial estimate, an-
other step of least-squares minimization is performed,
which serves as the initialization for the 3D structure
(depicted by red polygons in Fig 1).
At this stage, the 3D structure represents approx-
imate positions of vertices of the 3D polygons on
buildings’ facades.
In the bundle adjustment stage (explained in the
next section), different combinations of planar con-
straints are imposed besides the standard reprojection
error (E
r
). The constraints ensure that the vertices and
the poses are simultaneously optimized while main-
taining geometric consistency.
Frustum Constraint.
A 3D polygon is represented by a list of vertices:
V
1
= (V
1x
,V
1y
,V
1z
)
T
V
2
= (V
2x
,V
2y
,V
2z
)
T
···
and so forth.
The edges of the polygon in the image may be de-
noted as l
1
, l
2
, . . . , l
s
. If an edge i is projected from the
center of the camera, it sweeps a plane in 3D.
The volume bounded by the planes formed by
each edge of the polygon is defined as a frustum.
As each vertex of an s-sided polygon lies on the
two intersecting edges, s vertices give rise to 2s frus-
tum constraints from each view. If the polygon is vis-
ible in n views, each polygon gives rise to 2sn frustum
constraints:
For a vertex
e
V
j
(where represents homogenous
coordinates) of an i
th
quadrilateral visible in n views,
the following equation represents the 2n frustum con-
straints.
(P
1T
l
1
1i
)
T
e
V
j
= 0
(P
1T
l
1
2i
)
T
e
V
j
= 0
.
.
.
(P
nT
l
n
1i
)
T
e
V
j
= 0
(P
nT
l
n
2i
)
T
e
V
j
= 0
where j represents all vertices lying on edge i.
The error term representing the frustum con-
straint, in general, can be defined as:
e
f
= ||(P
T
l)
e
V||
2
(2)
Multi-view Planarity Constraints for Skyline Estimation from UAV Images in City Scale Urban Environments
855
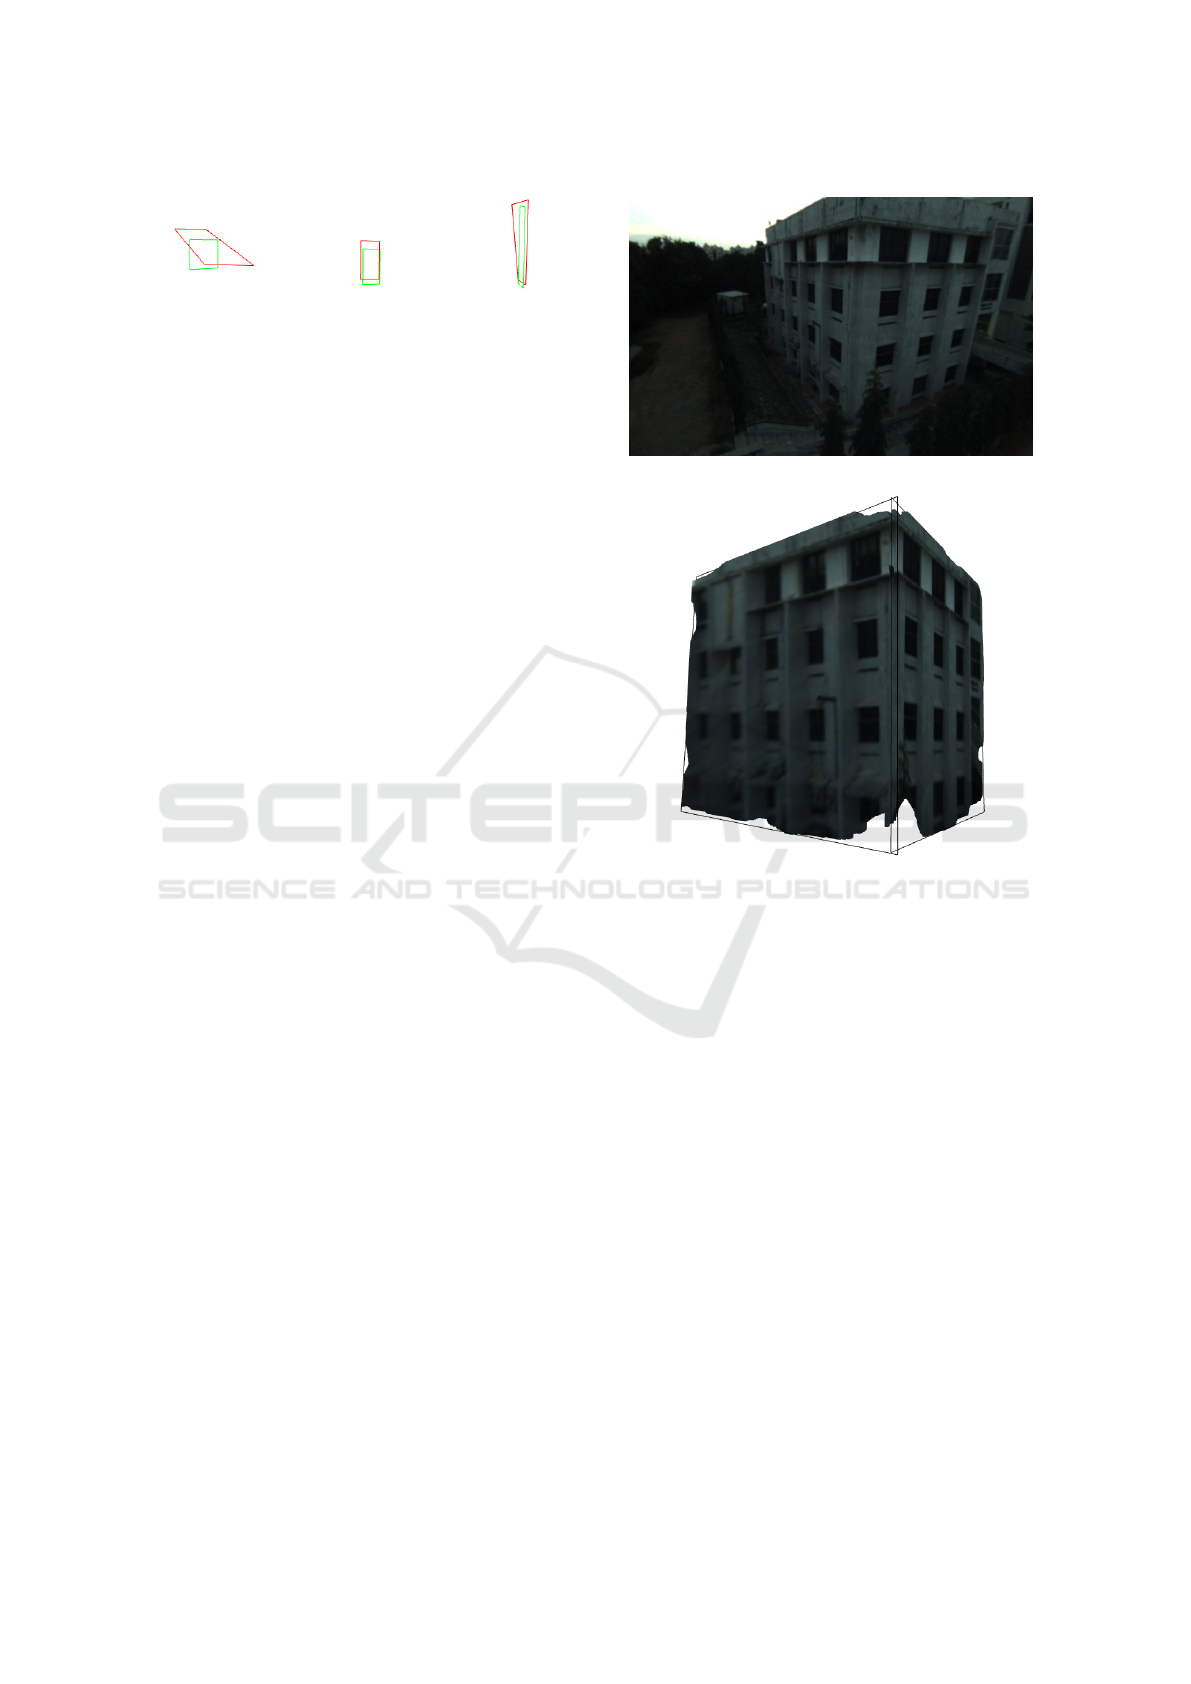
Figure 4: Results of the sparse structure before and after
the modified bundle adjustment. Red polygons represent
the estimate of the structure on a SYNTHIA sequence be-
fore the bundle adjustment step. Green polygons represent
the refined structure after bundle adjustment using all the
combinations of constraints mentioned in the section 3.3.
Orientation Constraint.
The normals of each facade are computed from the
vanishing lines. Its error term can be represented as
follows :
e
o
= ||n
T
.(V
2
− V
1
)||
2
(3)
Scalar Triple Product (STP).
Scalar Triple Product represents the volume of a par-
allelopiped. The scalar triple product of four points in
3D is zero if they are coplanar. It is computed using
the 3D vertices:
e
s
= (V
3
− V
1
).[(V
2
− V
1
) × (V
4
− V
1
)] (4)
Manhattan Constraint.
Based on their normals, facades are assigned one of
the two horizontal vanishing directions. As they are
orthogonal to each other, the Manhattan constraint is
defined as:
e
m
= n
T
1
.n
2
(5)
Multi-view Constraints Matrix.
It is to be noted that the Triangulation, Frustum, and
Orientation constraints are linear in terms of the 3D
vertices. So, a combination of these three constraints
is used to build the multi-view constraints matrix
shown in Figure (3).
As it captures the constraints of all the 3D quadri-
laterals obtained from all views, it is used to get a
one-shot initialization of the all the piecewise planar
structures in the scene.
As this is in the form AX = 0, its null space (con-
taining the vertices) is solved using SVD. This gives
the initial algebraic estimate of the structure.
3.4 Modified Bundle Adjustment
So far, the vertices obtained may not lie on a plane,
thereby deforming the planar structure of the facades
of the building. To overcome this, we modify bundle
(a)
(b)
Figure 5: a) Image of a real-world building captured by an
RGB camera mounted on a UAV. b) shows a novel view
of the dense reconstruction obtained with our method using
only 5 views of the scene.
adjustment to simultaneously optimize for the planar
structure and the poses using different combinations
of residual terms besides the reprojection error. The
residuals are computed from the parameters viz., ini-
tialized 3D vertices, and the poses.
Total Residual.
The total residual is computed as the weighted sum of
all the constraints involved in the combination.
e = e
r
+ e
f
+ e
o
+ e
m
+ e
s
(6)
Figure 4 shows the results of the structure before
and after the bundle adjustment.
3.5 Skyline Retrieval
The plane parameters of each facade are computed
from the refined structure. All pixels that lie inside the
facade masks are then projected onto their respective
VISAPP 2021 - 16th International Conference on Computer Vision Theory and Applications
856
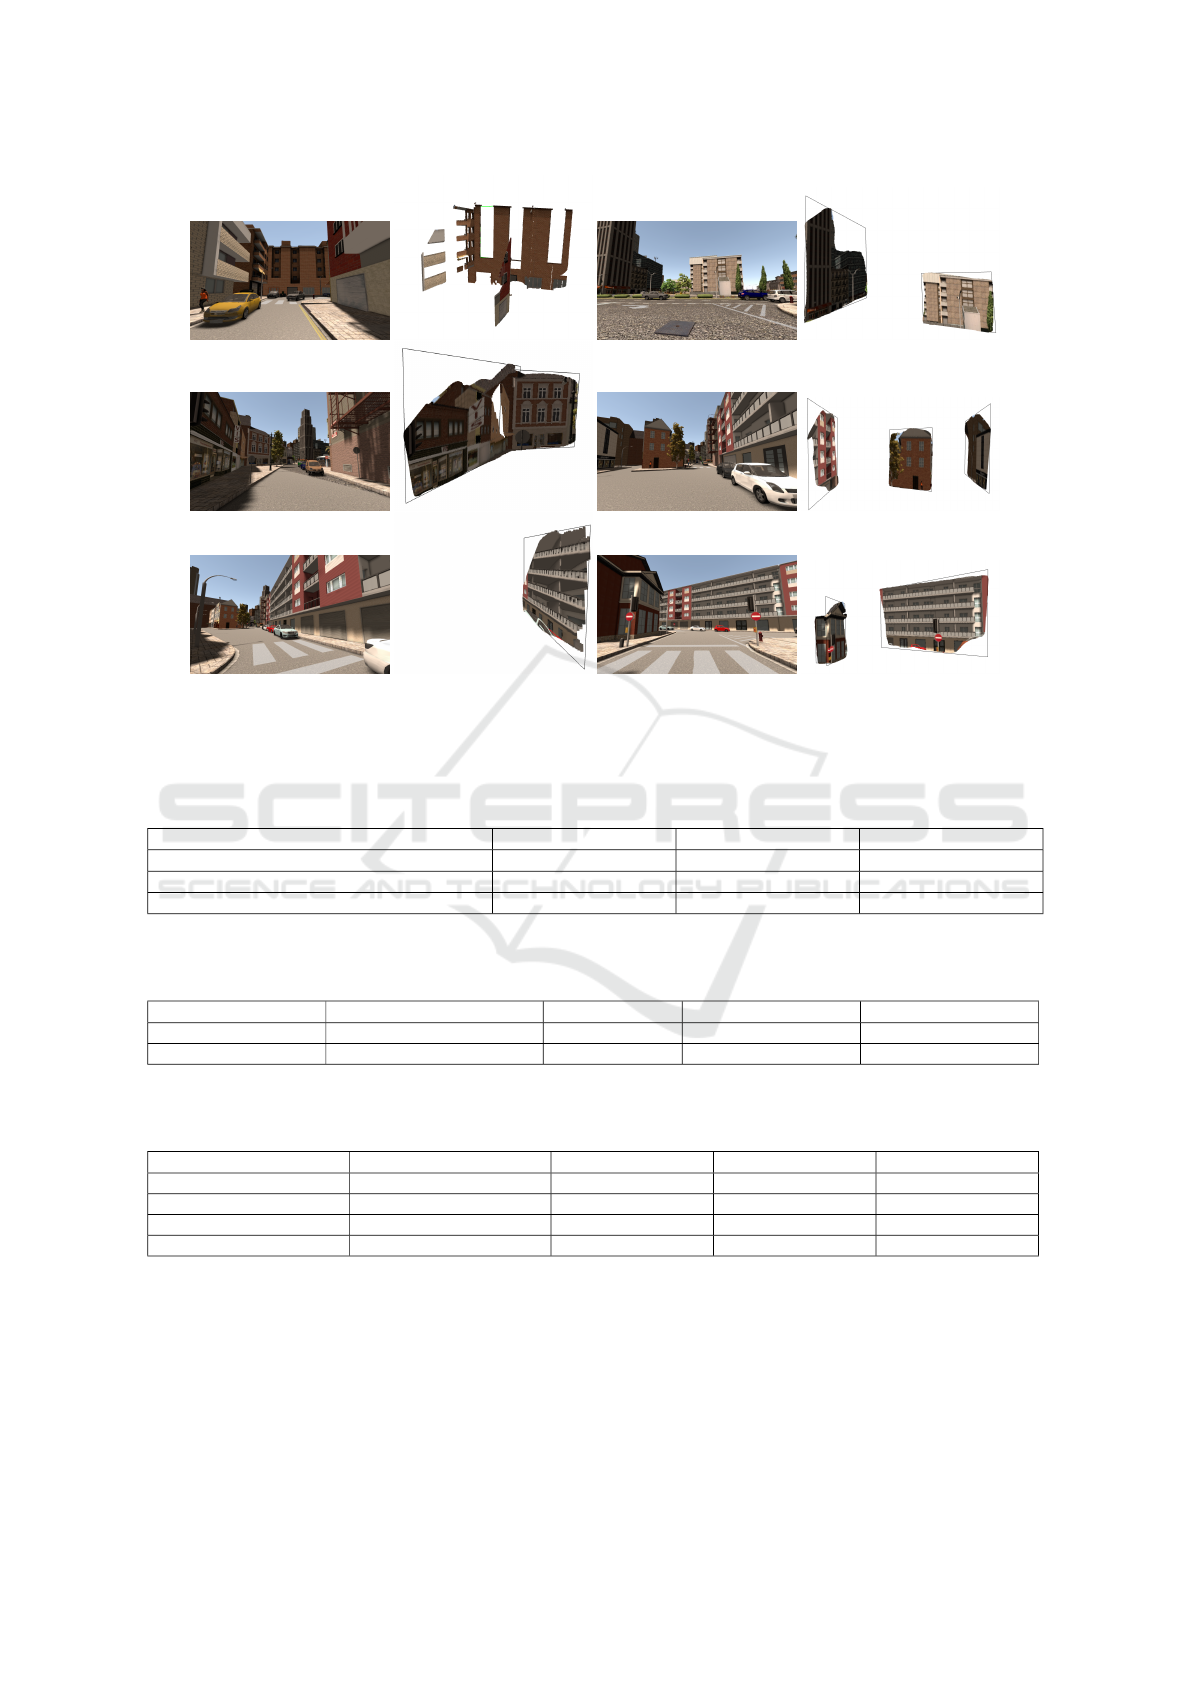
Figure 6: Qualitative results obtained on photo-realistic views from SYNTHIA dataset. Only 3-5 images per scene are
considered. Skylines of the buildings retrieved using our method from 6 different scenes are shown. Dense reconstruction is
visualized using Open 3D (Zhou et al., 2018) software.
Table 1: Ablation study on contributions of two components in PlaneRCNN. VOI, RI and SC are the metrics with abbre-
viations Variation Of Information, Rand Index and Segmentation Covering respectively. Plane segmentation metrics are
computed on the SYNTHIA dataset.
Method VOI ↓ RI ↑ SC ↑
warping + refine (pre-trained) 2.556 0.536 0.376
warping + refine (re-rained on SYNTHIA) 1.495 0.793 0.677
refine (re-trained on SYNTHIA) 1.222 0.863 0.770
Table 2: Various errors (averaged across the test scenes) in the initial estimates of the structure after the stages 2a and 2b.
This shows the improvement in structure due to least squares minimization or geometric correction (stage 2b) on the initial
estimate obtained algebraically using SVD of the multi-view constraints matrix (stage 2a).
Stage of initialization Plane Orientation (deg) Depth (cm) Coplanarity (cm
3
) Manhattan (deg)
2a 18.183 14.227 0.935 31.798
2b 11.079 13.825 0.697 31.244
Table 3: Ablation study of imposing various structural constraints on BA (stage 2c of Figure 1), showing the overall im-
provement in the structure. The errors are computed using the ground truth of SYNTHIA dataset (Averaged across the test
scenes).
Constraints Plane Orientation (deg) Depth (cm) Coplanarity (cm
3
) Manhattan (deg)
e
r
10.824 12.884 1.093 30.905
e
r
+ e
s
10.545 12.737 1.042 30.793
e
r
+ e
s
+ e
f
10.075 52.522 1.269 33.121
e
r
+ e
s
+ e
f
+ e
m
9.781 21.799 0.903 29.156
reconstructed planes to generate a dense reconstruc-
tion of the plane segment. Thus the skyline is drawn
along the border of the plane segment.
4 EXPERIMENTS AND RESULTS
We have evaluated the proposed pipeline on different
scenes of SYNTHIA as well as UrbanMAV datasets.
We have used PlaneRCNN (Liu et al., 2018a)
framework for building facade/plane segmentation.
Multi-view Planarity Constraints for Skyline Estimation from UAV Images in City Scale Urban Environments
857

Originally, PlaneRCNN is trained on the ScanNet
(Dai et al., 2017), an indoor dataset. This resulted
in poor predictions when using the pre-trained model
SYNTHIA (Ros et al., 2016), which is an outdoor
dataset. Two problems were identifed with the pre-
trained model detections - 1) Only planes near the
camera were detected, and 2) It detected planes of
other objects like cars, which are not required. As
shown in Figure(2), re-training the network on SYN-
THIA resulted in better mask predictions. The re-
trained model is able detect far-off and very small
planes while ignoring unnecessary planes like the
ground, car roof, car doors, etc.
We have trained PlaneRCNN on 1018 images of
the Synthia-SUMMER-04 sequence for ten epochs
with a learning rate of 1e
−4
on an NVIDIA GTX
1080 Ti GPU. SYNTHIA dataset does not have plane
instance segmentation. So, the dataset was manu-
ally annotated with plane instances. We have ob-
served that, PlaneRCNN with the segmentation re-
finement module gives a better result than with both
the refinement and the warping module in detect-
ing the plane segments on the facades of buildings.
We have evaluated plane segmentation quality for the
pre-trained model and trained model (using different
modules) on the SYNTHIA dataset (tabulated in Ta-
ble 2). The metrics used are - variation of information
(VOI), Rand index (RI), and segmentation covering
(SC) (Yang and Zhou, 2018).
Variation of Information (VOI) metric is used for
clustering comparison. It measures the distance be-
tween two segmentations in terms of their average
conditional entropy and is given by
VOI(S, S
0
) = H(S) + H(S
0
) − 2I(S, S
0
) (7)
where, H and I represent, respectively, entropies and
mutual information between two clusterings of data S
and S
0
. Less similar the two segmentations, higher is
the VOI.
Rand Index allows the comparison of a test seg-
mentation with multiple ground-truth segmentations
through soft nonuniform weighting of pixel pairs as a
function of the variability in the ground-truth set.
RI(S, {G
k
}) =
1
T
∑
i< j
[c
i j
p
i j
+ (1 − c
i j
)(1 − p
i j
)] (8)
where, {G
k
} is the set of ground-truth segmentations,
c
i j
is the event that pixels i and j have same label and
p
i j
is its probability and T is total number of pixel
pairs.
Segmentation Covering (SC) of a segmentation S
by a segmentation S
0
is defined as
C(S
0
→ S) =
1
N
∑
R∈S
|R| · max
R
0
∈S
0
O(R, R
0
) (9)
where,
O(R, R
0
) =
|R ∩ R
0
|
|R ∪ R
0
|
(10)
and N denotes total number of pixels in the image.
Similarly, the covering of a machine segmentation S
by a family of ground-truth segmentations {Gi} is de-
fined by first covering S separately with each human
segmentation G
i
and then averaging over the differ-
ent humans. To achieve perfect covering, the machine
segmentation must explain all of the human data. We
can then define two quality descriptors for regions:
the covering of S by {G
i
} and the covering of {G
i
}
by S.
We have used C++ based optimization library
ceres-solver(Agarwal et al., ) for initialization and
bundle adjustment steps.
Figure (5b) shows the reconstruction of a real-
world building captured from a UAV obtained using
our proposed method. The UAV used is equipped
with an mvBlueFOX monocular camera with a res-
olution of 1.3MP. Five images of the scene have
been used to reconstruct the scene using the proposed
pipeline.
Figure (6) shows the qualitative results with the
dense reconstructions and skylines obtained by fol-
lowing our method.
Quantitative results obtained on the synthetic
dataset (SYNTHIA) only are reported in tables 2 &
3, as the ground truth depth maps are unavailable on
real world UrbanMAV dataset. The error metrics are
computed by comparing the estimated vertices against
the vertices obtained from ground truth depth. The
values are presented in (cm) to show the accuracy of
the method when evaluated in synthetic scenes. Plane
Orientation and Manhattan errors depicts the average
deviation of the normals of the planes in scene w.r.t
the ground truth plane normals. Table 2 shows the ad-
vantage of using stage 2b to improve the initial alge-
braic estimate. Table 3 shows the improvement in the
structure after the bundle adjustment modified by im-
posing various constraints. As the orientation residual
term (e
o
) in BA is computed using the normals com-
puted from the vanishing line, it is sensitive to the er-
rors in the line feature detection. As this resulted in
increase of the error metrics after the BA stage, it is
not reported in Table 3. Nonetheless, the Orientation
constraint in the stages 2a and 2b, proved to be useful
in reducing the plane normal deviation of estimated
structure.
VISAPP 2021 - 16th International Conference on Computer Vision Theory and Applications
858

5 CONCLUSION
In this paper, we have shown that using the constraints
have improved the depth and orientation estimates of
piecewise planar structures in city scale urban envi-
ronments.
By training PlaneRCNN to detect the buildings’
planar facades, the geometric information of each
visible facade can be extracted. Imposing the de-
duced multi-view geometric constraints by modifying
the standard bundle adjustment resulted in improved
depth and orientation estimates. The dense recon-
struction of the facades is obtained by using the fa-
cade masks generated by the neural network. In some
cases, the increase in depth error has been compen-
sated by the decrease of orientation error, ensuring
structural improvement.
The skyline, thus retrieved from the dense recon-
struction, can be used in navigation and path planning.
ACKNOWLEDGEMENTS
We thank Shivaan Sehgal and Sidhant Subramanian,
for annotating the building facades in SYNTHIA
dataset and Mukul Khanna, for helping out with fa-
cade detection network experiments. We also thank
Krishna Murthy J. at Real and Embodied AI Lab, Uni-
versit
´
e de Montr
´
eal for valuable feedback/advice dur-
ing the brainstorming sessions.
REFERENCES
Agarwal, S., Mierle, K., and Others. Ceres solver. http:
//ceres-solver.org.
Akbulut, Z.,
¨
Ozdemir, S., Acar, H., and Karsli, F. (2018).
Automatic building extraction from image and lidar
data with active contour segmentation. Journal of the
Indian Society of Remote Sensing, 46(12):2057–2068.
Dai, A., Chang, A. X., Savva, M., Halber, M., Funkhouser,
T., and Nießner, M. (2017). Scannet: Richly-
annotated 3d reconstructions of indoor scenes.
Gomez-Ojeda, R., Moreno, F., Zu
˜
niga-No
¨
el, D., Scara-
muzza, D., and Gonzalez-Jimenez, J. (2019). Pl-
slam: A stereo slam system through the combination
of points and line segments. IEEE Transactions on
Robotics, 35(3):734–746.
Grompone von Gioi, R., Jakubowicz, J., Morel, J.-M., and
Randall, G. (2012). LSD: a Line Segment Detector.
Image Processing On Line, 2:35–55.
He, K., Gkioxari, G., Doll
´
ar, P., and Girshick, R. (2017).
Mask r-cnn.
Joo, K., Oh, T., Kim, J., and Kweon, I. S. (2019). Robust
and globally optimal manhattan frame estimation in
near real time. IEEE Transactions on Pattern Analysis
and Machine Intelligence, 41(3):682–696.
Khurana, D., Sankhla, S., Shukla, A., Varshney, R., Kalra,
P., and Banerjee, S. (2012). A grammar-based gui
for single view reconstruction. In Proceedings of
the Eighth Indian Conference on Computer Vision,
Graphics and Image Processing, ICVGIP ’12, New
York, NY, USA. Association for Computing Machin-
ery.
Lezama, J., Randall, G., and Grompone von Gioi, R.
(2017). Vanishing Point Detection in Urban Scenes
Using Point Alignments. Image Processing On Line,
7:131–164.
Li, H., Xing, Y., Zhao, J., Bazin, J., Liu, Z., and Liu,
Y. (2019). Leveraging structural regularity of atlanta
world for monocular slam. In 2019 International Con-
ference on Robotics and Automation (ICRA), pages
2412–2418.
Li, H., Yao, J., Bazin, J., Lu, X., Xing, Y., and Liu, K.
(2018). A monocular slam system leveraging struc-
tural regularity in manhattan world. In 2018 IEEE In-
ternational Conference on Robotics and Automation
(ICRA), pages 2518–2525.
Liu, C., Kim, K., Gu, J., Furukawa, Y., and Kautz, J.
(2018a). Planercnn: 3d plane detection and recon-
struction from a single image.
Liu, C., Yang, J., Ceylan, D., Yumer, E., and Furukawa, Y.
(2018b). Planenet: Piece-wise planar reconstruction
from a single rgb image.
Majdik, A. L., Till, C., and Scaramuzza, D. (2017). The
Zurich urban micro aerial vehicle dataset. The In-
ternational Journal of Robotics Research, 36(3):269–
273.
Ramalingam, S. and Brand, M. (2013). Lifting 3d manhat-
tan lines from a single image. In 2013 IEEE Inter-
national Conference on Computer Vision, pages 497–
504.
Ranade, S. and Ramalingam, S. (2018). Novel single view
constraints for manhattan 3d line reconstruction. In
2018 International Conference on 3D Vision (3DV),
pages 625–633.
Ronneberger, O., Fischer, P., and Brox, T. (2015). U-net:
Convolutional networks for biomedical image seg-
mentation.
Ros, G., Sellart, L., Materzynska, J., Vazquez, D., and
Lopez, A. M. (2016). The SYNTHIA Dataset: A
Large Collection of Synthetic Images for Semantic
Segmentation of Urban Scenes. In 2016 IEEE Con-
ference on Computer Vision and Pattern Recognition
(CVPR), pages 3234–3243, Las Vegas, NV, USA.
IEEE.
Schindler, G. and Dellaert, F. (2004). Atlanta world: an
expectation maximization framework for simultane-
ous low-level edge grouping and camera calibration in
complex man-made environments. In Proceedings of
the 2004 IEEE Computer Society Conference on Com-
puter Vision and Pattern Recognition, 2004. CVPR
2004., volume 1, pages I–I.
Straub, J., Freifeld, O., Rosman, G., Leonard, J. J.,
and Fisher, J. W. (2018). The manhattan frame
Multi-view Planarity Constraints for Skyline Estimation from UAV Images in City Scale Urban Environments
859

model—manhattan world inference in the space of
surface normals. IEEE Transactions on Pattern Anal-
ysis and Machine Intelligence, 40(1):235–249.
Wang, X., Girshick, R., Gupta, A., and He, K. (2017). Non-
local neural networks.
Yang, F. and Zhou, Z. (2018). Recovering 3d planes from a
single image via convolutional neural networks.
Zhou, Q.-Y., Park, J., and Koltun, V. (2018). Open3D:
A modern library for 3D data processing.
arXiv:1801.09847.
Zhou, T., Brown, M., Snavely, N., and Lowe, D. G. (2017).
Unsupervised learning of depth and ego-motion from
video. In 2017 IEEE Conference on Computer Vision
and Pattern Recognition (CVPR), pages 6612–6619.
Zhou, Y., Qi, H., Zhai, Y., Sun, Q., Chen, Z., Wei, L.-Y., and
Ma, Y. (2019). Learning to Reconstruct 3D Manhattan
Wireframes from a Single Image. arXiv:1905.07482
[cs]. arXiv: 1905.07482.
VISAPP 2021 - 16th International Conference on Computer Vision Theory and Applications
860
