
Tropical Skin Disease Classification using Connected Attribute Filters
Fred N. Kiwanuka
1
, Omar Eltaher Abuelmaatti
1
, Anang Hudaya Muhamad Amin
1
and Brian J. Mukwaya
2
1
Division of Computer and Information Science, Higher Colleges of Technology, Dubai, U.A.E.
2
PredictX, Uganda
Keywords:
Max Tree, Connected Operators, Connected Filters, Attribute Filters, Skin Diseases, Deep Learning.
Abstract:
Morphological connected filters operate on an image through flat zones which comprise the largest connected
components with a constant signal. These filters identify and ultimately extract the whole connected com-
ponents in an image without alteration of their boundaries and thus shape preserving. This is a desirable
property in many image processing and analysis applications. However, due to the variability of the number
of connected components, even in the case of images of the same resolution and size, their application in
classification tasks has been limited. In this study, we propose an approach that computes the shape and size
features of connected components and use these features for the classification of bacterial and viral tropical
skin infections. We demonstrate the performance of the approach using gradient boosting machines and com-
pare the results to deep learning approaches. Results show that the performance of our approach is comparable
to that of Convolutional Neural Networks (CNN) based approach when trained on 1460 images. Moreover,
CNN was pre-trained and required augmentation to achieve that perfomance. However, our approach is at
least 56% faster than CNN.
1 INTRODUCTION
Mathematical morphology has contributed a wide
range of operators to image processing and analysis.
A number of efficient algorithms have been developed
for image representation and description. These oper-
ators (Salembier and Serra, 1995; Heijmans, 1999)
have been used in many applications including; medi-
cal image processing (Kiwanuka et al., 2009a), image
segmentation and reconstruction (Salembier, 2015),
object detection and recognition (Urbach, 2015), doc-
ument analysis (Ouzounis and Wilkinson, 2011),
characters recognition (Mennillo et al., 2015) video
processing(Salembier et al., 1998), color process-
ing(van de Gronde and Roerdink, 2014) as well as
remote sensing (Soille, 2008).
For many of these applications, an important task
is to extract particular regions of an image while pre-
serving as much of the contour information as possi-
ble. This is what has made connected filters (Salem-
bier and Wilkinson, 2009), a strictly edge preserv-
ing class of operators in mathematical morphology,
a popular choice of selection. These operators act by
merging flat zones, given some criteria, and filter an
image without introducing new contours. They oper-
ate on connected components rather than pixels.
A sub-class of connected filters are attribute filters
(Breen and Jones, 1996; Salembier et al., 1998). They
allow filtering based on the properties or features of
connected components in the image. Examples of
attribute filters include attribute openings, closings,
thickenings, and thinnings (Meijster and Wilkinson,
2002; Breen and Jones, 1996; Salembier et al., 1998)
(Urbach et al., 2007; Westenberg et al., 2007). At-
tribute openings (Breen and Jones, 1996; Salembier
et al., 1998) allow the use of size based features. By
contrast, attribute thinnings allow the use of shape-
based features, which require translation, scale and
rotation of invariant descriptors.
Although connected filters have been popular in
many image processing and analysis tasks, they have
hardly been used in classification tasks. This is be-
cause the majority of image classification tasks re-
quire all images to be of a fixed size. However the
number of connected components in images of even
the same pixel size varies depending on a number
of factors including connectivity of the pixels. Con-
nected and attribute filters extract connected compo-
nents using the notion of connectivity. Connectivity
describes the way pixels are grouped to form con-
nected components or flat zones in a grayscale image.
An example is shown in figure 1. As can be seen in
338
Kiwanuka, F., Abuelmaatti, O., Amin, A. and Mukwaya, B.
Tropical Skin Disease Classification using Connected Attribute Filters.
DOI: 10.5220/0010203403380345
In Proceedings of the 16th International Joint Conference on Computer Vision, Imaging and Computer Graphics Theory and Applications (VISIGRAPP 2021) - Volume 5: VISAPP, pages
338-345
ISBN: 978-989-758-488-6
Copyright
c
2021 by SCITEPRESS – Science and Technology Publications, Lda. All rights reserved

Figure 1: Sample viral infection image (left) with its
grayscale and connected peak components representation at
different threshold levels.
figure 1, the image contains object like patches and
hence makes conclusive sense to engineer features
with the notion of objects. In this paper, we propose a
classification approach based on the features of con-
nected components rather than pixels. We use images
of skin infection to demonstrate our idea.
Skin diseases classification has proven to be chal-
lenging for many approaches in the literature, includ-
ing deep learning due to diversity due to color, expo-
sure, scale, level of details, illumination and appear-
ance.
The paper is organized as follows. A brief back-
ground of the skin disease classification challenge is
first presented in Section 2. In Section 3, the theory
of connected and attribute filters is described; while
data collection is covered in Section 4. Feature en-
gineering is covered in Section 5. This includes the
attributes description,and the Max-Tree approach. In
Section 6, the performance evaluation of our approach
is presented including a discussion of the results. We
give concluding remarks in Section 7.
2 SKIN DISEASES IN TROPICAL
REGIONS
According to a global dermatology report published
in 2017 (Karimkhani et al., 2017), skin diseases rep-
resent up to 23.7% of the main organ-specific reasons
for visiting a primary healthcare centre in Sub Sahara
Africa. In Uganda, the cause of death attributed to
skin diseases in 2017 was 0.36% of total deaths. The
cause of a skin infection depends on the type of infec-
tion. The most common skin conditions in Sub Sahara
Africa are attributed to bacterial, viral and fungal in-
fections. According to the World health Organization,
this is attributed mainly to the hot humid climates,
poor living conditions and overcrowding.
Bacterial skin infections often begin as small, red
bumps that slowly increase in size. Some bacterial
infections are mild and easily treated with topical an-
tibiotics, however other infections require an oral an-
tibiotic.There are different types of bacterial skin in-
fections including; cellulitis, impetigo, boils, and lep-
rosy.
Viral skin infections are caused by a virus. These
infections range from mild to severe. Examples of vi-
ral infections include; shingles (herpes zoster), chick-
enpox, Molluscum contagiosum, warts, measles, and
hand, foot, and mouth disease.
Fungal skin infections are caused by a fungus and
are most likely to develop in damp areas of the body,
such as the feet or armpit. Many fungal infections
are typically non-life-threatening and can include ath-
lete’s foot, yeast infection, ringworm, nail fungus,
oral thrush, and diaper rash.
A variety of skin tests may be performed to diag-
nose skin allergies, bacterial, viral, or fungal skin in-
fections. A culture test is a widely used method that is
done to identify the microorganism (bacteria, fungus,
or virus) that cause the infection. Skin (surface scrap-
ings, biopsies, contents of pus bumps and blisters),
hair, or nails may be cultured to detect bacteria, fungi,
or viruses. However, poverty and a very high patients-
to-dermatologist ratio in Sub Saharan African coun-
tries hinders proper diagnosis using culture tests. The
commonest diagnosis in these countries is often, vi-
sual inspection of symptoms based on the appearance
and location. This leads to misdiagnosis and unnec-
essary economic burden since some infections do not
require medication. For example some types of viral
skin infections may improve on their own and heal
within days or weeks.
The boundary between these two cases in many
diagnoses is difficult to be drawn. To illustrate the
nature of this problem, and its difficulties, we show
examples of image patches as shown in Fig. 2. In
this research we attempt to automate this boundary
separation using machine learning. We focus on viral
and bacterial as there was no sufficient data for fungal
infection.
2.1 Related Work
A number of studies have looked at image processing
and computer vision methodology for automated di-
agnosis of skin diseases. (Liao et al., 2018), investi-
gated the feasibility of constructing a universal skin
disease diagnosis system using deep Convolutional
Neural Networks (CNN). They trained the CNN ar-
chitecture using 23,000 skin disease images from
the Dermnet dataset and tested its performance on
Tropical Skin Disease Classification using Connected Attribute Filters
339
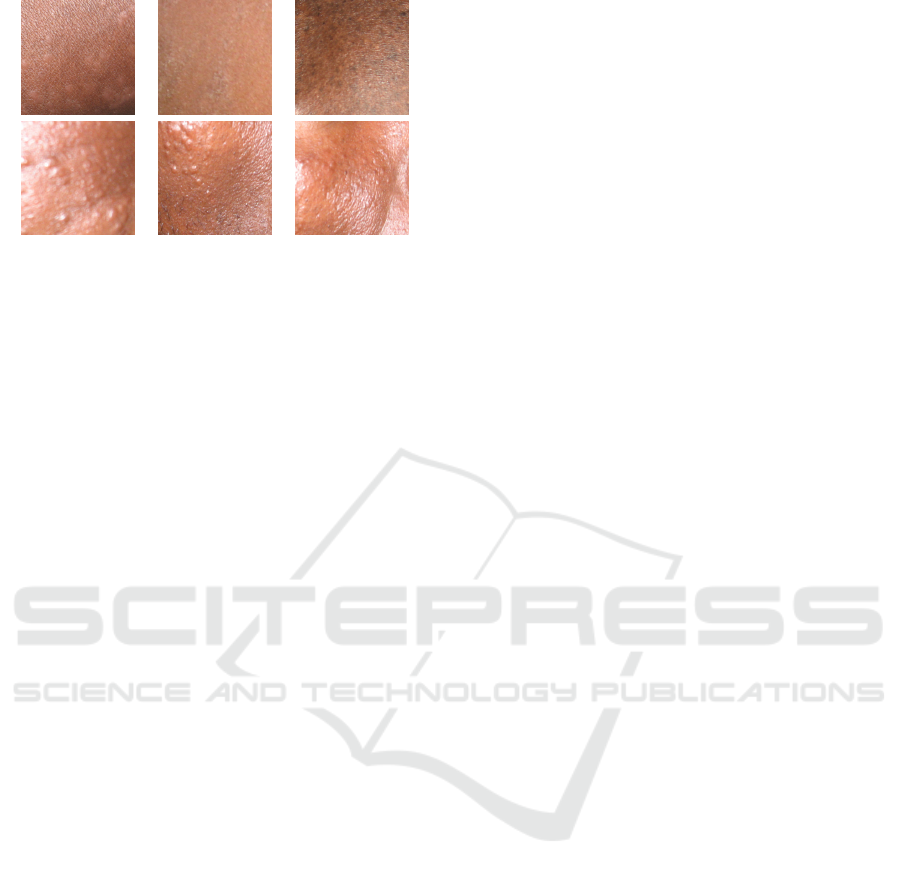
Figure 2: Sample images, viral images at the top and bacte-
rial cases at the bottom.
Dermnet and OLE skin disease open dataset. Another
study by (Sun et al., 2016), introduced a benchmark
multiclass dataset for clinical skin diseases for clas-
sification. They used 6,584 images from 198 classes
of varying scale, some color, shape and structure and
used CNN for the classification. A number of other
studies have proposed other approaches for a review
see (Barati et al., 2011), (Bi et al., 2017), (Romero-
Lopez et al., 2017), (Pomponiu et al., 2016).
Unlike these approaches, our approach is con-
nected component based rather than pixel based.
They also utilized open sourced popular datasets of
dermoscopic images, none of which is from tropical
region based that comes with its own challenges of
disease.
In this research we use real field conditions of
skin infection datasets taken using a mobile phone in
Uganda and to the best of our knowledge connected
filters have not been used in classification tasks of this
nature. An attempt to use them was made in (Quinn
et al., 2014).
3 CONNECTED FILTERS
This section briefly reviews the concept of connected
attribute filters. Let binary images X, Y be subsets
of E, where E is a non-empty universal set with
P (E)being a family of all subsets of E. If the images
are grey-scale then it becomes a mapping from E to
some subset of R or Z. We say a set C ⊆ X is a con-
nected component of X if C is connected, and if there
is any other such that connected set D, C ⊆ D ⊆ X
then C is equal to D (Kiwanuka and Wilkinson, 2015).
3.1 Attribute Filters
An operator ψ (Heijmans, 1999) operating on binary
image X is connected if and only if the set difference
X\ψ(X ) is exclusively composed of the connected
components of X or its complement X
c
. To extract
connected components from images, we use a family
of operators called connectivity openings. Let Γ
x
(X)
be the connectivity openings x ∈ E, Γ
x
(X) returns all
the connected sets within X that have a point x ∈ E in
their intersection. If the union is C, then C ⊆ X, such
that x ∈ C, is the maximal connected set containing x
(Serra, 1998).
Given Γ
x
(X) of X at a point x ∈ E with C a subset
of P (E), binary connectivity opening are defined in
(Kiwanuka and Wilkinson, 2015) as :
Γ
x
(X) =
(
S
{C
i
∈C|x ∈ C
i
, C
i
⊆ X } if x ∈ X
/
0 otherwise.
(1)
C ⊆ P (E) is the family of all connected sets in E.
A class of connectivity openings has the properties
of: (i) anti-extensive since Γ
x
(X) ⊆ X, (ii) increasing
since X ⊆ Y ⇒ Γ
x
(X) ⊆ Γ
x
(Y ) this is the case of size
based filtering criteria. It becomes non-increasing for
shape based and (iii) idempotent since Γ
x
(Γ
x
(X)) =
Γ
x
(X).
Once the connected components have been ex-
tracted, then attributes to filter the connected con-
nected components is then computed. This where
attribute filters (Breen and Jones, 1996; Salembier
et al., 1998), a family of connectivity openings that
imposes constraints on the connected components
they return comes in. The constraints are expressed
in the form of a binary criteria to make a decision of
whether to accept or to reject components. Breen and
Jones (Breen and Jones, 1996) define the attribute cri-
terion as:
Λ(C) ≡ Attribute(C) ≥ λ, (2)
with Attribute(C) is the attribute of the connnected
component C and λ the threshold. In our classification
task, our interest is this attribute computed here.
After extracting the connected components using
connectivity openings and attribute computed, the fil-
tering is then applied. If ψ
Λ
is the filter and Λ is the
attribute criteria, then ψ
Λ
can be defined as
ψ
Λ
(C) =
(
C if Λ(C) is true
/
0 otherwise
(3)
The result of the filtering of the image X is then given
as:
ψ
Λ
(X) =
[
x∈X
ψ
Λ
(Γ
x
(X)) (4)
This represents the union of all connected fore-
ground components which meet criterion Λ. The dual
counterparts of these operators are attribute closings
and thickening respectively and can be defined as
Ψ
Λ
(X) = (ψ
Λ
(X
c
))
c
(5)
VISAPP 2021 - 16th International Conference on Computer Vision Theory and Applications
340

where X
c
= E \ X denotes the complement of X. This
removes connected background components which
do not meet the criterion Λ. The attribute could be
for example area of a connected component which is
then compared to Λ which is a predefined threshold
and returning true if the value is above the threshold
and false otherwise. In our approach we do not re-
quire this.
The same principle can be extended to gray scale
images (Breen and Jones, 1996; Salembier and Serra,
1995), where connectivity rely on the notion of par-
titions of flat zones. A partition is defined as the set
of non overlapping, non void regions within the im-
age domain E. More formally, Connected operators
in this case act on connected components of level set
images L
h
of image f which can be defined as:
L
h
( f ) = {x ∈ E| f (x) = h}. (6)
Where h is the gray level of the image. There is
a binarization at every level L
h
of the image. For
more on connected operators see (Breen and Jones,
1996; Salembier et al., 1998; Urbach et al., 2007),
(Kiwanuka and Wilkinson, 2015).
4 DATA COLLECTION
Through a NUFFIC funded project, skin infected im-
ages were collected from skin clinics in three Ugan-
dan districts of Kampala, Gulu and Mbarara. First, the
patients were clinically examined by dermatologists,
then culture laboratory tests were conducted to ascer-
tain and confirm the skin infection. The dermatolo-
gists then captured more images using a 4MB pixel
resolution phone camera from the patients whose re-
sults were indicative of either a viral or bacterial in-
fection. The images were then preprocessed and in
some cases were split where it was deemed that differ-
ent parts of the images were fairly distinct and would
aid the classification. 1824 images (912 viral, 912
bacteria) were captured. Fig. 2 shows examples of
the sample images for bacterial and viral skin dis-
eases. Each image is of size 80x80 pixels.
5 CONNECTED COMPONENTS
FEATURE ENGINEERING
A large number of both size and shape features is
available for connected filtering for 2D and 3D imag-
ing modes (Breen and Jones, 1996; Salembier et al.,
1998; Urbach et al., 2007; Kiwanuka et al., 2009a).
These features enhance the ability of connected filters
to select structures of interest for different imaging
modalities. However in this research we utilize them
for classification. Specifically, we compute attributes
for 2D imaging modes.
5.1 Size based Features
For size based attributes, we considered:
• Area - area is easily estimated by counting the
number of pixels that constitute a connected com-
ponent.
• Perimeter of a connected component
• Minimum child gray level of peak connected
component
• Current gray level of peak connected component
• Maximum child gray level - current gray level
5.2 Shape based Features
Features are considered as shape descriptors pro-
vided they satisfy three key properties: translation,
scale, and rotation invariance. We considered mo-
ment based attributes like moment of inertia, non-
compactness, elongation, flatness, sparseness, and
jaggedness. For all these attributes and their vari-
ants see (Urbach, 2015), (Kiwanuka et al., 2009a),
(Kiwanuka et al., 2009b), (Kiwanuka and Wilkinson,
2010), (Quinn et al., 2014), (Kiwanuka and Wilkin-
son, 2015). Here briefly is a formulation of some of
them. The moment-of-inertia I(C) of an object can be
defined as its tensor which is equivalent to the covari-
ance matrix multiplied by the number of pixels in a
connected component(C). The compactness attribute
N(C) is defined as
N(C) =
P
2
(C))
4πA(C)
(7)
where A is the area of each connected component
and P is the perimeter. Other moment-invariants can
be obtained using geometric interpretation from the
eigenvalues of tensor matrix and are derived as fol-
lows. Let e
1
(C), e
2
(C) and e
3
(C) be the three (real)
eigenvalues of I(C) such that:
|e
1
(C)| ≥ |e
2
(C)| ≥ |e
3
(C)| (8)
The measure of elongation ξ(C) is given by
ξ(C) =
|e
1
(C)|
|e
2
(C)|
(9)
While flatness z(C) is given by:
z(C) =
|e
2
(C)|
|e
3
(C)|
(10)
Tropical Skin Disease Classification using Connected Attribute Filters
341

We also considered four non-normalized central
moments and the normalized geometric moments.
For more about these features see (Urbach et al.,
2007).
In total we computed 14 size and shape features
for each connected component.
5.3 Computing Features using the Max
Tree Data Structure
We utilized the Max-Tree data structure (Salembier
et al., 1998) an efficient data structure for gray scale
image processing. In the Max Tree data structure, the
filtering process is made of four stages: the creation of
Max-Tree, feature computation, filtering, and restitu-
tion. In our approach, we only use the first two stages.
Many fast algorithms have been developed to
build a Max-Tree like (Salembier et al., 1998; Wilkin-
son, 2011). Like any other tree based data structure,
the Max tree arranges the connected component of an
image into a tree with the root node acting as a par-
ent to all subsequent nodes where for the case of gray
scale images, a node represents a flat zone L
h
where
a set of pixels adopts a single gray-level value of the
highest node within that subset. Binarization of the
image is then carried out at each level h to obtain the
thresholded set consisting of peak components, P
k
h
,
whose gray-level ≥ h (k is node index). C
k
h
are the
components in P
k
h
with gray-level h. An example of
the Max tree is shown in Fig. 3. There are two ways
to compute the attributes. One is during the Max Tree
building phase where data needed for computing the
node features is collected. This data can then be used
to compute the features, that describe shape or size of
the peak components represented by the nodes.
Once the features have been computed, then the
filtering process is done to decide what connected
components preserve usually based on certain rules
like the Direct, Min, Max, and Viterbi rules (Breen
and Jones, 1996), or the Subtractive rule (Urbach
et al., 2007). However, in our research, rather than
filter, we simply stack the features for each image. It
is these features that we use as input for training our
Gradient boosting model. To deal with the variable
number of connected components of the different im-
ages, we fix the number of connected components of
all images to be equal to the worst case of the number
of pixels in the image. In practice, instead of repre-
senting the image with pixel values we represent the
image as a set of connected components. We then
compute the features for those connected components
using the Max-Tree data structure. Suppose, the num-
ber of connected components in an image is n and the
size of the image is MxN, where n ≤ MxN during the
P
0
0
P
0
30
P
1
30
P
1
60
P
0
60
P
0
90
P
1
90
Input image Thresholded sets(peaks) Max-Tree
Figure 3: An example of a Max-Tree representation of a
simple 4-level image.
feature preparation for training, we enforce that n =
MxN by assigning zeros to the extra components cre-
ated.
6 CLASSIFICATION
In this section we describe the training process of two
approaches:
1. Our approach : connected components feature en-
gineering
2. Convolutional Neural Networks (CNN) approach
that trains a model from scratch using our little
data that we have.We then use data augmentation
and finally use a pre-trained CNN model
6.1 Connected Feature Approach:
Implementation
We computed 14 features for each connected compo-
nent in the image and stacked them. We then nor-
malized each image to have the number of connected
components to be equal to the size of the image MxN.
The extra connected components have features set at
zero. Let n be the actual number of connected com-
ponent and E the number of pixels in the image. The
number of connected components set to zero can be
given as the difference E − n. During the exploratory
analysis we had carried out feature selection to nar-
row down the features with the most informative for
our task.
To establish the performance of our proposed con-
nected attribute filters approach, we ran experiments
on the skin disease dataset and evaluated the perfor-
mance of these features. In all of the experiments,
we randomly split the datasets into 80 % and 20%
from each class as the training set and the rest as test-
ing set respectively. For the training we used gradi-
ent boosting machines classifier. A gradient boosting
machine, much like a random forest, is a machine-
learning technique based on ensembling weak predic-
tion models, generally decision trees. It uses gradi-
ent boosting, a way to improve any machine-learning
model by iteratively training new models that special-
ize in addressing the weak points of the previous mod-
VISAPP 2021 - 16th International Conference on Computer Vision Theory and Applications
342

els. The choice of gradient boosting is due to its ex-
cellent ability to deal with non perceptual data and
being one of the most commonly used techniques in
Kaggle competitions besides deep learning.
To ensure that we reduce overfitting, we employed
regularization methods that penalize various parts of
the algorithm and generally improve the performance
of the algorithm. Experimentally:
• Choose a learning rate of 0.05 after experimenting
with the rates between 0.05 and 0.2.
• The optimum number of trees for this learning
rate was 2435.
• Fixed tree hyperparameters and tune learning rate
and assessed speed and performance.
• Tuned tree-specific parameters for decided learn-
ing rate.
• Hyperparameter settings was carried and cross
validation procedures to get more robust esti-
mates.
6.2 Convolutional Neural Networks
(CNN)
We first trained a CNN model from scratch on our
dataset but we split the data in 60% training, 20%
for validation and 20% testing. For the implementa-
tion of CNN, we stacked alternated Conv2D with relu
activation and MaxPooling2D layers to augment the
capacity of the network and also reduce the size of
the feature maps before the flatten layer. We ended
with a network with a Dense layer of size 1 using
a sigmoid activation. Even with numerous experi-
mentation with various architectures and parameters
tuning, it was apparent that the network was overfit-
ting. The training accuracy increased linearly over
time, until it reached nearly 78%, whereas the vali-
dation accuracy stalled at about 56%. The validation
loss reached its minimum after a few epochs and then
stalled, whereas the training loss kept decreasing lin-
early until it reaches near zero.
We then explored data augmentation to deal with
the overfitting problem. We trained a new network
using data-augmentation configuration. As such, this
was not enough to completely get rid of overfitting.
To further fight overfitting, we added a Dropout layer
to our model before the densely connected classifier.
By using regularization and tuning the network’s pa-
rameters including the number of filters per convolu-
tion layer, and the number of layers in the network,
we reached an accuracy of 68.6%, a 13% relative im-
provement.
It became apparent that it would be difficult to
go any higher just by training your own CNN from
scratch, because of the not sufficient data to work
with. As a next step to improve accuracy on this prob-
lem, we explored using a pretrained model.
We used a pretrained network of ImageNet
(Krizhevsky et al., 2012) a popular computer vision
model trained on a large dataset for large-scale image-
classification task with 1.4 million labeled images and
1,000 different classes.
Given that the original dataset is large enough and
general enough, then the spatial hierarchy of features
learned by the pretrained network can effectively act
as a generic model for our skin classification prob-
lem even though our problem has completely differ-
ent classes than those of the original task. A num-
ber of skin classification (Bi et al., 2017), (Romero-
Lopez et al., 2017), (Pomponiu et al., 2016), studies
have used this pretrained CNN models of ImageNet
reporting very high accuracy of at least 90%. We
used the VGG16 architecture (Simonyan and Zisser-
man, 2015) because of its simplest and wide use. We
considered a pretrained network with feature extrac-
tion.
Using the convolutional base of the VGG16 net-
work, trained on ImageNet, to extract features from
images, and then train virus and bacteria classifier on
top of these features. Due to the skin classes in our
dataset, we changed the original 1000 classes clas-
sification layer to a binary layer, whose weights are
randomly initialized, then added Dense layers on top,
and run it end to end. We also employed data aug-
mentation, which as seen earlier improved accuracy
earlier and reduced overfitting. Before compiling and
training the model, we freeze the convolutional base
thus preventing the weights from being updated dur-
ing training. However this technique is far more com-
putationally expensive.
We were able to achieve an accuracy of about
76.3%. This is much better than that trained from
scratch.
6.3 Evaluation
From the experiments, gradient boosting using our
features from connected components achieved an ac-
curacy of 75.2% as compared to the best convolution
neural networks which achieved 76.3%. The perfor-
mance of the two approaches is relatively low com-
pared to approaches seen in literature for skin classi-
fication like in (Bi et al., 2017), (Romero-Lopez et al.,
2017), (Pomponiu et al., 2016), this can be explained
by the nature of the dataset. The field conditions, the
type of skin and other factors make this dataset difi-
cult to classify. For many images in our dataset as
seen in Fig. 2, viral and bacterial patches tend to
Tropical Skin Disease Classification using Connected Attribute Filters
343
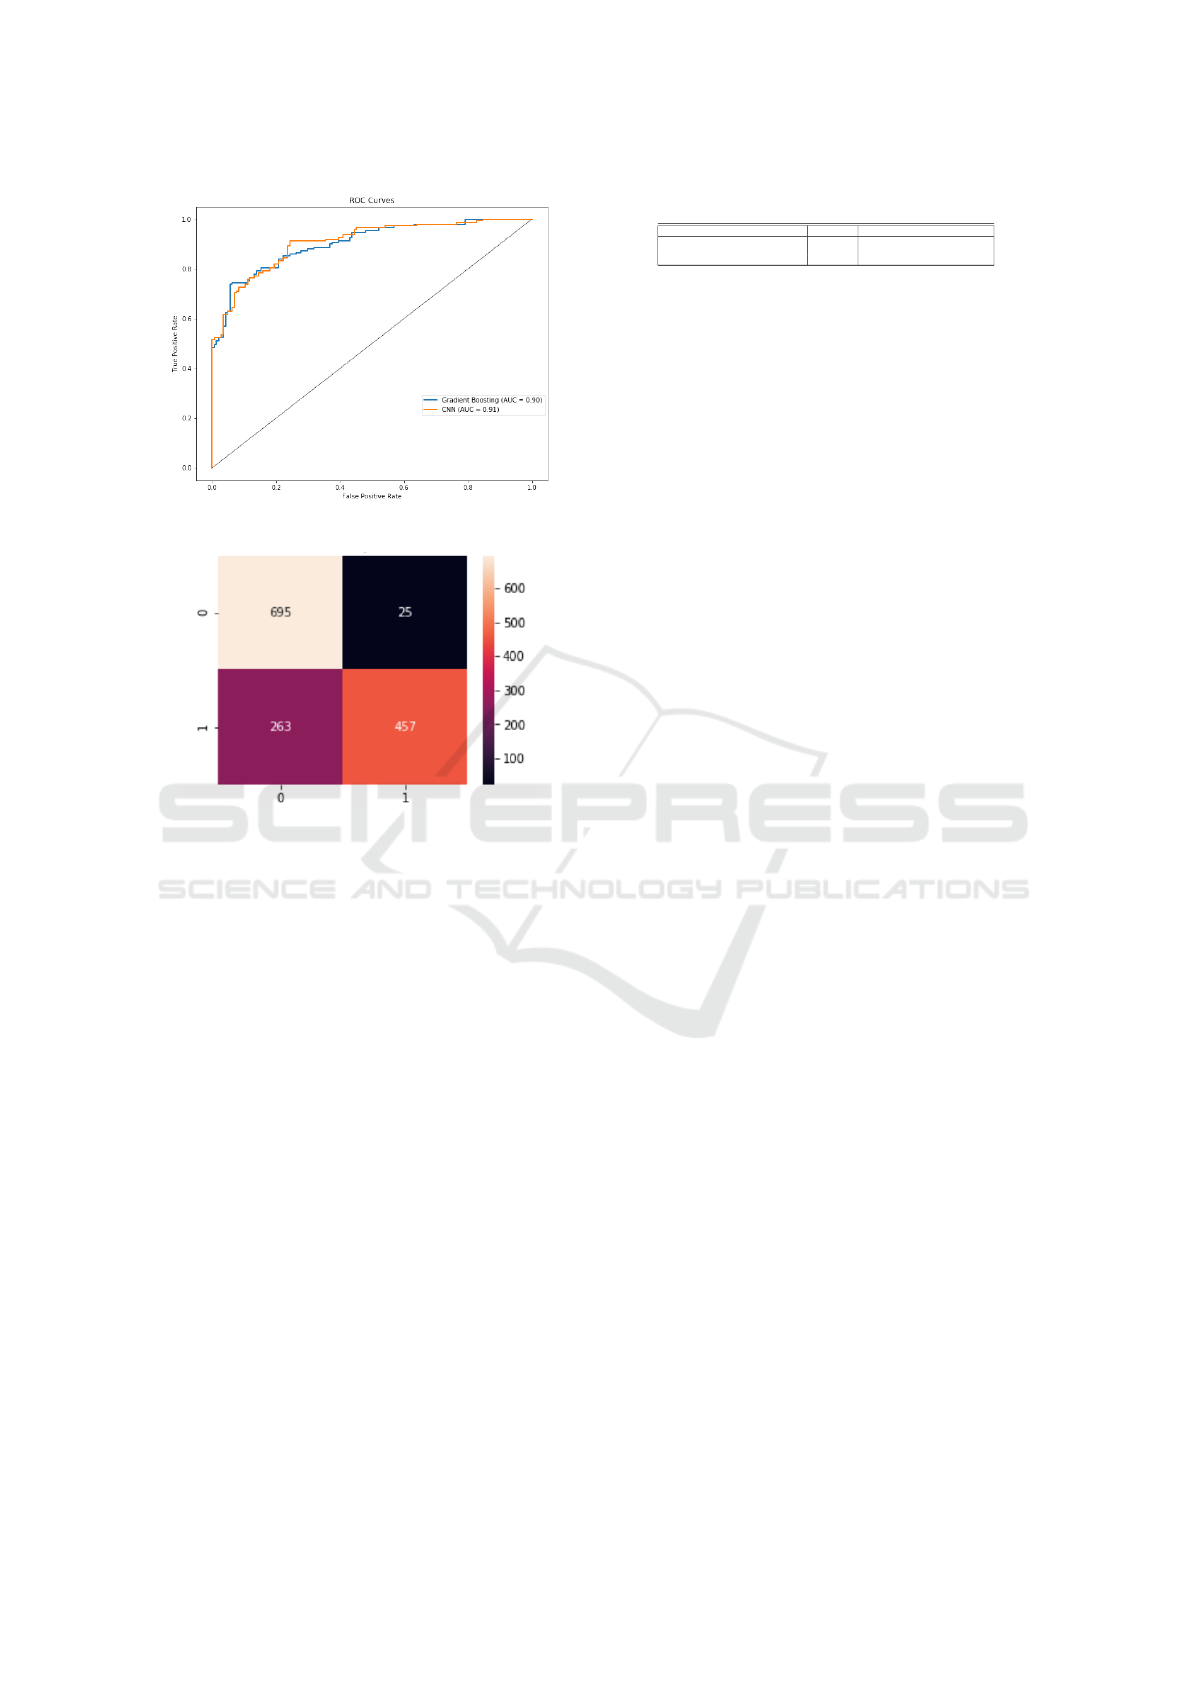
Figure 4: ROC curves for Gradient Boosting and CNN.
Figure 5: Confusion Matrix with Bacterial (0) and Viral (1)
infection.
blend into normal skin, making separating the two
classes more difficult as compared to open datasets
like those used in (Bi et al., 2017), (Romero-Lopez
et al., 2017), (Pomponiu et al., 2016). However, our
approach was faster in computing times by at least
56% as seen in Table 1.
The Receiver Operating Characteristic (ROC)
curve is shown in Figure 4. ROC curve for our ap-
proach and CNN showed a similar performance be-
tween the two approaches. The Area Under the Curve
(AUC) of 0.90 and 0.91 indicates that the classifier
performs well.
The confusion matrix in Fig. 5 shows that the gra-
dient boosting classifier performed well on classify-
ing the bacterial infection (0) as compared to the viral
infection (1). This can be attributed to the nature of
bacterial infections having a clear morphological vi-
sual description of bumps as compared to the viral
infections as seen in Fig. 2.
6.4 Computational Timings
Using a standard Core 4 Duo E8400 at 2.0 GHz ma-
chine with 16 GB RAM, we performed timings for
Table 1: Performance Evaluation.
Model Accuracy(%) Computing Algorithms Time(seconds)
Gradient Boosting using Connected Filters 75.1 216
CNN with augmentation 68.0 313
Pre-trained CNN 76.2 338
the computation of our approach and that of CNN. For
the connected attribute filter approach the timings in-
clude the time to compute the attributes from the max
Tree as well as the training. For the CNN, since the
feature engineering is inherently learned during the
training, the timing include the whole cycle of, defin-
ing the model, compiling the model, and fitting the
model. The performance of the two approaches can
be seen in Table. 1 where it is clear that our approach
was faster in computing times by at least 56%.
7 CONCLUSIONS
In this paper, we proposed an approach for using con-
nected attribute filters for classifying skin infections.
With 75.1% level of accuracy, our approach is com-
parable to the performance of Convolutional Neural
Networks. We compared the classification accuracy
of a CNN trained from scratch, a pretrained CNN
with transfer learning and frozen layers. All three
configurations were tested with 364 images and the
last-mentioned configuration achieved the highest ac-
curacy of 76.3% Our approach is at least 56% faster
than CNN in computational time. In future, we intend
to investigate the performance of our approach when
combined with deep learning. This should be possi-
ble since connected filters tend to behave by design
like deep learning models with the flat zones as hid-
den layers as used in deep learning, however without
back propagation.
REFERENCES
Barati, E., Saraee, M. M., Mohammadi, A., Adibi, N., and
Ahmadzadeh (2011). A survey on utilization of data
mining approaches for dermatological (skin) diseases
prediction.
Bi, L., Kim, J., Ahn, E., and Feng, D. (2017). Au-
tomatic skin lesion analysis using large-scale der-
moscopy images and deep residual networks. ArXiv,
abs/1703.04197.
Breen, E. J. and Jones, R. (1996). Attribute openings, thin-
nings and granulometries. Comp. Vis. Image Under-
stand., 64(3):377–389.
Heijmans, H. J. A. M. (1999). Connected morphological
operators for binary images. Comp. Vis. Image Un-
derstand., 73:99–120.
Karimkhani, C., Dellavalle, R. P., Coffeng, L. E., Flohr,
C., Hay, R. J., Langan, S. M., Nsoesie, E. O., Fer-
rari, A. J., Erskine, H. E., Silverberg, J. I., Vos, T.,
VISAPP 2021 - 16th International Conference on Computer Vision Theory and Applications
344

and Naghavi, M. (2017). Global Skin Disease Mor-
bidity and Mortality: An Update From the Global
Burden of Disease Study 2013. JAMA Dermatology,
153(5):406–412.
Kiwanuka, F. N., Ouzounis, G. K., and Wilkinson, M. H.
(2009a). Surface-area-based attribute filtering in 3d.
In Proceedings of the 9th ISMM ’09, pages 70–81,
Berlin, Heidelberg. Springer-Verlag.
Kiwanuka, F. N., Ouzounis, G. K., and Wilkinson, M. H.
(2009b). Surface-area-based attribute filtering in 3d.
In Proceedings of the 9th ISMM ’09, pages 70–81,
Berlin, Heidelberg. Springer-Verlag.
Kiwanuka, F. N. and Wilkinson, M. (2015). Cluster based
vector attribute filtering. In ISMM.
Kiwanuka, F. N. and Wilkinson, M. H. F. (2010). Ra-
dial moment invariants for attribute filtering in 3D.
In K
¨
athe, U., Montanvert, A., and Soille, P., editors,
Proc. Workshop on Applications of Discrete Geometry
and Mathematical Morphology (WADGMM), pages
37–41.
Krizhevsky, A., Sutskever, I., and Hinton, G. E. (2012).
Imagenet classification with deep convolutional neu-
ral networks. In Pereira, F., Burges, C. J. C., Bottou,
L., and Weinberger, K. Q., editors, Advances in Neu-
ral Information Processing Systems 25, pages 1097–
1105. Curran Associates, Inc.
Liao, H., Li, Y., and Luo, J. (2018). Skin disease classifica-
tion versus skin lesion characterization: Achieving ro-
bust diagnosis using multi-label deep neural networks.
CoRR, abs/1812.03520.
Meijster, A. and Wilkinson, M. H. F. (2002). A comparison
of algorithms for connected set openings and closings.
IEEE Trans. Pattern Anal. Mach. Intell., 24(4):484–
494.
Mennillo, L., Cousty, J., and Najman, L. (2015). A com-
parison of some morphological filters for improving
ocr performance. In Benediktsson, J. A., Chanussot,
J., Najman, L., and Talbot, H., editors, Mathematical
Morphology and Its Applications to Signal and Image
Processing, volume 9082 of Lecture Notes in Com-
puter Science, pages 134–145. Springer International
Publishing.
Ouzounis, G. K. and Wilkinson, M. H. F. (2011). Hyper-
connected attribute filters based on k-flat zones. IEEE
Trans. Pattern Anal. Mach. Intell., 33(2):224–239.
Pomponiu, V., Nejati, H., and Cheung, N. . (2016). Deep-
mole: Deep neural networks for skin mole lesion clas-
sification. In 2016 IEEE International Conference on
Image Processing (ICIP), pages 2623–2627.
Quinn, J. A., Munabi, I., and Kiwanuka, F. N. (2014). Auto-
mated blood smear analysis for mobile malaria diag-
nosis. In In W. Karlen and K. Iniewski, editors, Mobile
Point-of-Care Monitors and Diagnostic Devices. CRC
Press 2014.
Romero-Lopez, A., Burdick, J., i Nieto, X. G., and Mar-
ques, O. (2017). Skin lesion classification from der-
moscopic images using deep learning.
Salembier, P. (2015). Study of binary partition tree pruning
techniques for polarimetric sar images. In Benedik-
tsson, J. A., Chanussot, J., Najman, L., and Talbot,
H., editors, Mathematical Morphology and Its Appli-
cations to Signal and Image Processing, volume 9082
of Lecture Notes in Computer Science, pages 51–62.
Springer International Publishing.
Salembier, P., Oliveras, A., and Garrido, L. (1998). Anti-
extensive connected operators for image and sequence
processing. IEEE Trans. Image Proc., 7:555–570.
Salembier, P. and Serra, J. (1995). Flat zones filtering, con-
nected operators, and filters by reconstruction. IEEE
Transactions on Image Processing, 4:1153–1160.
Salembier, P. and Wilkinson, M. H. F. (2009). Connected
operators: A review of region-based morphological
image processing techniques. IEEE Signal Process-
ing Magazine, 26(6):136–157.
Serra, J. (1998). Connectivity on complete lattices. J. Math.
Imag. Vis., 9(3):231–251.
Simonyan, K. and Zisserman, A. (2015). Very deep con-
volutional networks for large-scale image recognition.
In International Conference on Learning Representa-
tions.
Soille, P. (2008). Constrained connectivity and connected
filters. IEEE Trans. Pattern Anal. Mach. Intell.,
30(7):1132–1145.
Sun, X., Yang, J., Sun, M., and Wang, K. (2016). A
benchmark for automatic visual classification of clin-
ical skin disease images. In ECCV.
Urbach, E. (2015). Intelligent object detection using trees.
In Benediktsson, J. A., Chanussot, J., Najman, L., and
Talbot, H., editors, Mathematical Morphology and Its
Applications to Signal and Image Processing, volume
9082 of Lecture Notes in Computer Science, pages
289–300. Springer International Publishing.
Urbach, E. R., Roerdink, J. B. T. M., and Wilkinson, M.
H. F. (2007). Connected shape-size pattern spectra
for rotation and scale-invariant classification of gray-
scale images. IEEE Trans. Pattern Anal. Mach. Intell.,
29:272–285.
van de Gronde, J. and Roerdink, J. (2014). Group-invariant
colour morphology based on frames. Image Process-
ing, IEEE Transactions on, 23(3):1276–1288.
Westenberg, M. A., Roerdink, J. B. T. M., and Wilkinson,
M. H. F. (2007). Volumetric attribute filtering and in-
teractive visualization using the max-tree representa-
tion. IEEE Trans. Image Proc., 16:2943–2952.
Wilkinson, M. H. F. (2011). A fast component-tree algo-
rithm for high dynamic-range images and second gen-
eration connectivity. In Proc. Int. Conf. Image Proc.
2011, pages 1041–1044.
Tropical Skin Disease Classification using Connected Attribute Filters
345
