
Relocation with Coverage and Intersection over Union Loss for
Target Matching
Zejin Lu
1,2
, Jinqi Liao
2
, Jiyang Lv
2
and Fengjun Chen
1,2
1
State Key Laboratory of Advanced Design and Manufacturing for Vehicle Body, Hunan University,
Changsha, Hunan, China
2
National Engineering Research Center for High Efficiency Grinding, Hunan University, Changsha, Hunan, China
Keywords: Target Matching, Object Detection, Deep Learning, Relocation Strategy, Loss Function.
Abstract: Target matching is a common task in the field of computer vision, which has a wide range of implements in
the fields of target tracking, medical image analysis, robot navigation, etc. The tasks in these scenarios have
high requirements for locating accuracy, reliability and robustness, but the existing methods cannot meet these
requirements. To improve the algorithm performance in these aspects, a novel practical target matching
framework is proposed in this paper. We firstly present a new bounding box regression metric called
Coverage-Intersection over Union (Co-IoU) to obtain higher positioning accuracy performance compared to
previous bounding regression strategies. Also, a reasonable region validation and filter strategy is proposed
to reduce the false positive matches and the Region of Interest (ROI) adjustment and relocation matching
strategy are innovatively present to acquire higher locating accuracy. Our experiments show that the proposed
framework is more robust, accurate and reliable than the previous relevant algorithms. Besides, Coverage-
Intersection over Union Loss and relocation strategy proposed in this paper can significantly improve the
performance of the general object detector as well.
1 INTRODUCTION
Target matching is a basic problem in computer
vision, of which purpose is to find the position of the
specific target object in the whole image, it has a wide
range of applications involving manufacturing,
detecting edges in images, and medical image
analysis (James and Alex Pappachen, 2014).
There are two common ways of target matching
task. One is in template matching approach that
focuses on matching the similarity of pixel
information without semantics information between
matching patches pairs (Hashemi et al., 2016).
Another way named instance detection (Nan et al.,
2019) is to take advantage of semantic information in
instance templates to match and locate targets.
In template matching way, the approach based on
region is more frequently used in many real-world
scenarios. Normalized Cross-Correlation, NCC) is a
representative template matching method (James et
al., 2014), which is invariant to linear brightness and
contrast changes, but it is still sensitive to rotation,
scale changes, and background changes, which
imposes some restrictions on deforming templates or
complex backgrounds (Perveen et al., 2016). Best-
Buddies Similarity (BBS) can overcome outliers (i.e.,
background noise, occlusion) and target nonrigid
distortion (Dekel et al., 2015), but when the scale
ratio of the template to the target image is small or
outliers (occlusion or background clutter) cover most
templates, the success rate decreases. Co-occurrence
based template matching (CoTM) improves the
performance of target matching (Kat et al., 2018), but
is susceptible to interference from areas with similar
pixel colour distribution. Quality-aware template
matching (QATM) is one of the best template
methods so far, and the parameters of QATM can be
trained by a neural network to improve the
performance of matching (Cheng et al., 2019).
However, this method is still sensitive to lighting,
noise, and scale changes, and the time consuming is
unacceptable in many applications.
Another way in instance detection is to make use
of semantic information from instance templates to
solve the problem of target matching. The Target
Driven Instance Detection (TDID) based on Faster
RCNN (Ren et al., 2017) two-stage detector and
an instance template to boost target matching
Lu, Z., Liao, J., Lv, J. and Chen, F.
Relocation with Coverage and Intersection over Union Loss for Target Matching.
DOI: 10.5220/0010191802530260
In Proceedings of the 16th International Joint Conference on Computer Vision, Imaging and Computer Graphics Theory and Applications (VISIGRAPP 2021) - Volume 4: VISAPP, pages
253-260
ISBN: 978-989-758-488-6
Copyright
c
2021 by SCITEPRESS – Science and Technology Publications, Lda. All rights reserved
253
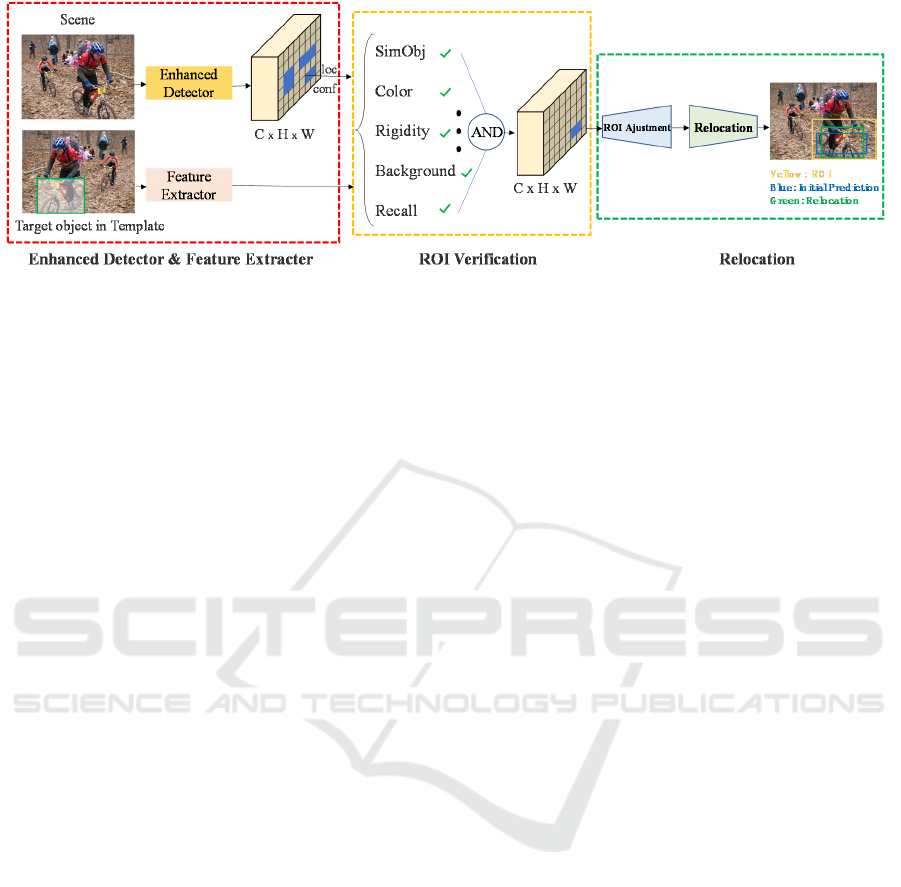
Figure 1: Pipeline of target matching framework. Enhanced Detector & Feature Extractor shows feature extracted by the
enhanced detector from the target object in the scene and template. ROI Verification demonstrates the similarity metrics of
the selected ROI in the patch pair feature. Relocation shows the ROI adjustment and relocation process. The blue in the final
result output chart is the coarse positioning box, the yellow is the region of interest after region screening and adjustment,
and the green is the output after relocation.
positioning (Ammirato et al., 2018), which improves
the accuracy, but the false positives is still high. (Nan,
et al., 2019) proposed a feature extraction method to
measure the similarity between the matched
positioning result and the instance template to filter
the mismatch result, which improves the positioning
reliability, but the algorithm is time-consuming.
Moreover, in target detection framework, bounding
box regression is a significant step to predict
bounding boxes to locate the target, which can also
greatly affect the final positioning` accuracy. Loss
function like Intersection over Union (IoU) loss is
optimized by calculating the ratio of the intersection
and union between the prediction box and the real box
(Rezatofighi et al., 2019), but the problem is that only
two boxes that intersect can be returned. Generalized
Intersection over Union (GIoU) solves the
optimization problem when no intersection exists by
expanding the prediction box, but this method takes
too long. Distance Intersection over Union (DIoU)
reduces the iteration time and improves the accuracy
by adding the loss of the distance between the
prediction box and the true box center (Nan, et al.,
2019), but the recall rate and coverage of the
regression shape can still improve.
In this paper, we present a novel target matching
framework. Firstly, we design a new bounding box
regression strategy called Coverage with intersection
over union loss function (Coverage-IoU), based on
which the detector can achieve higher locating
precision in target matching tasks. Moreover, a
verification strategy is present to reduce false positive
in matching. And we finally propose a relocation
strategy to locate in higher precision. Overall,
Compared with the previous methods, the framework
we proposed can improve the target locating
performance without instance-level labels and shows
strong robustness and fast speed in various scales,
lighting, stain noise and other difficult environments,
which means it is practical for the application in real-
world scenes.
The contribution of our work is summarized as
follows:
A coverage-intersection over union loss, i.e.,
Coverage-IoU loss, is proposed by considering
four geometric measures, i.e., corner points
distance, coverage area, overlap area and shape
recall, which better describes the regression of
rectangular boxes.
A verification strategy is presented to
effectively filter regions of interest without
target object, which can reduce the false
positive detection rate and improve the overall
performance of target matching.
A relocation strategy is proposed to improve
the performance of the target matching
framework, which can reduce information loss
in the neural network to acquire higher location
accuracy.
The relocation strategy and Coverage-IoU Loss
proposed in this paper can be easily ported to
other tasks, such as target detection, instance
segmentation, and so on.
2 METHOD
The target matching framework proposed in this
paper consists of three stages:
Enhanced Detector:
We first run an enhanced detector with Co-IoU
loss, this stage provides candidate bounding
VISAPP 2021 - 16th International Conference on Computer Vision Theory and Applications
254
box detections with location and confidence,
which will be verified by feature extracted from
the template in the next stage.
Verification Tests:
We next predict similarity between the
templates image and each proposed candidate
bounding box detection in the proposed
filtering strategy, which take Class similarity,
co-occurrence matrix and recall into
consideration.
Adjustment and Relocation:
Given the verified region of interests (ROI), we
adjust the regions and relocate to achieve high
locating precision.
The entire framework is shown in Figure 1.
2.1 Coverage-IoU Loss
Bounding box regressing is one of the key
components in target detection, which has a great
impact on the precision of locating objects. In target
matching task, the output used to be (x, y, w, h) or (x
1
,
y
1
, x
2
, y
2
) to represent the prediction boxes.
Intersection over Union (IOU) is the most popular
metric to compare the similarity between two
arbitrary boxes (Eq. 1).
gp
g
tp
tb
b
BB
IoU
BB
∩
=
∪
(1)
where 𝐵
and 𝐵
are the prediction positioning box
and the ground truth box respectively.
Also, IOU can be used as a criterion to measure
distances between bounding box predictions (Eq. 2).
IoU
=1-IoUL
(2)
The IoU based loss has the virtue of scale
invariance, non-negativity, symmetry and triangle
inequality and the identity of indiscernible target, but
still has many weaknesses like optimization
instability, box regression speed and so on. Thus, we
propose a novel loss function to figure out these
problems.
First of all, we use the distance between the two
corners (upper left corner and lower right corner) of
the prediction box and the target box to optimize the
loss function, which can be defined as (Eq. 3).
()()
2
cd
22
2
,,
+
44
p
lgl prgr
cc
ρρ
=
bb bb
L
(3)
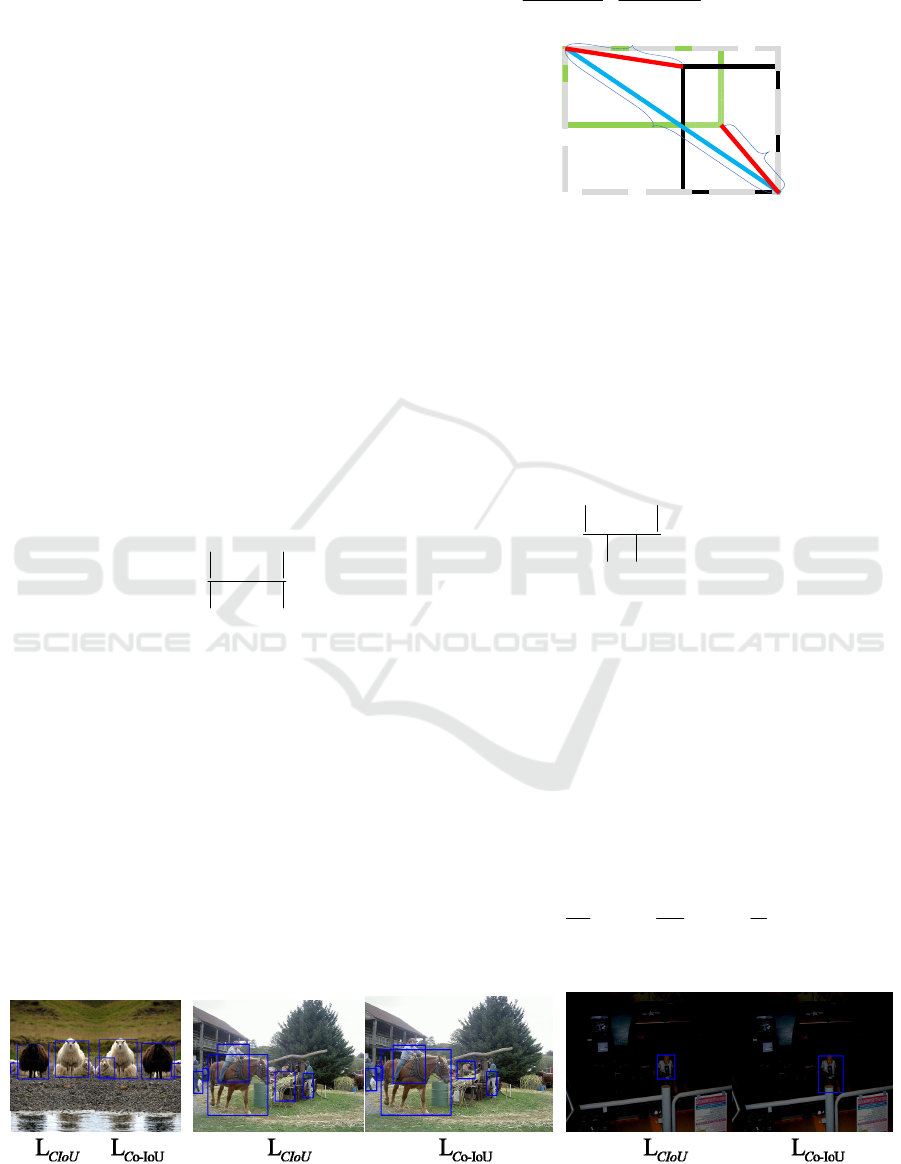
Figure 2: Schematic diagram of corner distance, in which
the green rectangle is the real box, the black rectangle is the
prediction box, d
1
and d
2
are the distance between the
prediction box and the real box, c is the diagonal distance.
Where bpr and bpl denote right bottom corner and left
top corner of B, while bgr and bgl denote right bottom
corner and left top corner of
B
. As shown in Figure
2, ρ (·) is the Euclidean distance, and c is the diagonal
length of the smallest enclosing box covering the two
boxes.
Moreover, coverage and intersection over union
are added in the measurement (E
q.4 and Eq.5).
pb
g
t
gt
BB
Co
B
∩
=
(4)
*(1)*
Co
I
OU Co
αα
=+−L
(5)
Where α is a positive trade-off parameter, which
determines the weight of intersection over union and
coverage. Generally, the higher the requirement of
coverage is, the lower the value should be set. When
the value is 1, the coverage ratio is not considered. In
this paper, the default choice is 0.8 through
experiments.
Finally, a strict shape restriction is finally added
to punish the mismatch of shape, which makes the
method obtain more precise positioning results with
fewer iterations, and it can be met by implementing v
as (Eq. 6)
.
2
2
4
arctan arctan
gt
gt
ww
v
hh
π
=−
(6)
Where v measures the consistency of shape.
Figure 3: Comparison examples between the CIoU loss and Ours, the blue rectangle box is the detection result.
C
d
1
d2
Relocation with Coverage and Intersection over Union Loss for Target Matching
255

Thus, the final Coverage-IoU loss function is
formed (Eq. 7).
-cd
1
Co IoU Co
v=−∗ +LLL
(7)
The Comparison examples between the CIoU loss
and Ours are shown in Figur3. An enhanced target
detector with this loss function is used to extract
features, which are combined with the features
extracted from the template into the next verification
and filtering step to select the ROI.
2.2 Verification Tests
Since the regions predicted by the basic detector
included non-target object regions, it means that the
false positive ratio is relatively high and the results
are not reliable. Therefore, we present verification
tests to find the region of interest rather than time-
consuming post-processing like matching key-points
of each candidate with target. In order to properly
filter the regions of interest, the verification criteria
include two components: class similarity evaluation
and target similarity evaluation.
Class similarity evaluation calculates the
probability that two regions belong to the same
category.
𝑓
and 𝑓
are the features extracted from the
template image and candidate regions in search-
image respectively.
𝑓
and 𝑓
can be measured as
feature vectors using similarity formulas such as
cosine similarity (as Eq. 8, Eq.9 below) to directly
calculate the class similarity. Where μ and λ are
normalization factors, and the similarity can be
normalized into [0,1] intervals though taking 0.5 and
0.5 respectively.
r
r
·
cos
||||
t
t
f
f
f
f
θ
=
×
(8)
r
·
(| )
||||
t
tr
ff
Sim t r
ff
λ
μ
=+
×
(9)
Furthermore, Target similarity evaluation
calculates the probability of the target object in the
same category, which is consists of 3 parts: co-
occurrence pixel matrix, anti-background
interference metric and shape recall.
The co-occurrence pixel matrix takes colour, a
certain distortion rigidity, mapping precision into
account (as shown in Eq.12 below), which is
calculated between the template image and candidate
regions
.
2
2
,
(,)
(,) exp
2
pq
pq
dpq
Cab I a I b
Z
σ
ρ
−
===
(10)
Where I
p and Iq are pixel values in a and b, Z is the
normalization factor and P is the edge pixel weight
reduction factor, which will be applied when the edge
area of the candidate area appears more frequently.
Anti-background interference reduces the impact
of surrounding pixels that occur frequently in
multiple areas (as Eq.10 and Eq.11 below), especially
the pixels near the edge. Where
𝜉 is the normalization
factor,
𝑝 is the pixel location, ℎ
(
𝑝
)
represents the
occurrence weight of pixel
𝑝 , the higher the
frequency of occurrence, the lower the weight.
(,)
(,)
()()
Cab
Mab
hahb
=
(11)
()
(), ()
idx idxridxidx
p
R
ISMTpRp
ξ
∀⊆=
(12)
Shape recall mainly measures the shape recall of
the detection boxes and the template. The greater the
difference, the lower the score (Eq. 12).
1
t
t
w
max( , )
s
recall
st
tss
hwh
wh wh
T
−
=
(13)
In all, the whole verification criterion is calculated
by the following (Eq.13) and the candidate region
with the highest score in the regions of target. If all
candidate area scores are smaller than the threshold,
no matching area will be outputted.
(| ) (| )
recallr
Conf t r Sim t r S T=∧∧
(14)
2.3 Region Expansion and Relocation
In the end-to-end deep learning detection method, due
to the quantification error caused by pooling
operations in the CNN structure, the final location
results are always not accurate enough.
Algorithm 1: ROIs Verification and Target Relocation.
Input:
𝑅
,𝑖∈
1, 𝑛
𝑎𝑟𝑒 the set of Predictions from
the enhanced base detector, 𝑛 is the number of Predictions
(ROIs), 𝑇 is the target template.
Output: Target Region 𝑅
1: Do Region of Interests verification:
2: T ’ ← Feature Extracter( 𝑇)
3: 𝑅
i
’
← Feature Extracter ( 𝑅
i
)
4: Compute 𝐶𝑜𝑛𝑓
(
𝑇’|𝑅
’
)
=𝑆𝑖𝑚
(
𝑇 ’
|
𝑅
’
)
∧𝑆
∧
𝑇
%Eq.14
5: 𝑅
← Softmax ( 𝐶𝑜𝑛𝑓
(
𝑇 ’|𝑅
’
)
)
6: Do Target Relocation:
7: 𝑅
← Region expansion( 𝑅
)
8: 𝑅
← Redetection ( 𝑅
)
9: 𝑅
← max (Confidence ( 𝑅
, 𝑅
))
10: Return 𝑅
VISAPP 2021 - 16th International Conference on Computer Vision Theory and Applications
256
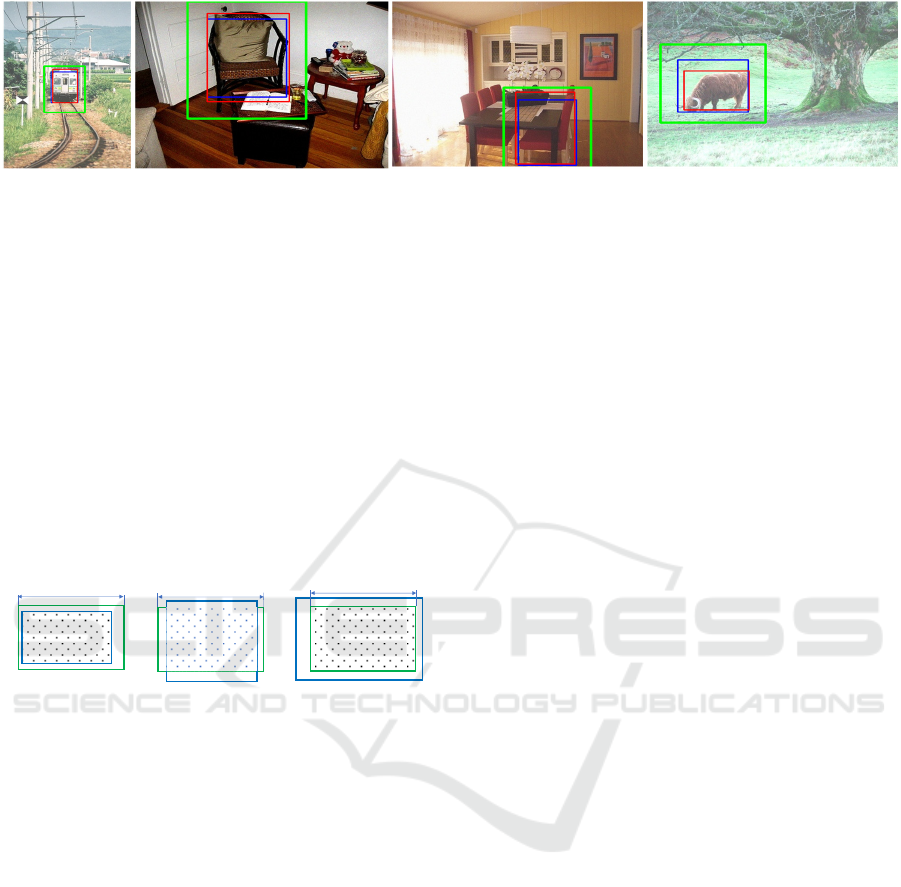
Figure 4: Examples of relocation, in which the blue box as the initial locating region, the green box represents the region of
interest, and the red box is the output after relocation.
The Process of adjustment of regions of interests
(ROIs) and relocation in this paper are proposed to
solve this problem, as shown in algorithm 1. the
detector based on Coverage-IoU loss is designed to
be used as a guide for target matching to output ROIs,
and the region of interest will be selected after
verification and filtration. Then expanding the
selected region of interest and finally relocation in
this region to achieve high location accuracy. Due to
the scale of regions of target is relatively reduced to
the scale of target in relocation process, the
consuming time of whole process is close to the single
detector.
Figure 5: Comparison between IoU and Coverage-IoU loss.
The green box is the ground truth, the blue detection box is
the prediction box, and the dot region is the detected region
of the target object.
In Coverage-IoU loss function, we add a coverage
item to optimize the loss, which makes the objects in
the prediction box be included in ROIs as much as
possible (close to the middle), which benefits the
regional expansion in this step.
As we can see from Fig.5, when the loss function
is optimized, the IOU criterion can no longer be
optimized when the IOU score can no longer be
optimized (like A, B and C with same IoU), while
Coverage loss proposed in this paper can still
continue to be optimized. For many practical
scenarios, matching and positioning tasks tend to be
cover the target object in the prediction box as much
as possible. And as shown in Figure 4, the target is
more likely to be completely included and precisely
located in output after relocation.
3
EXPERIMENTS
In this part, we test the performance of one of the most
popular one-stage detectors (YOLOv3) based on our
proposed Coverage-IoU (Joseph Redmon, 2013-
2016) on Pascal VOC, which is one of the
most commonly used object detection datasets. Then
we take advantage of OTB template matching dataset
format to build our own dataset (4 times larger than
standard OTB and takes illumination, noise and angle
shift into consideration) to compare the performance
of our framework with other advanced methods like
NCC, QATM and so on. All evaluations are based on
an Intel(R) I7 7800X CPU and a GeForce GTX
2080Ti GPU.
3.1 Coverage-IoU Performance
In this experiment, we compare a single-stage
detector (YOLOv3) based on Coverage-IoU loss with
the detector based on other bounding box regression
strategies in PASCAL VOC Dataset.
To test the improvement of the basic detector
based on Coverage-IoU, we used VOC 07+12 (a
combination of VOC 2007 training validation set and
VOC 2012 training validation set) as the training set,
which contained 16551 images from 20 classes. The
test set is VOC 2007 and consists of 4952 images. We
used the Darknet training tool for training, with the
maximum number of iterations set to 100K. The
results of each loss function are shown in Table 1
below. Average Precision (AP) is a common criterion
to measure the performance of the algorithm with the
change of threshold value. We used the same
measure of performance AP (the average of 10 mean
Average Precision across different IoU thresholds) =
(AP50 + AP55 + … + AP95) / 10), AP75 (AP75,
mAP@0.75) and AP90 (mAP@0.90).
This article uses the framework of darknet416.
As we can see from the Table.1, compared to
ℒ
, the performance of ℒ
is 7.72 points higher
on AP, 18.28 points higher on AP75, and more than 4
IO U = 0 .71
IR = 0 .71
Uni = 0.71
AB
IOU =0.71
IR = 0 .83
Uni = 0.73
IOU =0.71
IR = 1 .00
Uni = 0.77
C
L
L
H
H
L
H
Relocation with Coverage and Intersection over Union Loss for Target Matching
257
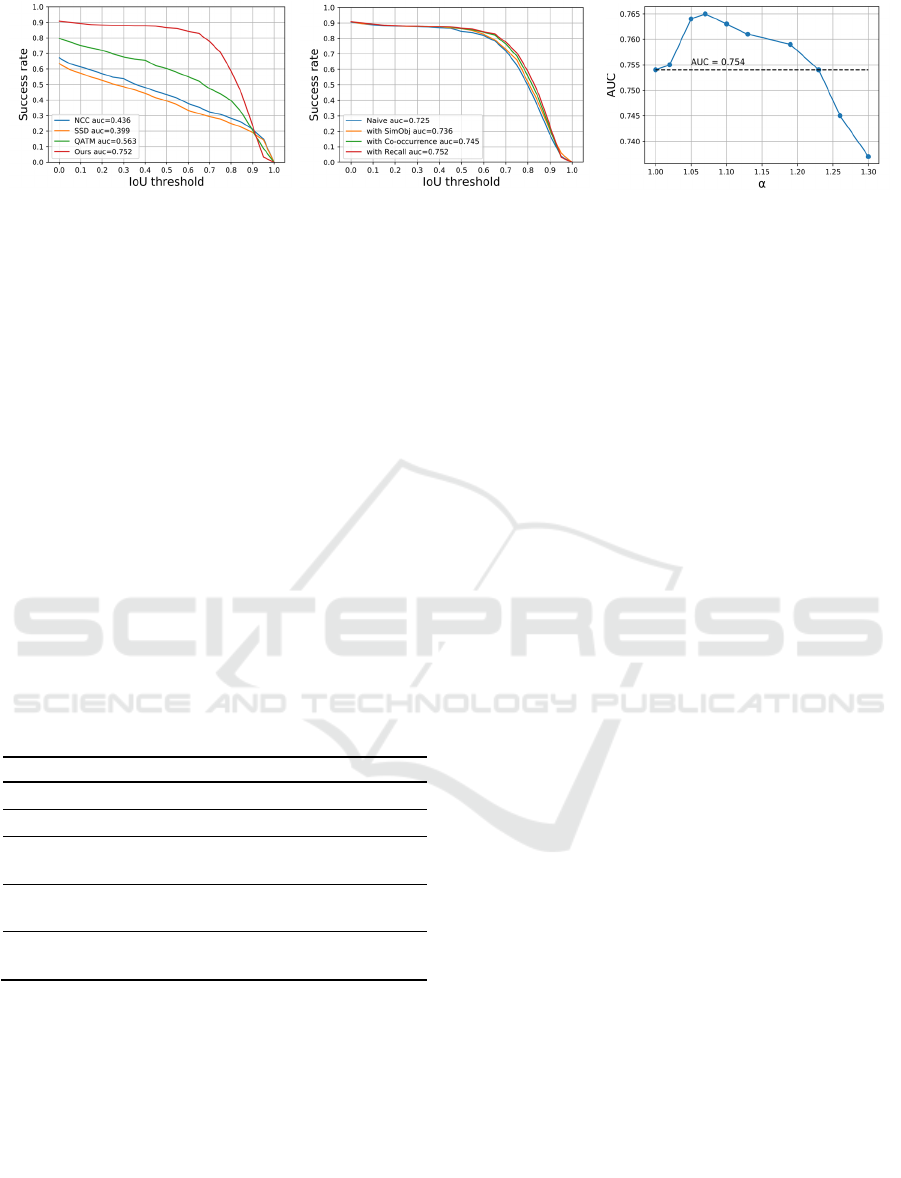
Figure 6: Performance of different Methods in AUC in MOTB. (a) Comparison among different matching and locating
methods, (b) Performance of different IoU loss, (c) the influence of α on the performance of relocation.
times higher on AP90, which shows the superiority of
the IoU. The loss proposed in this paper is an
improvement on top of IoU. Therefore, using this
method as a benchmark, we can measure the
improvement of this method.
Compared with the most advanced methods, we
can find in table 1 that Coverage-IoU shows a 6.96%
improvement on AP, 10.20% improvement on AP75
and doubles on AP90 compared to ℒ
respectively.
And it can be summarized that Coverage-IoU based
detector gradually increases in proportion to other
IoU based detectors (AP90 > AP75>AP) as the
threshold increases, which indicates that Coverage-
IoU is more suitable for the scenarios require for high
locating precision.
Table 1: Quantitative comparison of YOLOv3 (Redmon
and Farhadi 2018) trained using ℒ
(baseline), ℒ
,
ℒ
(ℒ
) and ℒ
, the results are reported on the
test set of PASCAL VOC 2007.
Loss/Evaluation AP AP75 AP90
MSE
L
36.33
31.05
0.90
IoU
L
44.05
49.33
3.8
GIoU
L
improv. %
46.67
5.95%
53.91
9.28%
7.54
98.42%
o-IoUC
L
improv. %
46.51
5.58%
53.87
9.20%
7.33
92.89%
-Co IoU
L
improv. %
47.12
6.96%
54.36
10.20%
8.23
116.59%
From Figure 6(b) we can clearly see the
performance of methods based on ℒ
(baseline), ℒ
, ℒ
(ℒ
) and ℒ
(Ours)
in matching and localization task on the MOTB
dataset (more details about MOTB dataset will be
introduced in section 4.2), among which ℒ
that
we proposed shows 1.3%, 2.8% and 4.7%
improvement in AUC compared to ℒ
(baseline),
ℒ
, ℒ
( ℒ
) respectively, and with
increasing IoU threshold, the performance of our
method is consistently better than others.
3.2 Performance on MOTB Dataset
In the previous template matching paper (such as
QATM, COTM), OTB dataset is one of the most
commonly used datasets. It has 105 template- image
pairs and about 31 scenarios for matching tests.
However, the problem with OTB dataset is that the
scale does not change much and the interference such
as illumination, angle variation and noise is very
little.
Moreover, unlike template matching tasks only
focus on the shallow similarity of images patches, the
templates in target matching tasks usually include
specific objects, which means the internal semantics
of images is also significant. So the general template
datasets is not suitable for our experiments in target
matching, and we set up a new dataset which has 393
image pairs in different scenarios in OTB data format,
which is about four times larger than the original OTB
dataset and take the variation of illumination, noise,
and view angle in the actual application scenario into
Consideration. Also, as a test set for target matching
and positioning task, each template in the dataset
include a specific target and the categories of target
collected in this dataset are as same as categories in
VOC Dataset to facilitate qualitative comparison of
target matching and positioning.
3.2.1 Verification and Relocation
In this section, we test the effects of verification and
relocation strategy on top of the detector based on
Coverage-IoU in MOTB dataset.
Verification. Area Under Curve (AUC) describes the
success rate of locating with the change of threshold
value, which is a common criterion to measure the
algorithm performance. As shown in Table 2, the
AUC performance is enhanced gradually with multi
verification processes. Naïve location represents the
results of enhanced detector based on Coverage-IoU.
(a) (b) (c)
VISAPP 2021 - 16th International Conference on Computer Vision Theory and Applications
258
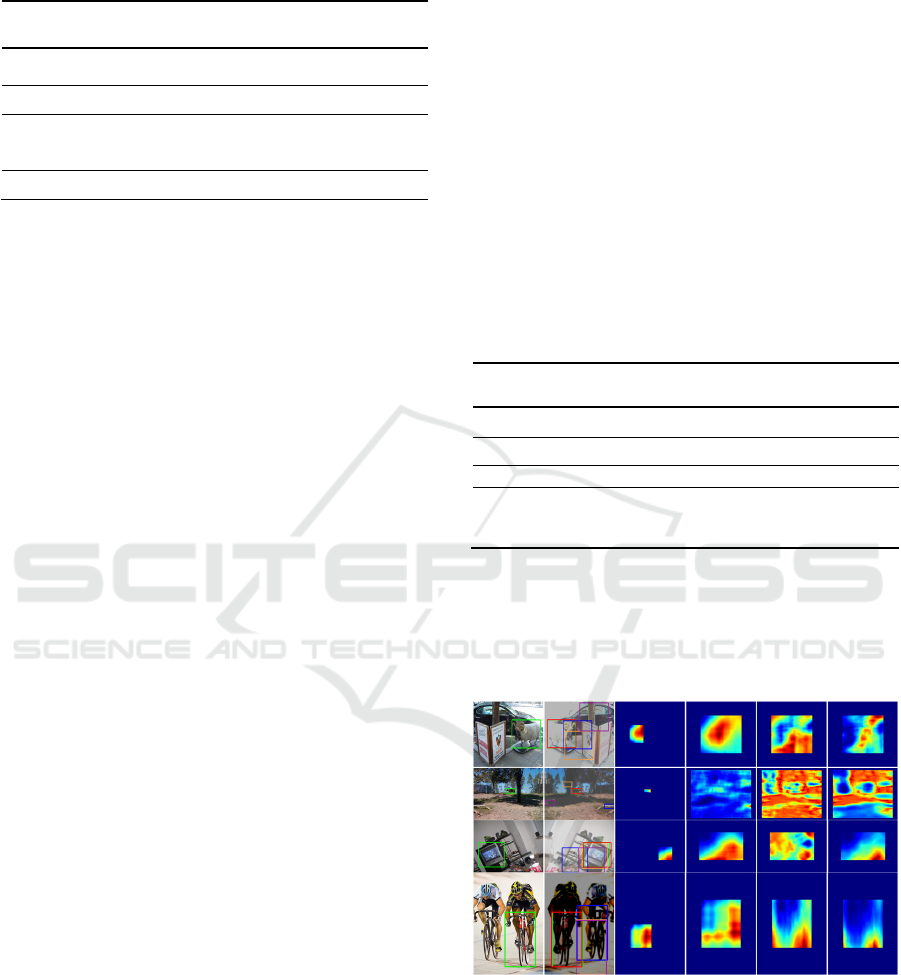
Table 2: Performance comparison among different
verification strategy.
Methods
/Verifications
Sim
Co-
occur
Recall AUC
Straight relocation
0.725
Feature Similarity
√
0.736
Co-occurrence
Verification
√ √
0.745
Union Verification
√ √ √
0.752
The straight location represents directly using of shape
recall to find the most matched region. Feature
Similarity represents using of class probability to
determine and filter regions of interests. Co-occurrence
Verification takes advantage of a co-occurrence matrix
considering colour, distortion, and background
interference to verify ROIs. And it is clear that the
union verification strategy includes all process above
achieve the highest AUC improvement.
Relocation. In this paper, we use a relocation strategy
to improve the location accuracy, which expands the
initial location region to a certain extent and redetect
again in this region of interest. Re-detection in the
adjusted region of interest can reduce the loss of
features by narrowing the ROI compared with
detecting in the whole image.
However, the size for region of interest will affect
our speed and precision to a great extent, so we have
to carefully choose a suitable region expansion factor
of relocation strategy (α). We have done a series of
experiments on α, we set alpha varies within [1,1.3]
to explore the impact of expansion factor on the
performance of matching and positioning. Also, α can
be selected by training the neural network, which will
be our future work.
As we can see from the Figure 6(c) above, it is
clear that the accuracy of location is improved with
the enlargement of the region and reaches a peak at
alpha is 1.07, but with the rising value of alpha, the
AUC performance becomes worse due to increasing
of false detection caused by fewer training pictures at
these scales. To figure out this problem, we use a
fusion strategy to avoid decreasing performance
caused by a lack of training scale in relocation: only
when the confidence of results after the relocation
become higher, the predictions will be output.
3.2.2 Comparison with Other Methods
In this experiment, theαis set to 1.1 and the entire
proposed target matching framework is evaluated on
the MOTB dataset. Our method as well as all baseline
method performance are shown in Table.3. It is clear
that the method we proposed outperforms all popular
methods and leads the second-best (QATM) by
roughly 21% in terms of AUC score.
Also, it can be seen from Figure 6(a) that when the
threshold increases from 0.5 to 0.9, the IoU is all
significantly higher than the previous methods,
especially when the threshold value is 0.9, there is
most obvious improvement in AUC, which indicates
that this method can better locate the target in high
precision.
Table 3: The quantitative comparison of the localization
effect of different matching methods was used. The results
were tested on the MOTB data set, and the IOU
performances at the thresholds of 0.5, 0.75 and 0.9 were
measured respectively.
Method
/Evaluation
IoU
@50
IoU
@75
IoU
@90
AUC
SSD 44.56 28.43 18.14 30.18
NCC 50.02 35.37 19.91 35.16
QATM 80.00 61.03 39.87 60.30
Our
improv. %
96.34
20.43
68.01
11.44
52.26
31.08
76.25
21.31
3.3 Qualitative Evaluations
In this section, we demonstrate the matching
performance and matching speed of proposed method
through qualitative comparisons.
Template Search Our QATM NCC SSD
Figure 7: Qualitative matching performance comparisons.
Figure 7 provides more qualitative comparisons
between our method and other matching and locating
methods. These results further demonstrate the
superiority of our method, which makes full use of the
semantic information of the template itself to eliminate
interference from other objects with shallow similar
features in the background. Also, the verification
Relocation with Coverage and Intersection over Union Loss for Target Matching
259

strategy narrows the target area, while the relocation
strategy is used to provide more accurate locations by
reducing the loss of information in the neural network.
As the example in the last line of Figure 7, the method
proposed in this paper excludes interference from
objects in same categories with similar appearance,
while other methods are more susceptible to shallow
features and more likely to find false target then. Or, as
examples in the second and second-to-last figures, the
other methods work not as well as ours when
illumination is stronger or weaker than usual. And in
the first line of the Figure 7 we can find that even there
is only one salient target in the image (simple
background and low interference), our method can also
achieve a higher location accuracy than others.
Table 4: Speed test on MOTB datasets, where NCC and
SSD methods can only use CPU, while QATM and the
method in this paper can use GPU to accelerate the
positioning effect.
Methods SSD NCC QATM Ours
Backend CPU GPU
Average(ms) 296 321 1780 90
Finally, the matching speed is also an important
criterion to measure the performance of the algorithm
for practical application. Table.3 compares the
average time consumed by different matching and
locating methods on MOTB datasets, it is clear that
the methods proposed in this paper has obvious
advantages over traditional sliding window methods
and QATM with GPU acceleration.
4 CONCLUSIONS
We introduced a novel target matching framework,
which mainly includes Coverage- IoU based feature
extractor, verification process and relocation after
expanding region of interests. The idea of Coverage-
IoU loss in this framework comes from that the
existing IoU-loss cannot meet the coverage
requirement in some scenes. The coverage, shape
restriction and corner distance loss function can better
describe the regression process of the bounding box
and acquire more accurate position regression.
Moreover, the verification strategy present here is to
reduce false-positive results without the instance-
level template, so as to guide the regions of interest to
the target area. Finally, the inspiration of relocation
strategy comes from the location errors caused by the
information loss caused by pooling and other
operations in the neural network, while narrowing
input size and relocating in this area can reduce the
position errors to achieve better performance in
location accuracy. Also, the relocation strategy and
Coverage-IoU Loss proposed in this paper can be
easily ported to other common tasks like target
detection, instance segmentation and so on.
REFERENCES
James, Alex Pappachen, and Belur V Dasarathy. (2014).
Medical Image Fusion: {A} Survey of the State of the
Art. CoRR abs/1401.0.
Hashemi, Nazanin Sadat, Roya Babaie Aghdam, Atieh
Sadat Bayat Ghiasi, and Parastoo Fatemi. (2016).
Template Matching Advances and Applications in
Image Analysis. arXiv preprint arXiv:1610.07231.
Nan, Junyu, and David Held. (2019). Combining Deep
Learning and Verification for Precise Object Instance
Detection, no. CoRL: 1–20.
Perveen, Nazil, Darshan Kumar, and Ishan Bhardwaj.
(2013). An Overview on Template Matching
Methodologies and Its Applicatons 2 (10): 988–995.
Dekel, Tali, Shaul Oron, Michael Rubinstein, Shai Avidan,
and William T. Freeman. (2015). Best-Buddies Simil-
arity for Robust Template Matching. Proceedings of the
IEEE Computer Society Conference on Computer Vision
and Pattern Recognition 07-12-June. IEEE: 2021–2029.
Kat, Rotal, and Shai Avidan. (2018). Matching Pixels Using
Co-Occurrence Statistics. Proceedings of the IEEE
Computer Society Conference on Computer Vision and
Pattern Recognition, 1751–1759.
Cheng, Jiaxin, Yue Wu, and Premkumar Natarajan.
(2019)QATM: Quality-Aware Template Matching for
Deep Learning. Proceedings of the IEEE Computer
Society Conference on Computer Vision and Pattern
Recognition 2019-June: 11545–11554.
Ren, Shaoqing and Kaiming He. (2017). Faster R-CNN:
Towards Real-Time Object Detection with Region
Proposal Networks. IEEE Transactions on Pattern
Analysis and Machine Intelligence 39 (6): 1137–1149.
Ammirato, Phil, Cheng-Yang Fu, Mykhailo Shvets, Jana
Kosecka, and Alexander C. Berg. (2018). Target Driven
Instance Detection. arXiv preprint arXiv:1803.04610,
2018.
Girshick, Ross. (2015). Fast R-CNN. Proceedings of the
IEEE International Conference on Computer Vision
2015Inter: 1440–1448.
Rezatofighi, Hamid, Nathan Tsoi, JunYoung Gwak, Amir
Sadeghian, Ian Reid, and Silvio Savarese. (2019).
Generalized Intersection over Union: A Metric and A
Loss for Bounding Box Regression. Proceedings of the
IEEE Conference on Computer Vision and Pattern
Recognition. 2019: 658-666.
Joseph Redmon. (2013–2016). Darknet: Open Source
Neural Networks in C. http://pjreddie.com/darknet/,
[Access 23-August-2020].
VISAPP 2021 - 16th International Conference on Computer Vision Theory and Applications
260
