
GeST: A New Image Segmentation Technique based on Graph
Embedding
Anthony Perez
Univ. Orl
´
eans, INSA Centre Val de Loire, LIFO EA 4022, FR-45067 Orl
´
eans, France
Keywords:
Image Segmentation, Superpixels, Graph Embeddings, Complex Networks.
Abstract:
We propose a new framework to develop image segmentation algorithms using graph embedding, a well-
studied tool from complex network analysis. So-called embeddings are low-dimensional representations of
nodes of the graph that encompass several structural properties such as neighborhoods and community struc-
ture. The main idea of our framework is to first consider an image as a set of superpixels, and then compute
embeddings for the corresponding undirected weighted Region Adjacency Graph. The resulting segmentation
is then obtained by clustering embeddings. To the best of our knowledge, known complex network-based
segmentation techniques rely on community detection algorithms. By introducing graph embedding for image
segmentation, we combine two nice properties of aforementioned segmentation techniques, namely working
on small graphs with low-dimensional representations. To illustrate the relevance of our approach, we propose
GeST, an implementation of this framework using node2vec and agglomerative clustering. We experiment our
algorithm on a publicly available dataset and show that it produces qualitative results compared to state-of-
the-art segmentation techniques while requiring low computational complexity and memory.
1 INTRODUCTION
The aim of image segmentation is to partition an im-
age into separate regions of interest, which ideally
correspond to real-world objects. This constitutes a
fundamental process in many image and computer vi-
sion applications. There have been many methods de-
veloped for image segmentation over the years, with
three main categories emerging: pixel-based, region-
based and boundary-based methods. In pixel-based
methods, pixels with similar features are grouped to-
gether without considering spatial relationship, while
region-based methods define objects as regions of
pixels with homogeneous characteristics. Many ap-
proaches exist in all three categories, including for
instance intra-region uniformity metrics, inter-region
dissimilarity metrics and shape measures. One of
the main differences between intra- and inter-region
techniques is that the former may result in discon-
tiguous objects. We refer the reader to the survey
of Zhang et al. (Zhang et al., 2008) for more infor-
mation on unsupervised image segmentation. Graph-
based segmentation techniques have also been pro-
posed. For instance, the Felzenszwalb and Hut-
tenlocher method (Felzenszwalb and Huttenlocher,
2004) relies on the computation of minimum span-
ning trees for grid-like graphs. More recently, many
approaches have been developed using community
detection algorithms, a well-studied tool from com-
plex network analysis. Since our work also relies on
complex network analysis tools, we give more insight
on such techniques.
Related Work. Community detection algorithms
have been used to produce state-of-the-art segmenta-
tion techniques (Browet et al., 2011; Li and Wu, 2014;
Mourchid et al., 2016; Nguyen et al., 2019). Both
pixel and region-based approaches have been pro-
posed. In the former case, an undirected (un)weighted
graph is derived from pixels of the image at hand, and
community detection algorithms are then applied to
obtain the segmented image. Regarding region-based
methods, an undirected (un)weighted graph (so-called
Region Adjacency Graph) is first obtained from an
initial set of regions, called superpixels (Achanta
et al., 2012). Then, a community detection algo-
rithm is applied to obtain the sought segmentation
(see e.g. (Li and Wu, 2014)). Both superpixels and
community detection-based segmentation techniques
are known to have an over-segmentation effect. To
circumvent this issue, Nguyen et al. (Nguyen et al.,
2019) additionally use a merging procedure to ag-
Perez, A.
GeST: A New Image Segmentation Technique based on Graph Embedding.
DOI: 10.5220/0010191502450252
In Proceedings of the 16th International Joint Conference on Computer Vision, Imaging and Computer Graphics Theory and Applications (VISIGRAPP 2021) - Volume 4: VISAPP, pages
245-252
ISBN: 978-989-758-488-6
Copyright
c
2021 by SCITEPRESS – Science and Technology Publications, Lda. All rights reserved
245
glomerate similar regions as computed by communi-
ties. Such an idea has already been used by Tr
´
emeau
and Colantoni (Tr
´
emeau and Colantoni, 2000) in a
similar context. One may also use additional im-
age features (such as colors and textures) to compute
the segmentation (Li and Wu, 2014; Nguyen et al.,
2019). Notice that since communities correspond to
connected subgraphs, segmentations computed with
such methods consist of contiguous regions.
Our Contribution. We propose a new approach
using a recent complex network analysis technique,
namely graph embedding. The aim of graph embed-
ding is to compute low-dimensional representations
of nodes of a graph that encompass structural prop-
erties such as neighborhoods and community struc-
ture (Grover and Leskovec, 2016; Cai et al., 2018).
A particular feature of graph embedding is that two
nodes of the network may have similar representa-
tions while not being connected. Based on this tech-
nique, we propose a general framework for image seg-
mentation: starting from a set of superpixels, we next
compute embeddings of the Region Adjacency Graph
(RAG) and then use a clustering algorithm to obtain
a set of regions. A merging procedure may finally be
applied to obtain the sought segmentation. Note that
methods using community detection algorithms either
work on a large graph (Nguyen et al., 2019) or on a
small set of superpixels represented by a large num-
ber of features (Mourchid et al., 2016). We hence
propose a combination of both ideas, that is a low-
dimensional representation of a small set of superpix-
els to produce segmentations using any clustering al-
gorithm. We develop a python implementation
1
of
such a framework, namely GeST (Graph embedding
Segmentation Technique). Since our aim is to high-
light the relevance of graph embedding for image seg-
mentation, we use very few image features. While our
approach is region-based, the computed regions may
be discontiguous due to the very nature of graph em-
bedding. A set of contiguous regions can however
be easily derived from our results. Using a publicly
available dataset, we emphasize that GeST achieves
state-of-the-art results while requiring low computa-
tional complexity and memory.
Outline. We first give a high-level description of
our framework, introducing definitions and nota-
tions for superpixels and graph embedding algorithms
(Section 2). We also provide details about the python
implementation of such a framework. We next turn
our attention to the experimental setup by describing
1
https://github.com/anthonimes/GeST
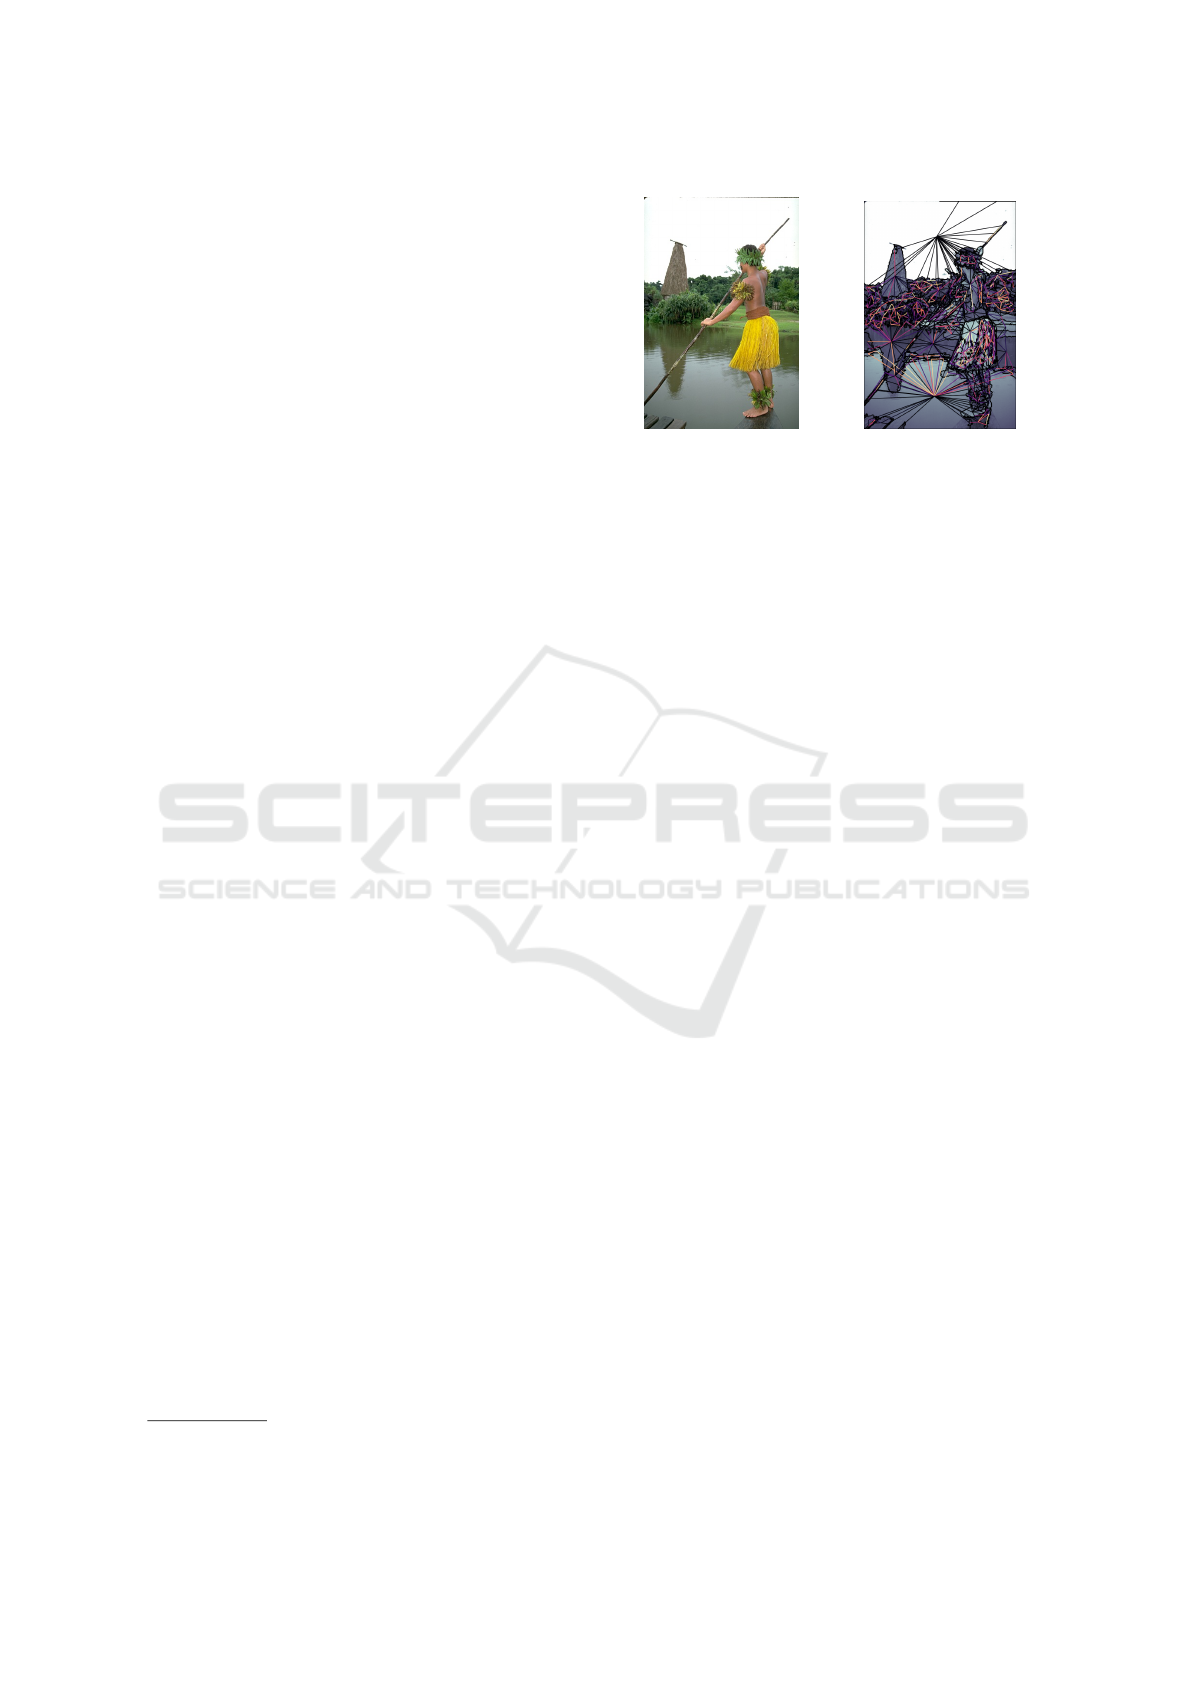
Figure 1: An image together with its associated RAG.
the dataset used as well as state-of-the art methods
we compare to (Section 3). We then give qualitative
and quantitave evaluations of our method (Section 4)
and conclude with future research perspectives (Sec-
tion 5).
2 DESCRIPTION OF THE
APPROACH
Superpixels and Graph Representation. There
are several ways to represent a given image as a graph.
In a first place, one may consider each pixel of the
image as a node of the representing graph, and con-
nect pixels according to some distance function (e.g.
feature colors or Manhattan’s distance within the im-
age). This is the approach followed by Nguyen et
al. (Nguyen et al., 2019) who then apply a commu-
nity detection algorithm to obtain a first segmentation
of the image. While their construction uses a similar-
ity threshold to determine connections between pix-
els, this is not reflected on the resulting unweighted
graph. When considering large images, this approach
may lead to graphs with a high number of vertices
and edges and thus not be scalable. As a workaround,
many works (Li and Wu, 2014; Linares et al., 2017;
Tr
´
emeau and Colantoni, 2000) consider superpixels,
that assign a region to each pixel of the original image.
This results in a partition of the pixels set, that is con-
sidered as an initial segmentation. One can then easily
associate a Region Adjacency Graph (RAG) to such a
segmentation by taking one node per region and by
connecting regions whose pixels share some bound-
aries. Image segmentation techniques using this ap-
proach usually require high-dimensional representa-
tions of the obtained regions to compute the final seg-
mentation. In this work, we propose to exploit nice
properties of both approaches by considering RAGs
with low-dimensional yet relevant vector representa-
tions. We thus consider the superpixels framework,
and represent images as undirected weighted graphs
VISAPP 2021 - 16th International Conference on Computer Vision Theory and Applications
246

G = (V, E, ω), where V is the set of regions computed
by the superpixels algorithm, E ⊆ V ×V denotes the
set of adjacent regions and ω : E → R is any similar-
ity measure. As observed in previous works (Li and
Wu, 2014), the L*a*b* space is the closest to the hu-
man perception and is hence the one chosen for our
implementation. We thus use such a color space to
define the weight function ω. For every region R we
consider the mean of each color channel C, that is:
Mean(R) =
1
|R|
·
|R|
∑
i=1
C
i
(1)
As a result, every region is represented by a 3-
dimensional color feature vector. We then weight
any edge e
i
e
j
∈ E according to the Euclidean dis-
tance d(R
i
, R
j
) between vectors of the corresponding
regions R
i
and R
j
. In order to obtain a similarity mea-
sure and thus properly define the weight function ω,
we use a Gaussian type radius basis function:
ω(R
i
, R
j
) = exp
−d(R
i
, R
j
)
2 · σ
2
(2)
Graph Embedding. The aim of graph embedding
is to represent nodes of a given graph using low-
dimensional vectors (embeddings) that capture struc-
tural properties of the network at hand (e.g. neighbor-
hoods and community structure). Formally:
Definition 1. Let G = (V, E, ω) be a graph. A graph
embedding in dimension d is a function φ : V → R
d
mapping every node of G to a d-dimensional vector.
Different frameworks have been developed (see
for instance (Cai et al., 2018) for a recent survey). As
mentioned earlier, one may either consider a weighted
or an unweighted graph when representing images.
Our experiments showed that using embeddings with-
out considering weights provide less relevant results.
While most graph embedding techniques are designed
to cope with unweighted networks, the state-of-the-art
node2vec framework (Grover and Leskovec, 2016) is
implemented to deal with weights. More details about
this framework are provided at the end of this section.
Clustering. Once the embeddings have been com-
puted, a clustering algorithm is applied to obtain the
final image segmentation, either on the embeddings
only or with additional image features. The pseudo-
code of our approach is given Algorithm 1.
Merging Similar Regions on Selected Images.
Following ideas proposed in community detection ap-
proaches (Li and Wu, 2014; Nguyen et al., 2019;
Tr
´
emeau and Colantoni, 2000), our algorithm tries as
Algorithm 1: General framework.
Input : An image I in the L*a*b* space
Output: A segmentation S of I
1 P ← initial segmentation using superpixels;
2 G ← weighted RAG from P ;
3 emb ← embeddings computed from G plus
additional (optional) features;
4 S ← segmentation obtained from a clustering
algorithm applied on emb;
5 return S or Merge (S);
a final step to merge small and similar regions (w.r.t.
image features). Whenever a region has a number of
pixels below some empirically fixed threshold, it is
merged with its most similar adjacent region. Like-
wise, adjacent regions sharing similar features are
merged together. Since color features may be very
different from an image to another, we did not manage
to find a universal threshold for similarity. To circum-
vent this issue, we follow ideas from Liu et al. (Liu
et al., 2011), who proposed a model to estimate image
segmentation difficulty. To that end, the authors sug-
gest to consider the F-measure of images with known
ground-truth segmentations. We thus use such a mea-
sure to select a set of about 20 images where Algo-
rithm 1 fails to properly segment. We then apply the
merging procedure (Algorithm 2) on this set of im-
ages only.
Algorithm 2: Merging procedure.
Input : A segmentation S, a pixel threshold
t p ∈ N, a similarity threshold ts ∈ R
Output: A segmentation S
0
merged from S
1 while a merging occurs do
2 G
S
← RAG from S;
3 for every edge R, R
0
of G
S
do
4 sim ← similarity between R and R
0
;
5 if sim > ts then
6 S ← merge regions R and R
0
;
7 for every node R of G
S
do
8 if |R| 6 t p then
9 R
0
← closest adjacent region of R;
10 S ← merge regions R and R
0
;
Implementation of Algorithm 1. To compute the
initial segmentation (Line 1), we use the Mean
Shift-based EDISON algorithm (Christoudias et al.,
2002)
2
. Experiments have shown that using the Mean
Shift algorithm to compute superpixels provide the
best results, even if its computational complexity is
2
https://github.com/fjean/pymeanshift
GeST: A New Image Segmentation Technique based on Graph Embedding
247

a bit higher than SLIC (Achanta et al., 2012). We
now give more details about the computation of em-
beddings (Line 3) using node2vec. The presenta-
tion follows that of Grover and Leskovec (Grover and
Leskovec, 2016). This framework is based on (bi-
ased) random walks, with parameters that allow to
simulate different behaviors with respect to the graph
at hand. More formally, given a source node u, a ran-
dom walk {c
0
, . . . , c
l−1
} of fixed length l is simulated.
Let c
0
= u. The remaining nodes of the sequence are
generated by the following distribution:
P(c
i
= x |c
i−1
= y) =
(
π
yx
Z
i f yx ∈ E
0 otherwise
where π
yx
is the unnormalized transition proba-
bility between nodes y and x, and Z is the normal-
izing constant (Grover and Leskovec, 2016). In order
to bias random walks, the node2vec framework in-
troduces two parameters, namely return parameter p
and in-out parameter q. Formally, a 2
nd
order random
walk with these two parameters guides the walk: as-
suming the state of the random walk is c
i−1
= x and
c
i
= y, the walk needs to decide its next step and thus
evaluates the transition probability π
yv
on edges yv.
The unnormalized transition probability π
yv
is set to
π
yv
= α
pq
(x, v) · ω(y, v) with:
α
pq
(x, v) =
1
p
i f d(x, v) = 0
1 i f d(x, v) = 1
1
q
i f d(x, v) = 2
where d(u, v) denotes the shortest distance be-
tween nodes u and v and ω(u, v) the weight of edge uv.
These two parameters can be adjusted to either sim-
ulate a Breadth-First Search or a Depth-First Search
exploration of the graph. Another way of describ-
ing these parameters is that if q > 1, then structural
equivalence between nodes will be prioritized. This
means that nodes that are far apart in the graph but
share similar structure will lie close in the embedding
space. On the other hand, q < 1 will emphasize graph
connectivity, related to community structure. See Fig-
ure 2 for an illustration of both cases. Finally, features
are learned using stochastic gradient descent (Recht
et al., 2011). We refer the reader to (Grover and
Leskovec, 2016) for a more accurate description of
the node2vec framework.
We tried several clustering algorithms (Line 4),
and found out that the impact of the algorithm used is
not really significant. However, the set of parameters
used within a given algorithm may have an impact on
the results. The most important parameter that needs
to be adjusted in all cases is the number of clusters k
Figure 2: Two possible outcomes for node2vec depending
on the set of parameters (Grover and Leskovec, 2016). The
above graph corresponds to p = 1 and q = 0.5, and thus
emphasizes community structure. The second graph corre-
sponds to p = 1 and q = 2 and emphasizes structural equiv-
alence.
to be computed. We will discuss such parameters Sec-
tion 3. We used Agglomerative Clustering (Ward Jr,
1963) with cosine distance and average linkage. Re-
garding image features, since our aim is to highlight
the relevance of graph embedding in image segmenta-
tion, we use only simple features as a way to measure
similarity between adjacent regions. In particular, we
consider only color features. Hence, in addition to
the mean color of each region R (Equation 1), we also
consider the standard deviation:
Std(R) =
s
1
|R|
×
n
∑
i=1
(C
i
− Mean(R))
2
(3)
As we shall discuss Section 5, considering a more
intricate similarity measure may provide better re-
sults.
3 EXPERIMENTAL SETUP
Dataset and Resources. We use the publicly avail-
able BSDS500 Berkeley dataset (Arbelaez et al., 2010)
which consists of a set of 100 images. For ev-
ery image, five to eight manually computed ground-
truth segmentations are available. All algorithms are
written using open-source python libraries, such as
skimage (Van der Walt et al., 2014), numpy (Oliphant,
2006) and sklearn (Pedregosa et al., 2011) for main
image, RAG and metrics processing. All experiments
were conducted on a Dell Latitude 5490 with 16 Gb
VISAPP 2021 - 16th International Conference on Computer Vision Theory and Applications
248

of RAM and a 8xIntel Core i5-8350U 1.70Ghz. The
segmentation process takes a few seconds per image,
and really low memory (less than 2%). Notice more-
over that we did not make any optimization to the
code, and a more thorough analysis is considered as
extension of this work. We now describe most param-
eters used in our experiments.
Parameters. We first give parameters for the ini-
tial superpixels segmentation, namely spatial radius
h
s
, range radius h
r
and minimum size of computed re-
gions M. We followed parameters described by Chris-
toudias et al. (Christoudias et al., 2002) and obtained
the best performances and results using (h
s
= 7, h
r
=
4.5, M = 50). To compute the RAG of such a segmen-
tation, we empirically set σ ≈ 7.9, and d(·, ·) is chosen
to be the Euclidean distance between the mean color
vectors of the corresponding regions (Equation (2)).
Regarding the node2vec framework, we focused on
preserving community structure and hence set p = 2
and q = 0.5. Embeddings are in dimension 16, the
number of walks per node is 20 and the walk length
is set to 20. Finally, before applying Agglomera-
tive Clustering (Ward Jr, 1963), we add as features
to the embeddings the mean and standard deviation
of every region (Equations (1) and (3)), resulting in
a 22-dimensional feature vector. We present results
obtained with an empirically determined number of
clusters of k = 21, that provides relevant segmenta-
tions for the Berkeley dataset. Note that the mean
value of the number of regions of ground-truth seg-
mentations is around 20. To allow for an automatic
selection of k, we also present results obtained using
the mean of three known quality scores for cluster-
ing: silhouette criterion (Rousseeuw, 1987), Cali
´
nski-
Harabasz (Cali
´
nski and Harabasz, 1974) and Davies-
Bouldin scores (Davies and Bouldin, 1979), with k
ranging from 2 to 24. High values of the first two
scores and low value of the last one mean good clus-
terings. As one can see Table 1, the difference ob-
tained between both values of k does not significantly
alter the results. Hence, in order to provide a method
as general as possible, we use the aforementioned cri-
teria to automatically estimate the number of regions
to compute. We now turn our attention to the merg-
ing procedure (Algorithm 2). To define similarity be-
tween regions, we use the same setting than Nguyen
et al. (Nguyen et al., 2019) and compute the cosine
similarity of features described Equations (1) and (3).
Given two d-dimensional vectors u and v, the cosine
similarity is defined as:
cosine(u, v) =
u · v
kuk · kvk
(4)
Evaluation Metrics. Since the considered dataset
comes with several ground-truth segmentations (from
5 to 8), we use the Probabilistic Rand Index (PRI) to
measure the quality of our algorithm. This measure
has been introduced by Unnikrishnan and Hebert (Un-
nikrishnan and Hebert, 2005) and is used when
multiple ground-truth segmentations are provided.
Roughly speaking, PRI corresponds to the mean of
the Rand Index over all ground-truth segmentations.
More formally, the aim is to compare a test segmen-
tation through soft nonuniform weighting of pixel
pairs as a function of the variability in the ground-
truth set (Unnikrishnan and Hebert, 2005; Unnikrish-
nan et al., 2007). In other words, the PRI measures
the probability that pairs of pixels have consistent la-
bels in the set of ground-truth segmentations (Nguyen
et al., 2019). Given such a set of ground-truth seg-
mentations S
g
and a test segmentation S on n pixels,
the PRI is formally defined as:
PRI(S, S
g
) =
∑
i< j
c
i j
p
i j
+ (1 − c
i j
) · (1 − p
i j
)
n
2
(5)
where c
i j
denotes the event of a pair of pixels
i and j having the same label in S, and p
i j
is the
expected value of a random variable defined using
the corresponding Bernouilli distribution on the
ground-truth segmentations.
We also provide the Variation of Information (VI)
to allow a better comparison with state-of-the-art seg-
mentation techniques. This measure was introduced
by Meil
ˇ
a (Meil
ˇ
a, 2005) in order to compare two
clusterings according to their information difference.
Given two clusterings X and Y , VI is defined as:
V I(X,Y ) = H(X) + H(Y ) − 2I(X,Y ) (6)
where H(X ) is the entropy of X and I(X,Y ) the
Mutual Information between X and Y .
4 QUALITATIVE AND
QUANTITATIVE EVALUATIONS
Qualitative Evaluation. We present several seg-
mentations obtained on the BSDS500 dataset, and
compare it to the provided ground-truth segmenta-
tions. Due to the very nature of our algorithm, we pro-
pose both images with and without the merging pro-
cedure. Recall that due to the clustering and merging
procedures, the number of clusters of segmentations
is variable depending on the image at hand. See Fig-
ures 3 to 5.
GeST: A New Image Segmentation Technique based on Graph Embedding
249

(a) Original image (b) Initial segmentation (c) GeST segmentation (d) Colored regions
Figure 3: Illustration of the segmentation process (k = 22).
Quantitative Evaluation. We provide PRI and VI
results for several known segmentation techniques.
Since our approach is graph-based, we mainly com-
pare to such methods with a particular focus on tech-
niques based on community detection or modularity
optimization. We briefly present such methods:
• EDISON (Christoudias et al., 2002) uses the Mean
Shift algorithm as building block.
• Weighted Modularity Segmentation
(WMS, (Browet et al., 2011)) uses an approx-
imation of the Louvain method that unfolds
community structures in large graphs (Blondel
et al., 2008).
• Li-Wu (Li and Wu, 2014), Fast Multi-Scale
and Modularity optimization (FMS and
MO (Mourchid et al., 2016)), Louvain (Nguyen
et al., 2019) are based on modularity optimiza-
tion, together with image features (including
histogram of oriented gradients) and agglom-
erative algorithms for merging similar regions.
The main difference lies in the fact that the first
methods are region-based while the last one is
pixel-based.
• Felzenszwalb and Huttenlocher
(F&H (Felzenszwalb and Huttenlocher, 2004)) is
a graph-based method using grid-like graphs and
minimum spanning trees.
As one can see Table 1, our method provides rele-
vant results for both PRI and VI measures. Since our
method is not deterministic, we present the average
result taken over 10 runs. The first row corresponds
to a clustering with k = 21 clusters. The second row
is the method with an automatic selection of k.
The Impact of Embeddings. In order to illustrate
that the combination of embeddings of the Region
Table 1: Quantitative evaluation of different algorithms on
BSDS500 (see (Li and Wu, 2014; Nguyen et al., 2019)). Bot-
tom rows correpond to complex network-based segmenta-
tion techniques.
Methods PRI VI
GeST (k = 21) 0
0
0.
.
.8
8
80
0
09
9
9 2
2
2.
.
.1
1
13
3
35
5
5
GeST (automatic) 0
0
0.
.
.8
8
80
0
07
7
7 2
2
2.
.
.1
1
14
4
42
2
2
EDISON 0.786 2.002
F&H 0.770 2.188
WMS 0.752 2.103
Li-Wu 0.777 1.879
MO 0.803 −
FMS 0.811 −
Louvain 0
0
0.
.
.8
8
82
2
22
2
2 1
1
1.
.
.3
3
39
9
99
9
9
Table 2: Relevance of embeddings and color features.
Method PRI VI
GeST-FV 0.700 2.672
GeST-n2v 0.798 2.286
Adjacency Graph with image features is indeed ac-
curate, we applied Algorithms 1 and 2 with two other
sets of features, namely color features only (GeST-FV)
and embeddings only (GeST-n2v). The results de-
picted Table 2 show that while embeddings alone are
meaningful, using additional image features improve
the results.
Computing Different Clusterings. Since our
method relies on a clustering algorithm, the number
Table 3: Results obtained by keeping best segmentation
(w.r.t. PRI) for 2, 8, 15, 21 and 30 clusters.
Method PRI VI
GeST 0
0
0.
.
.8
8
82
2
20
0
0 1
1
1.
.
.8
8
82
2
28
8
8
VISAPP 2021 - 16th International Conference on Computer Vision Theory and Applications
250
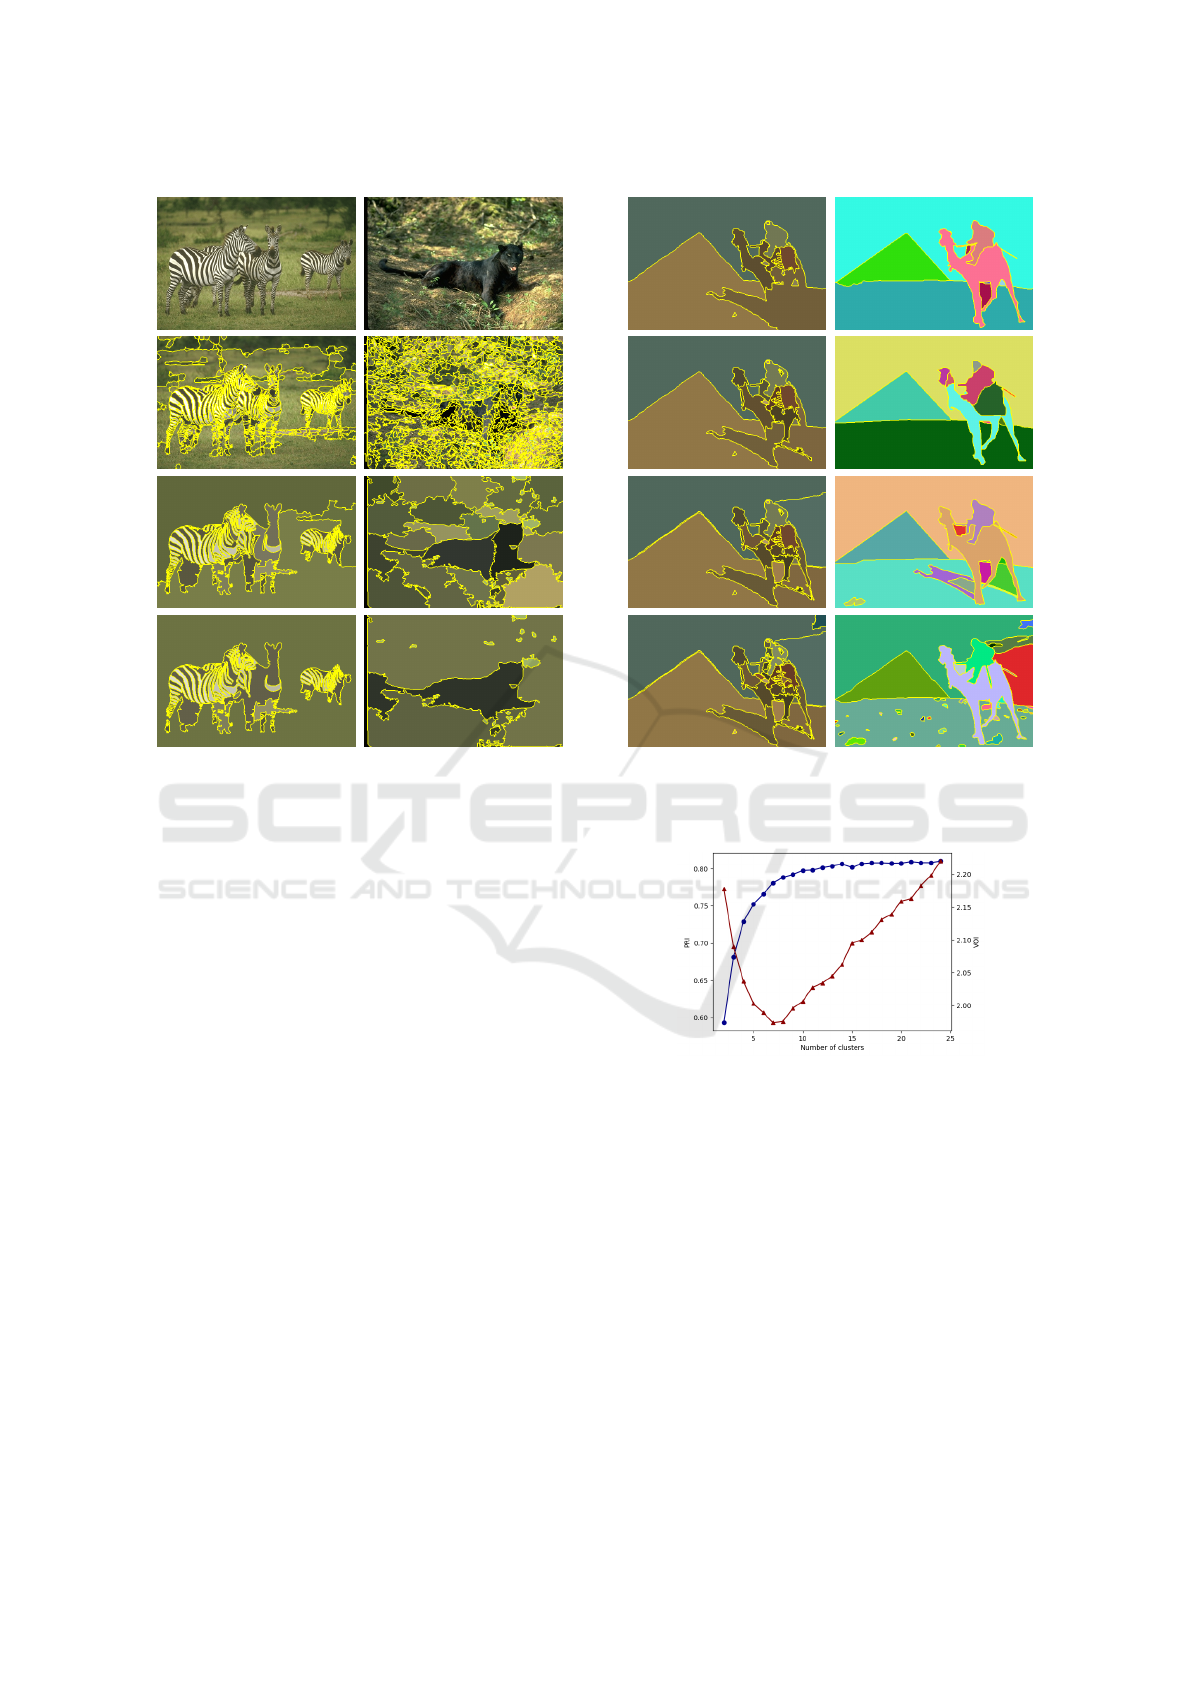
Figure 4: Impact of the merging procedure on two images
from the BSDS500 dataset. The original image is displayed
on top, and then Mean Shift initial segmentation, GeST
and merging results are displayed.
of clusters automatically determined by the algorithm
may have a great impact on the resulting segmen-
tation. Following an approach from Arbelaez et
al. (Arbelaez et al., 2010), we propose to compute
clusterings using a number of clusters ranging in
{2, 8, 15, 21, 30} and to keep the best result for
each image (w.r.t. PRI). The results are presented
Table 3. One can see that for every image, our
method encompasses a segmentation that agrees
with all ground-truth with high values of PRI and
low values of VI. Figure 6 illustrates the impact of
the number of clusters w.r.t. the evaluation metrics
presented Section 3. While PRI values are stable
from k = 12 with best values for k = 21, we observe
that the VI has lowest values for a lower number of
clusters. Recall that the average number of regions
for ground-truth segmentations is 20.
5 CONCLUSION
In this work we used a recent technique from com-
plex network analysis, so-called graph embedding,
as cornerstone for image segmentation. We propose
a general framework based on such a technique and
Figure 5: Left: different segmentations obtained with
8, 15, 21 and 30 clusters, respectively. Right: ground-truth
segmentations with 13, 14, 19 and 44 regions, respectively.
Figure 6: Mean PRI and VI values for GeST with number of
clusters k ranging from 2 to 24.
obtain state-of-the-art results with low computational
complexity and memory. Our method also relies on a
set of pre-computed superpixels with a merging pro-
cess, that have been used on community detection ap-
proaches (Li and Wu, 2014; Mourchid et al., 2016;
Nguyen et al., 2019). Since our aim was to illustrate
the relevance of graph embedding for image segmen-
tation, we relied on few image-related features. This
may hence be a first step toward obtaining better re-
sults. Moreover, it would be interesting to use a su-
pervised method to determine most parameters, that
were mainly set empirically or without the use of prior
knowledge provided by available test sets. This is for
instance the case for the number of clusters, which
GeST: A New Image Segmentation Technique based on Graph Embedding
251

can have a great impact on the result. While this can
be improved by merging, it would be interesting to see
whether classification can improve results. Finally,
we hope that this approach will yield a new direction
for image segmentation.
ACKNOWLEDGEMENTS
The author would like to thank Nicolas Dugu
´
e for
fruitful discussions regarding clustering algorithms.
REFERENCES
Achanta, R., Shaji, A., Smith, K., Lucchi, A., Fua, P., and
S
¨
usstrunk, S. (2012). Slic superpixels compared to
state-of-the-art superpixel methods. IEEE transac-
tions on pattern analysis and machine intelligence,
34(11):2274–2282.
Arbelaez, P., Maire, M., Fowlkes, C., and Malik, J. (2010).
Contour detection and hierarchical image segmenta-
tion. IEEE transactions on pattern analysis and ma-
chine intelligence, 33(5):898–916.
Blondel, V. D., Guillaume, J.-L., Lambiotte, R., and Lefeb-
vre, E. (2008). Fast unfolding of communities in large
networks. Journal of statistical mechanics: theory
and experiment, 2008(10):P10008.
Browet, A., Absil, P.-A., and Van Dooren, P. (2011). Com-
munity detection for hierarchical image segmentation.
In International Workshop on Combinatorial Image
Analysis, pages 358–371. Springer.
Cai, H., Zheng, V. W., and Chang, K. C.-C. (2018). A com-
prehensive survey of graph embedding: Problems,
techniques, and applications. IEEE Transactions on
Knowledge and Data Engineering, 30(9):1616–1637.
Cali
´
nski, T. and Harabasz, J. (1974). A dendrite method for
cluster analysis. Communications in Statistics-theory
and Methods, 3(1):1–27.
Christoudias, C. M., Georgescu, B., and Meer, P. (2002).
Synergism in low level vision. In Object recognition
supported by user interaction for service robots, vol-
ume 4, pages 150–155. IEEE.
Davies, D. L. and Bouldin, D. W. (1979). A cluster separa-
tion measure. IEEE transactions on pattern analysis
and machine intelligence, (2):224–227.
Felzenszwalb, P. F. and Huttenlocher, D. P. (2004). Effi-
cient graph-based image segmentation. International
journal of computer vision, 59(2):167–181.
Grover, A. and Leskovec, J. (2016). node2vec: Scalable
feature learning for networks. In Proceedings of the
22nd ACM SIGKDD, pages 855–864.
Li, S. and Wu, D. O. (2014). Modularity-based image seg-
mentation. IEEE Transactions on Circuits and Sys-
tems for Video Technology, 25(4):570–581.
Linares, O. A., Botelho, G. M., Rodrigues, F. A., and Neto,
J. B. (2017). Segmentation of large images based on
super-pixels and community detection in graphs. IET
Image Processing, 11(12):1219–1228.
Liu, D., Xiong, Y., Pulli, K., and Shapiro, L. (2011). Esti-
mating image segmentation difficulty. In International
Workshop on Machine Learning and Data Mining in
Pattern Recognition, pages 484–495. Springer.
Meil
ˇ
a, M. (2005). Comparing clusterings: an axiomatic
view. In Proceedings of the 22nd international con-
ference on Machine learning, pages 577–584.
Mourchid, Y., Hassouni, M. E., and Cherifi, H. (2016). An
image segmentation algorithm based on community
detection. In COMPLEX NETWORKS 2016, Milan,
Italy, pages 821–830.
Nguyen, T., Coustaty, M., and Guillaume, J. (2019). A
combination of histogram of oriented gradients and
color features to cooperate with louvain method based
image segmentation. In VISIGRAPP 2019, Volume
4: VISAPP, Prague, Czech Republic, February 25-27,
2019, pages 280–291. SciTePress.
Oliphant, T. E. (2006). A guide to NumPy, volume 1. Trel-
gol Publishing USA.
Pedregosa, F., Varoquaux, G., Gramfort, A., Michel, V.,
Thirion, B., Grisel, O., Blondel, M., Prettenhofer,
P., Weiss, R., Dubourg, V., Vanderplas, J., Passos,
A., Cournapeau, D., Brucher, M., Perrot, M., and
Duchesnay, E. (2011). Scikit-learn: Machine learning
in Python. Journal of Machine Learning Research,
12:2825–2830.
Recht, B., Re, C., Wright, S., and Niu, F. (2011). Hog-
wild: A lock-free approach to parallelizing stochastic
gradient descent. In Advances in neural information
processing systems, pages 693–701.
Rousseeuw, P. J. (1987). Silhouettes: a graphical aid to
the interpretation and validation of cluster analysis.
Journal of computational and applied mathematics,
20:53–65.
Tr
´
emeau, A. and Colantoni, P. (2000). Regions adjacency
graph applied to color image segmentation. IEEE
Transactions on image processing, 9(4):735–744.
Unnikrishnan, R. and Hebert, M. (2005). Measures of
similarity. In 2005 Seventh IEEE Workshops on Ap-
plications of Computer Vision (WACV/MOTION’05)-
Volume 1, volume 1, pages 394–394. IEEE.
Unnikrishnan, R., Pantofaru, C., and Hebert, M. (2007). To-
ward objective evaluation of image segmentation al-
gorithms. IEEE transactions on pattern analysis and
machine intelligence, 29(6):929–944.
Van der Walt, S., Sch
¨
onberger, J. L., Nunez-Iglesias, J.,
Boulogne, F., Warner, J. D., Yager, N., Gouillart, E.,
and Yu, T. (2014). scikit-image: image processing in
python. PeerJ, 2:e453.
Ward Jr, J. H. (1963). Hierarchical grouping to optimize an
objective function. Journal of the American statistical
association, 58(301):236–244.
Zhang, H., Fritts, J. E., and Goldman, S. A. (2008). Image
segmentation evaluation: A survey of unsupervised
methods. Computer vision and image understanding,
110(2):260–280.
VISAPP 2021 - 16th International Conference on Computer Vision Theory and Applications
252
