
A GIS Open Source Application to Perform the Spatial Distribution
of Prevention Quality Indicators (PQIs)
L. Duarte
1,2
a
, M. Lobo
3,4
b
, J. Viana
3,4
c
, A. Freitas
3,4
d
and A. C. Teodoro
1,2
e
1
Institute of Earth Sciences, FCUP pole, Rua do Campo Alegre, Porto, Portugal
2
Department of Geosciences, Environment and Spatial Planning, FCUP, Porto, Portugal
3
Department of Community Medicine, Information and Health Decision Sciences (MEDCIDS), Faculty of Medicine,
University of Porto, Porto, Portugal
4
Center for Health Technology and Services Research (CINTESIS), Faculty of Medicine, University of Porto, Porto,
Portugal
Keywords: GIS, Health Care Indicators, PQI, Spatial Database.
Abstract: Geographical variations carry important information for improving and planning more equitable and
sustainable health care services. Geographic Information Systems (GIS) are crucial tools that provide intuitive
visual help which contributes to a better understanding of the spatial distribution of health risk factors,
resources, care and outcomes. The interest in GISs have stimulated the development of several applications
worldwide to publicly inform the geographical patterns of health. However, in Portugal, this type of tools
remains underdeveloped for public reporting of health information. The aim of this study was to develop a
GIS open source application for spatial analysis of healthcare indicators in Portugal, using hospital data
obtained from the Administração Central do Sistema de Saúde, I.P. Specifically, given their importance to
monitor the quality of primary health care, data regarding Prevention Quality Indicators (PQIs) will be used
to establish a proof of concept of this tool. The tool was connected to a spatial database in order to filter the
parameters. Several maps based on PQI information were created in order to test the application. It was
concluded that the spatial combination of all the data provided in a GIS software and through an intuitive
application can contribute to the analysis of quality of primary health care.
1 INTRODUCTION
Geographical variations carry important information
for improving and planning more equitable and
sustainable health care services. However,
understanding geographic patterns can be
cumbersome and error-prone if performed through
frequency tables and traditional plots, especially if the
information covers several data sources and variables
such as health care, environmental, social, and
economical variables.
Geographic Information Systems (GIS) are
important tools that contribute to a better
understanding of the spatial distribution of health risk
factors, resources, care and outcomes through
a
https://orcid.org/0000-0002-7537-6606
b
https://orcid.org/0000-0003-3890-7735
c
https://orcid.org/0000-0003-4696-1002
d
https://orcid.org/0000-0003-2113-9653
e
https://orcid.org/0000-0002-8043-6431
intuitive geospatial visual interfaces. Therefore,
carrying valuable insights for policymakers, health
providers and populations. The interest in GIS has
stimulated the development of several applications
worldwide to publicly inform on geographical
patterns of health (DAP, 2020; Atlas, 2020; SAHSU,
2020; HWM, 2020). The use of GIS in public health
is increasing as a response to the requirements of
queries and analysis of health indicators
(Maheswaran and Craglia, 2004).
However, in Portugal, this type of tools remains
underdeveloped for public reporting of health
information. GEOSAUDE (http://www.geosaude.
dgs.pt/) a web GIS, and PORDATA (https://www.
pordata.pt/), a statistical database, offer regional
Duarte, L., Lobo, M., Viana, J., Freitas, A. and Teodoro, A.
A GIS Open Source Application to Perform the Spatial Distribution of Prevention Quality Indicators (PQIs).
DOI: 10.5220/0009805801290134
In Proceedings of the 6th International Conference on Geographical Information Systems Theory, Applications and Management (GISTAM 2020), pages 129-134
ISBN: 978-989-758-425-1
Copyright
c
2020 by SCITEPRESS – Science and Technology Publications, Lda. All rights reserved
129

variations health-related data interactive maps, within
Portugal.
The PORDATA only presents statistical data in the
form of numerical statistics, graphs and indicators.
This information is not spatially represented. The
GEOSAUDE is a powerful web GIS composed by
several indicators and options to filter the
information. However, it just allows the visualization
of the data. It does not allow to manipulate the
information.
The Portuguese administrative hospital database
from Administração Central do Sistema de Saúde,
I.P. (Central Administration of the Health System,
ACSS, 2020), is an essential tool to support hospital
funding based on diagnosis-related groups (DRG). It
also represents a fundamental source of data of the
official health statistics (Ferreira et al., 2017; OECD,
2019). This database is easily accessible and well
documented, with a high population and temporal
coverage, containing information regarding all
inpatient and outpatient hospitalizations of
Portuguese public hospitals in the mainland territory,
since 2000. As it contains data regarding the area of
residence of each patient (geographic location), it
may be easily usable in a GIS environment. This
possibility enhances the interoperability between the
data source and environmental data and even other
geographical variables. Therefore, potential value
may be added to this database through its integration
in GIS. The objective of this work was to develop a
GIS open source application which allows to easily
connect to a database of health quality indicators and
spatially represent them. The spatial representation of
the data will allow to analyse the indicators in a
national level. This analysis allows to relate other
factors with these health indicators.
1.1 Ambulatory Care Sensitive
Conditions (ACSCs)
The Ambulatory Care Sensitive Conditions (ACSCs)
are conditions for which good outpatient care can
potentially prevent or reduce the need for inpatient or
emergency care due to complications or more severe
diseases associated with these conditions (ACSC,
2016). For instance, diabetic complications may arise
if diabetes is not adequately monitored or if education
regarding patient self-management is not provided
(PQIO, 2020; AHRQ Quality Indicators, 2020).
The Agency for Healthcare Research and Quality
(AHRQ) developed a set of indicators based on
hospital administrative data – the Prevention Quality
Indicators (PQIs) – to measure quality of care for
several common ACSCs and compare local health
care systems across communities (PQIO, 2020).
In Portugal, 12,3% (n=1003602) of inpatient
hospitalizations were attributable to PQI-related
ACSCs, exhibiting several regional variation patterns
depending on the condition. The heart failure
hospitalizations were more common in the most
northern and interior regions of Portugal and in the
central Portugal (WHO, 2016; Sarmento et al., 2015;
Rocha et al., 2019). The low hospitalization rates
were reported to cluster closer to the coastal zones
and around bigger cities; higher hypertensive heart
disease hospitalization rates were reported in the
interior regions of the country (WHO, 2016;
Sarmento et al., 2015; Rocha et al., 2019). Therefore,
in Portugal, important insights may be gained
regarding the quality of health care in ACSCs from
monitoring regional variations of PQIs. This could be
used to screen potential problems in primary health
care system, direct further investigations to assess
causes of problems, and to compare performance of
regional community health care, which may assist in
the definition of public health recommendations and
ultimately improve health care in ACSCs.
To our knowledge, at the moment, there is no GIS
covering ACSCs care-related metrics such as the
PQIs. In this context, the development of a GIS
application under GIS software environment can help
to analyse and generate more information.
1.2 Objective
The aim of this study was the development of a GIS
open source application for spatial analysis of
healthcare indicators in Portugal, using hospital data
obtained from the ACSS. Specifically, given their
importance to monitor the quality of primary health
care data regarding PQIs will be used to establish a
proof of concept of this tool. The tool was connected
to a spatial database in order to filter the parameters.
2 MATERIAL AND METHODS
The GIS open source application was developed
under the open source software QGIS version 3.10,
(QGIS, 2019). Several Python libraries and
Application Programming Interfaces (APIs) were
used to develop the application, such as QGIS API
and Qt API (QGIS, 2020; Qt API, 2020). QGIS
supports spatial databases such as PostgreSQL and
PostGIS (PostGIS, 2020). The most recent versions
of QGIS provides a Qt Tool named Qt Designer for
designing and building graphical user interfaces
GISTAM 2020 - 6th International Conference on Geographical Information Systems Theory, Applications and Management
130

(GUIs) with Qt Widgets (Qt Designer, 2020). The Qt
Designer was used to create the application GUI. The
main objective of this GIS application was to improve
the connection to a spatial database, implemented in
PostGIS and spatially represent the PQIs. This
database is composed by multiple data. The focus is
to represent spatially the information and provide
some functionalities that can be useful to analyse the
database provided.
2.1 Data Sources/Database
In the database, the PQIs were estimated based on the
AHRQ definitions, using the hospital administrative
data and population estimates between 2014 and 2017
(INE, 2020). The hospital data cover all
hospitalizations of mainland Portuguese public
hospitals, containing demographic and clinical
information of the patients, such as age, sex,
residence, diagnoses, procedures, and the patient
disposition after discharge. Until 2016 the diagnoses
and procedures were coded according to the
International Classification of Diseases, 9
th
Revision,
Clinical Modification (ICD-9-CM). In 2016, a few
pilot hospitals initiated the transition to the ICD-10-
CM. During this transitional year the two clinical
classification systems coexist. This is an existent
attribute in the database of this study. As of the 1
st
of
January 2017, all public hospitals were instructed to
code in ICD-10-CM.
The PQIs encompass sixteen ambulatory care
sensitive conditions (Table 1). These are then
aggregated into four additional composite indicators
(Table 2).
Table 1: PQIs description.
PQI Code Description
PQI01 Diabetes Short-Term Complications
PQI02 Perforated Appendix
PQI03 Diabetes Lon
g
-Term Com
p
lications
PQI05 COPD or Asthma in Older Adults
PQI07 H
yp
ertension
PQI08 Heart Failure
PQI09 Low Birth Weight
PQI10 Dehydration
PQI11 Bacterial Pneumonia
PQI12 Urinar
y
Tract Infection
PQI14 Uncontrolled Diabetes
PQI15 Asthma in Younger Adults
PQI16
Lower-Extremity Amputation Among
Patients with Diabetes
Table 2: PQIs composites description.
PQI Code Descri
p
tion
PQI90 Prevention Qualit
y
Overall Com
p
osite
PQI91
Prevention Quality Acute Composite
(PQI11, PQI12)
PQI92
Prevention Quality Chronic Composite
(PQI1, PQI3, PQI5, PQI7, PQI8,
PQI14, PQI15, PQI16
)
PQI93
Prevention Quality Diabetes Composite
(PQI1, PQI3, PQI14, PQI16)
The PQIs were computed by sex, year, month and
the residence of the patient. The unit of analysis
considered was the district and Nomenclature of
Territorial Units for Statistics (NUTSIII).
2.2 PostGIS Database
The PostGIS database is a spatial database extender
for PostgreSQL object-relational database (PostGIS,
2019). PortGIS allows to query in Structured Query
Language (SQL) language and supports geographic
objects. It is released under the GNU General Public
License (GPL). There are several plugins developed
in QGIS which uses PostGIS such as DB Style
Manager, Fast SQL layer, PostGIS manager, among
others (QGIS plugins, 2020).
2.3 Application Development
As referred before, the application interface was
created through Qt Designer. Also, a PostGIS
database was created, and connected to the
application.
The application was developed using Python
programming language (Python, 2020). Several
libraries were also used such as PyQt5 and QGIS API.
The SQL language was implemented in order to
perform a selection based on the query applied by the
user. The SQL conditions run through pgsql2shp.exe
from PostgreSQL. In order to define the SQL queries,
a batch file is automatically created to run the exe
with the parameters defined by the user in the GUI.
The batch file is automatically saved in the plugin
folder and it is built in the moment that the user chose
the variables. Through the os.system function the
batch file runs and the shapefile is created and
automatically added to the canvas.
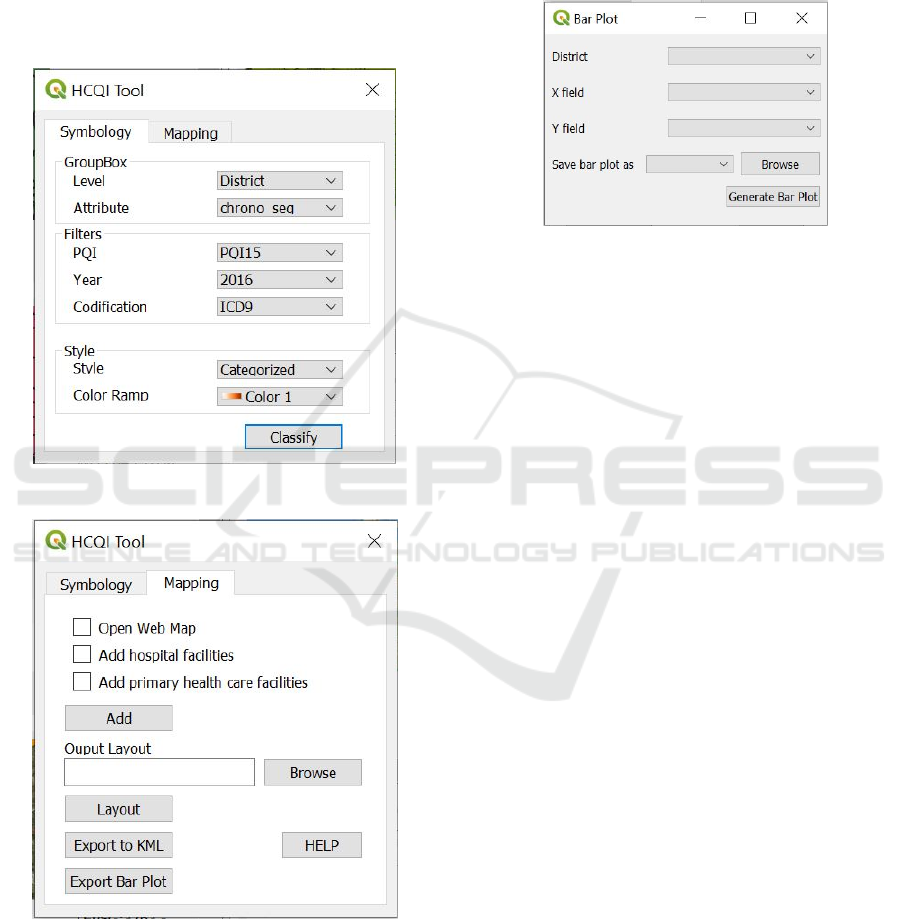
The application is composed by a button on QGIS
environment which opens a dialog composed by two
tabs: Symbology and Mapping. The first one allows to
represent spatially the PQIs data by a certain level
(district or NUTS) and using two types of symbology
(Figure 1), Categorized or Graduated; the Mapping
tab (Figure 2) allows to: i) incorporate a base map in
A GIS Open Source Application to Perform the Spatial Distribution of Prevention Quality Indicators (PQIs)
131
the QGIS canvas in order to overlap with other
information; ii) add some additional information such
as the connection to Bing Aerial Map, the location of
hospital facilities and/or primary health care facilities
(as point shapefile); iii) create a layout in order to
print the map; iv) convert the shapefile to KML
format and; v) to export a bar plot with the variation
of PQIs along the years (existent years in the
database).
Figure 1: Symbology tab of the HCQI application.
Figure 2: Mapping tab of the HCQI application.
In the second tab, Mapping, three check boxes
were added, and the user checks the box that pretends
to overlap and clicks on Add button to add the
information to the canvas. The Layout button allows
to create a layout with the information selected by the
user and composed with the main elements: north
arrow, scale, map and legend. The button Export to
KML connects to a new GUI. In this GUI, the user
selects the layer that pretends to convert in KML
format and save it. The Export Bar Plot connects to
other GUI (Figure 3).
Figure 3: Bar Plot functionality.
In this GUI, the user must choose a district, the
attribute to insert in the x axis and the attribute to
insert in the y axis. This functionality allows to create
a bar plot to a specific district and for the assigned
attribute. This functionality was implemented based
on Bar Plot algorithm from QGIS Processing
Toolbox (QGIS, 2020).
3 RESULTS
In order to test the application, a shapefile with the
district level was incorporated in the PostGIS
database. This shapefile allowed to select between
two levels: district or NUTSIII. Some maps based on
PQIs information were created in order to test the
application. Figure 4 presents the result of the
selection of PQI value for PQI90 in 2016 year with a
graduated symbology.
Other options were also tested, such as the
possibility of overlapping a web map to the data
already opened (Figure 4).
The proximity with primary care facilities and
hospitals are, among other factors, crucial in the
utilization of hospital care to treat ACSC (Carneiro,
2018). Therefore, the application was also
complemented with the possibility to add the national
hospital facilities and the primary health care
facilities. Figure 5 presents the overlapping of these
information with the aerial map (Bing Aerial Maps).
GISTAM 2020 - 6th International Conference on Geographical Information Systems Theory, Applications and Management
132
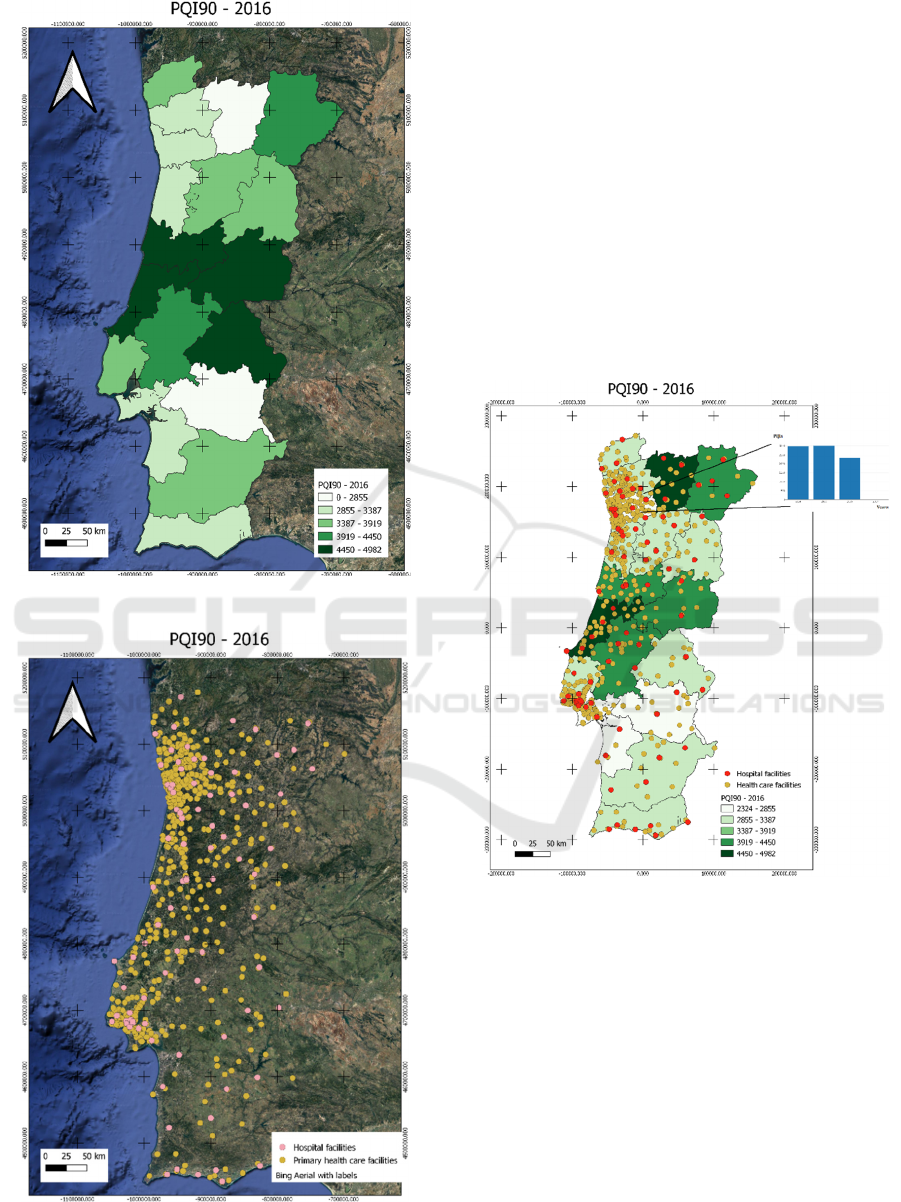
Figure 4: PQI90 in 2016 overlapped to Bing Aerial Map.
Figure 5: Overlapping of Bing Aerial Map with hospital and
primary care centres.
The implementation of these functionalities (the
addition of the hospital facilities and the health care
facilities) combined with the PQIs information,
provides the possibility to analyse the quality of
access to health care. Longer distances to primary
health care may represent a barrier to seek primary
health care, leading patients to use the hospital care
when conditions have worsened. Figure 6 presents the
overlapping between the facilities and the PQIs
information for PQI90 for 2016 year. In addition,
since the database is composed by data from 2014 to
2017, it would be very useful to analyse the PQIs
variation along the 4 years, so the possibility to create
bar plots with that variations was also tested. Figure
6 also presents a bar plot with the variation of PQIs
for Porto district.
Figure 6: Overlapping between hospital and primary care
centres and the information of PQIs.
From Figure 6 we can conclude that the number
of hospitalizations with ACSCs in Porto showed a
positive trend. Besides this possibility, the application
also converts a shapefile to KML format. This can be
very useful to open and overlap the data in Google
Maps® or Google Earth®.
4 CONCLUSIONS
The GIS application will be very useful to help the
health experts to understand the geographical
A GIS Open Source Application to Perform the Spatial Distribution of Prevention Quality Indicators (PQIs)
133

distribution of PQI values (by district or NUTS), even
apply filters in terms of PQI values, years and the
clinical codification system. The spatial combination
of all the data provided in a GIS software and through
an intuitive application can contribute to the analysis
of quality of primary health care. The implemented
filters may already provide insight to questions
regarding where (e.g. which districts?), when (e.g.
which year? Quality of care is getting better?) and
why (e.g. proximity to hospital? Distance to primary
health care facilities?) PQIs indicate better quality of
care. These are relevant questions to policymakers,
health care providers and the general population.
Even though among the list of indicators in
GEOSAUDE there is “the number of inpatient
hospitalizations with an ACSC”, this is still not
operational. Thus, to our knowledge there is no
application representing PQIs for Portugal.
In the future we intend to improve the GIS
application with the ability to infer and point out any
problems or areas needing further analysis in the data.
ACKNOWLEDGEMENTS
This work was funded through the Foundation for
Science and Technology, through the COMPETE
2020 programme and framed within the activities of
the UIDB/04683/2020. ICT financed through the
European Regional Development Fund (COMPETE
2020), with ref. POCI-01-0145-ERDF-007690.
It was also supported by FEDER - Fundo Europeu de
Desenvolvimento Regional funds through the
COMPETE 2020 - Operacional Programme for
Competitiveness and Internationalisation (POCI),
and by Portuguese funds through FCT - Fundac¸ão
para a Ciência e a Tecnologia in the framework of the
project POCI-01-0145-FEDER-030766 (“1st.
IndiQare - Quality indicators in primary health care:
validation and implementation of quality indicators
as an assessment and comparison tool”).
REFERENCES
ACSC. Ambulatory care sensitive conditions in Portugal.
World Health Organization. WHO Reg Off Eur. 2016.
ACSS. Administração Central do Sistema de Saúde. 2020.
http://www.acss.min-saude.pt/. Accessed January 2020.
AHRQ Quality Indicators. Guide to Prevention Quality
Indicators: Hospital Admission for Ambulatory Care
Sensitive Conditions. 2020. https://www.ahrq.gov/
downloads/pub/ahrqqi/pqiguide.pdf. Accessed January
2020.
Atlas. Atlas de hospitalizaciones por enfermedad isquémica
coronaria y procedimientos cardiacos. 2020.
https://www.atlasvpm.org/atlas/. Accessed January
2020.
Carneiro, C.S. Hospitalisation of ambulatory care sensitive
conditions and access to primary care in Portugal.
Public health. 2018. Dec 1;165:117-24.
DAP. The Dartmouth Atlas of Health Care. 2020.
https://www.dartmouthatlas.org/. Accessed January
2020.
Ferreira, R., Macedo, M., Pinto, F., Neves, R., Andrade, C.,
Santos, G. Programa Nacional para as Doenças
Cérebro-Cardiovasculares. 2017.
HWM. Health Workforce Mapper. 2020. https://www.ama-
assn.org/about/research/health-workforce-mapper.
Accessed January 2020.
INE. Instituto Nacional de estatística. 2020.
https://www.ine.pt/xportal/xmain?xpgid=ine_main&x
pid=INE&xlang=pt. Accessed January 2020.
Maheswaran, R. and Craglia, M. (Eds), 2004. GIS in Public
Health Practice. CRC Press.
Moore, R., Lopes, J., 1999. Paper templates. In
TEMPLATE’06, 1st International Conference on
Template Production. SCITEPRESS.
OECD. Health at a Glance 2019: OECD Indicators,
OECD Publishing, Paris. 2019. https://doi.org/10.1787/
4dd50c09-en.
PostGIS. Spatial and Geographic objects for PostgreSQL.
https://postgis.net/. Accessed January 2020.
PQIO. Prevention Quality Indicators Overview. 2020.
https://www.qualityindicators.ahrq.gov/modules/pqi_o
verview.aspx. Accessed January 2020.
Python. Python Programming Language.
http://python.org/. Accessed January 2020.
QGIS. QGIS Project. 2020. http://www.qgis.org/. Accessed
January 2020.
QGIS plugins. Plugins tagged with: postgis. 2020.
https://plugins.qgis.org/plugins/tags/postgis/. Accessed
January 2020.
Qt API. Qt API. 2020. https://doc.qt.io/qt-5/reference-
overview.html. Accessed January 2020.
Qt Designer. Qt Documentation. 2020. https://doc.qt.io/qt-
5/qtdesigner-manual.html. Accessed January 2020.
Rocha JV, Nunes C, Santana R. Avoidable hospitalizations
in Brazil and Portugal: Identifying and comparing
critical areas through spatial analysis. PloS one.
2019;14(7).
Sarmento J, Alves C, Oliveira P, Sebastiao R, Santana R.
Caracterização e evolução dos internamentos evitáveis
em Portugal. Acta Médica Portuguesa. 2015;28(5):590-
600.
SAHSU. UK Small Area Health Statistics Unit. The
environment and health atlas for England and Wales.
2020.
http://www.envhealthatlas.co.uk/homepage/index.html
. Accessed January 2020.
World Health Organization (WHO). Ambulatory care
sensitive conditions in Portugal. WHO Reg Off Eur.
2016.
GISTAM 2020 - 6th International Conference on Geographical Information Systems Theory, Applications and Management
134
