
A Graph-based Approach for Process Robustness in Unreliable
Communication Environments
Frank Nordemann
1
, Ralf T
¨
onjes
1
, Elke Pulverm
¨
uller
2
and Heiko Tapken
1
1
Faculty of Engineering and Computer Science, Osnabr
¨
uck University of Applied Sciences, Osnabr
¨
uck, Germany
2
Institute of Computer Science, University of Osnabr
¨
uck, Osnabr
¨
uck, Germany
Keywords:
Business Process, Process Robustness, Unreliable Communication Environments, BPMN, DAG, rBPMN.
Abstract:
The Business Process Model and Notation (BPMN) is broadly used to model and execute process definitions.
Many processes include different participants and require reliable communication to operate properly. How-
ever, BPMN is used in a growing number of use cases taking place in unreliable communication environments.
Intermittent or broken connectivity potentially interrupts or breaks down process operation. Methods for the
verification of process robustness are missing. This paper presents a graph-based approach to automatically
identify robust process path configurations. Using process-to-graph transition rules and robustness metrics,
graph-based search algorithms allow to find robust process paths and to rate their level of robustness. Pro-
cess examples show that well-known shortest-path algorithms not necessarily identify the most appropriate
path. Comparing all paths using metrics for the path robustness level and robustness probability is a promising
choice for most scenarios. Inspired by maximum-flow algorithms, a combined-path analysis may optimize
robustness by combining process paths based on different communication technologies.
1 INTRODUCTION
Aside from traditional business process domains like
banks, shops, the supplier- and shipping industry, the
Business Process Model and Notation 2.0 [BPMN,
(OMG, 2011)] is applied in a growing number of non-
traditional domains. BPMN is being used due to its
expressiveness, flexibility, mature tool support, ability
to execute process models and to model collaborative
processes including different participants.
Non-traditional use cases may take place in un-
reliable communication environments not addressed
by BPMN. Areas such as Cyber Physical Systems
(CPS), agriculture, road-side construction, environ-
mental and wildlife monitoring as well as scenarios
located in undeveloped or disaster affected regions
often encounter intermittent or broken connectivity.
However, connectivity-related issues should not lead
to interrupted or failed process executions.
The BPMN meta-model extension rBPMN
(Nordemann et al., 2020) has been designed to
enable robust process execution even in the case of
intermittent or broken connectivity. rBPMN ensures
robustness by providing alternatives for possibly fail-
ing message flows, by moving functionality between
participants and by dynamically integrating partic-
ipants and their functionality at process runtime.
Calculations based on connectivity estimations allow
to evaluate the robustness of individual message
flows at design time. However, rBPMN misses
mechanisms and metrics to analyze and evaluate the
robustness of an entire process.
This paper introduces a graph-based approach to
automatically identify and rank robust paths in a pro-
cess. The approach may be used at design time to
verify process robustness and at runtime to optimize
process execution. The main research contributions
of the paper include:
1. Process-to-Graph transition rules for BPMN and
rBPMN process elements in terms of communi-
cation robustness,
2. Robustness metrics allowing to identify robust
process paths and to rate their level of robustness,
3. A graph analysis heuristic for dynamically chang-
ing scenarios and a graph analysis procedure for
the combination of process path segments,
4. A comparison of graph-based search algorithms
for robust path identification and
5. Use-case-Driven recommendations for the selec-
tion and utilization of robustness metrics and
search algorithms.
Nordemann, F., Tönjes, R., Pulvermüller, E. and Tapken, H.
A Graph-based Approach for Process Robustness in Unreliable Communication Environments.
DOI: 10.5220/0009389100970107
In Proceedings of the 15th International Conference on Evaluation of Novel Approaches to Software Engineering (ENASE 2020), pages 97-107
ISBN: 978-989-758-421-3
Copyright
c
2020 by SCITEPRESS – Science and Technology Publications, Lda. All rights reserved
97

The remainder of the paper is as follows: First, re-
lated work (Section 2) and rBPMN (Section 3) are
presented, followed by the process-to-graph transi-
tion (Section 4) and the robustness analysis based on
search algorithms (Section 5). Lastly, results are dis-
cussed (Section 6) before a summary concludes the
paper (Section 7).
2 RELATED WORK
BPMN has been used and extended for various use
cases and application areas (Braun and Esswein,
2014). Worth mentioning are the diverse activ-
ities in the areas of the Internet of Things (IoT)
(Meyer et al., 2013), (Chiu and Wang, 2013) and
CPS (Graja et al., 2016), (Bocciarelli et al., 2017),
aiming to include new physical entities as resources
for business processes. IoT resources may differenti-
ate from each other by Quality of Information (QoI)
aspects, including the reliability of physical entities.
This topic is addressed by several publications,
allowing to integrate and observe QoI aspects in
business processes (Martinho and Domingos, 2014),
(Domingos et al., 2020).
Reliability and performance of BPMN processes
is discussed in (Bocciarelli and D’Ambrogio, 2011).
A meta-model extension adds metadata descriptions
about process / task reliability (e.g. mean time be-
tween failure for a task) and performance character-
istics (e.g. time required for a task). Further elabo-
rations in (Bocciarelli et al., 2014) allow to simulate
processes prior to runtime.
Process reliability is also discussed in (Resp
´
ıcio
and Domingos, 2015). Using an added reliabil-
ity value for each activity, the overall process re-
liability is calculated. Effects of human and non-
human resources on process reliability are addressed
in (Domingos et al., 2016).
A BPMN extension to integrate Wireless Sen-
sor Networks (WSN) is illustrated in (Sungur et al.,
2013). The extension enhances usage of sensor-based
data by adding a WSN task, WSN pool and perfor-
mance annotations.
The reliability of ambient assisted living systems
is handled in (Martinho et al., 2016). By integrat-
ing reliability information about various used compo-
nents into BPMN, the overall reliability may be eval-
uated for appropriate resource allocation.
In (Mazzola et al., 2017), a mechanism based
on semantically annotated process models allows to
compensate faulty tasks for process service plan exe-
cution in cloud environments.
Some publications use BPMN in conjunction with
Directed Acyclic Graphs [DAG’s, (Even, 2011)]. (Di-
jkman et al., 2007) introduce formal semantics in
terms of mapping BPMN to Petri nets, allowing to ap-
ply existing analysis methods to process definitions.
The authors continue their work in (Dijkman et al.,
2009) to check BPMN processes for similarities in
relation to tasks and control flows. (Ceballos et al.,
2015) use DAG’s to model and advice on human ac-
tivities. In contrast, (Gounaris, 2016) apply perfor-
mance optimization methods (reordering and paralyz-
ing tasks) on DAG’s originating from reduction strate-
gies for data-intensive queries and flows.
The process-to-graph-transition presented in this
paper has similarities with the previously listed pub-
lications. For instance, all publications map activities
to graph vertices and sequence flows / message flows
to graph edges. However, the objectives of the pub-
lications differ, resulting in differences of the graph
mapping. Some concepts rely on probabilistic models
and statistics for the graph mapping. Others avoid the
use of edge weights. Significant differences exist in
mapping BPMN gateways due to focusing on differ-
ent aspects (e.g. performance, similarity, human ac-
tivities, communication robustness) and varying anal-
ysis methods and algorithms.
To the best of the authors’ knowledge, no publica-
tion focuses on evaluating process reliability / robust-
ness with regards to unreliable communication envi-
ronments. Due to different objectives, no literature
contribution outlines a process-to-graph transition as
required for communication robustness. Identifica-
tion and comparison of robust process paths are miss-
ing. Besides, no publication provides a graph map-
ping for rBPMN’s extension elements.
3 RESILIENT BPMN (rBPMN)
This section introduces rBPMN (Nordemann et al.,
2020), a BPMN extension for robust process model-
ing in unreliable communication environments.
The motivation for rBPMN’s development orig-
inates from the growing use of BPMN in environ-
ments featuring intermittent or broken connectivity.
Since communication is not in the focus of BPMN,
rBPMN extends its meta-model allowing domain ex-
perts to include alternatives for failing connectivity,
to move functionality between participants, to check
robustness at design time and to dynamically adapt a
process at runtime.
rBPMN realizes robustness by introducing new
process elements presented in Figure 1. Opportunistic
Message Flows (abbreviated: OppMessageFlows) de-
scribe possibly failing message transfers between par-
ENASE 2020 - 15th International Conference on Evaluation of Novel Approaches to Software Engineering
98

MovTask
(moveable)
OppTask
OppDynTask
Autonomy
attribute
MovSubProc.
(moveable)
OppMessageFlow
MessageFlow (BPMN)
OppPriorityFlow
1
a
OppDecisionFlow
MovParticipant
(moveable)
Figure 1: rBPMN message flows, activities and attributes.
ticipants. The flows’ metadata includes information
about the message to be transferred and an estimated,
scenario-based connectivity. OppMessageFlows may
be grouped by non-graphical OppMessageGroups to
define sets of alternatives for different topics or con-
cerns. In an OppMessageGroup, only one alterna-
tive needs to communicate successfully to establish
robustness. The decision for one of the alternatives
can be priority-based (OppPriorityFlows) or criteria-
based (OppDecisionFlows).
The addition of moveable tasks and participants
(MovTasks, MovSubProcesses, MovParticipants) en-
ables a movement of (limited) functionality or ser-
vices from one participant to another. In case of fail-
ing connectivity, a process may continue its operation
by executing the moved functionality locally using an
OppTask. Locally moved functionality is indicated by
the autonomy attribute (cf. Figure 1). An OppDyn-
Task allows to integrate dynamically appearing par-
ticipants at process runtime. Here, appearing partici-
pants that offer functionality required by an OppMes-
sageGroup dynamically extend the group as an addi-
tional alternative. Typical use cases for OppDynTasks
are applications in Mobile Ad-Hoc Networks, Delay-
Tolerant Networks and Opportunistic Networks.
rBPMN is able to check the robustness of mes-
sage flows at design time. Robustness calculations
examine the required message size, available band-
width, failure probability and given time frame to
state whether or not a message flow is robust. The
reader is referred to (Nordemann et al., 2020) for
more information about technical insights.
Since rBPMN is only able to evaluate the ro-
bustness of individual message flows between partic-
ipants, it motivates this paper to address and evaluate
robustness of an entire process.
4 PROCESS-TO-GRAPH
TRANSITION
The application of graph-based search algorithms for
the robustness analysis requires to translate a process
into an acyclic graph first. This section introduces a
procedure to map BPMN processes to DAG’s with re-
spect to communication robustness.
P1
Ex1
T2
T1
Figure 2: Process example Ex1.
Ex1
T1
T2
Ex1'
P1 T1'
Figure 3: Robustness graph of Ex1.
4.1 Creation of Robustness Graph
Figure 2 depicts a simple process example Ex1 featur-
ing exclusive gateways (XOR) and a participant P1.
As indicated by the OppMessageFlows, communica-
tion of task T1 with P1 may be interfered. In contrast,
path segment including T2 requires no communica-
tion and is always robust. Only one of the two paths
including T1 or T2 is chosen depending on the param-
eters instructing the exclusive gateway with its deci-
sion.
The related robustness graph G
Ex1
= (V,E) in-
cludes a set of vertices V representing BPMN ac-
tivities / participants and several edges E reflecting
sequence flows and message flows. As shown in
Figure 3, G
Ex1
has a starting vertex Ex1 and an ending
vertex Ex1’. Accordingly, communication of T1 with
P1 is arranged by T1 → P1 → T1’. A second graph
path represents the use of T2 instead of T1.
A second process example Ex2 is illustrated in
Figure 4, featuring exclusive and parallel gateways.
Communication with all participants is unreliable.
The associated robustness graph in Figure 5 has been
created using transition rules summarized in Table 1.
The transition is explained in detail subsequently.
In the first part of the process (Ex2a in Figure 4,
Ex2 → G in Figure 5), the paths of T1 and T2 are sep-
arated by an exclusive gateway. Since only one of the
two paths is chosen, the graph reflects this by adding
separate paths for T1 and T2 and merging them after-
wards.
At T2, communication with P2a and P2b is re-
alized by OppDecisionFlows belonging to the same
OppMessageGroup, labeled with the character a. Ei-
ther communication with P2a or P2b has to work for
a robust process. Hence, T2 connects P2a and P2b
by separate paths, resulting in three path options for
robustness in Ex2a. The vertex G is used as a glue ver-
tex, since there is no BPMN activity element merging
A Graph-based Approach for Process Robustness in Unreliable Communication Environments
99

Table 1: Rules for the transition of BPMN and rBPMN process elements to graph segments.
Process Element Graph Segment Explanation
BPMN Gateways (GW’s)
Exclusive GW,
Event-based GW
Separated paths X Only one of the GW options is chosen and needs to be part of
the process path.
Parallel GW Extended path X Robustness depends on all summarized GW options.
Inclusive GW,
Parallel event-based GW
Separated and
extended paths
X One or more GW options can be chosen. Possible GW option
combinations need to be reflected in the graph.
Complex GW Separated paths and /
or extended path(s)
X No general rule can be provided, depends on concrete GW op-
tions. In practice often replaced by other GW’s.
BPMN Path Merging by Exclusive GW
Splitting GW:
parallel, inclusive, complex,
parallel event-based
Separated and
extended paths
X Splitting GW and merging exclusive GW results in multiple
executions of the merged process segment. The number of
executions depends on the number of combined options.
BPMN Flows / Events
Conditional sequence flow X Different way to model GW options. GW transition rules are
applied.
Message flow a) Extended path
b) Remove element
X* a) If robustness requires a successful message flow.
b) If robustness is not affected by message flow.
Event X If relevant for robustness, the event is initiated by a message
flow. Message flow transition rules are applied.
Interrupting event / signal Separated paths X Event / signal occurrence modifies process path. Robustness
depends on the alternative path initiated by the event / signal.
BPMN Activities / Participants
Sub-process,
Call activity
Extended path X Robustness depends on activities within the sub-process / call
activity. Graph may be extended by a subgraph.
Pool
Collapsed pool
X Represent a (summarized) subgraph. Transition rules of mes-
sage flow are applied.
rBPMN Flows
OppMessageFlow,
OppPriorityFlow,
OppDecisionFlow
a) Extended path
b) Remove element
X* a) If robustness requires a successful message flow.
b) If robustness is not affected by message flow.
OppMessageGroup Separated paths X OppMessageGroups define sets of alternative flows. Hence,
every flow results in a separate path in the robustness graph.
Multiple OppMessageGroups Extended path X Multiple OppMessageGroups separate alternatives for differ-
ent concerns, resulting in an extended path.
rBPMN Activities / Participants
OppTask
(moved functionality)
a) Separated paths
b) Extended path
X* OppTasks allow to execute functionality of other participants.
A local functionality a) adds an alternative to an existing
OppMessageGroup or b) stands for itself.
OppDynTask
(dynamic participants)
Separated paths X OppDynTasks allow to integrate dynamically appearing partic-
ipants as alternatives for existing OppMessageGroups.
MovTask, MovSubProcess,
MovParticipant
Separated paths X One path for executing functionality on a remote participant.
Another path for local execution of functionality.
Declaration: Xautomatable X* requires process context information to be automated
ENASE 2020 - 15th International Conference on Evaluation of Novel Approaches to Software Engineering
100

Ex2
T1
T2
T3
T4
T5
P3
P4
P1
P2a
P2b
a
a
a)
b)
Figure 4: Process example Ex2.
the different process paths.
The second process part Ex2b executes T3, T4 and
T5 in parallel. T3 and T4 are influenced by unreliable
communication, T5 includes no communication and
is always robust. All three tasks need to be executed
for a robust process due to the parallel gateway. To
reflect this in the graph, the path of T3 is extended by
the paths of T4 and T5.
T3 needs to call a functionality offered by P3.
This can be done by i) calling P3 and receiving the
desired result or by ii) moving (limited) functionality
from P3 to T3 and execute it locally (P3l). The ro-
bustness graph integrates this by two separate paths
between T3 and T3’.
T4’s communication with P4 may interrupt or
break. Since there are no decisions, its representa-
tion in the graph is a single path T4 → P4 → T4’.
Lastly, T5 is robust since it is not involved in any com-
munication. By extending the path of T3 / T4 with
a vertex for T5, the robustness graph of Figure 5 is
complete. The next subsection explains the x-labeled
graph edges and why the inclusion of T5 is dispens-
able in this scenario.
There is no need to translate BPMN processes to
robustness graphs manually. Transition can be auto-
mated following the rules of Table 1. As denoted,
some elements require additional semantics to clarify
the meaning of the modeled process segment. This
may be done by BPMN text annotations or metadata.
4.2 Reduction of Robustness Graph
The robustness graph in Figure 5 relates to the BPMN
process illustrated in Figure 4. However, only a subset
of edges and vertices included in the graph is exposed
to unreliable communication and its consequences for
robustness. The affected edges have been labeled
with an x, representing process parts where unreliable
communication or moving of functionality occurs.
Figure 6 illustrates a simplified version of the robust-
ness graph shown in Figure 5. Unlabeled edges have
been removed. Where necessary, vertices have been
removed or combined. The outcome is a compact
DAG, ready to be assigned with edge weights and to
serve as a basis for the graph analysis.
In general, process elements affected by robust-
ness need to be part of the graph. In the area of unreli-
able communication environments, this requires con-
sideration of:
• Possibly failing message flows (OppMessage-
Flows, OppPriorityFlows, OppDecisionFlows),
• moveable activities (MovTasks, MovSubPro-
cesses, MovParticipants),
• locally executable functionality (OppTasks) and
• dynamic alternatives (OppDynTaks).
It is important to include all possible process paths
in the graph after simplification. If a path segment
between gateways is robust due to avoidance of com-
munication, it may be combined to a single vertex but
still needs to be part of the graph. For instance, it is
not allowed to remove T2 from the graph of Ex1 in
Figure 3.
4.3 Further Transition Elaborations
Not all transition rules listed in Table 1 have been ap-
plied in the transitions of process examples Ex1 and
Ex2. This section provides concluding examples for
significant transition aspects based on (reduced) ro-
bustness graphs.
4.3.1 Path Merging by Exclusive Gateways
Parallel and inclusive gateways split the BPMN pro-
cess token into as many tokens as outgoing gateway
options apply. When the tokens arrive at a merg-
ing point realized by a parallel or inclusive gateway,
the process is synchronized by merging all previously
created token copies. However, if merging is realized
by an exclusive gateway, no synchronization takes
place and all token copies continue their way to the
process’ end. This is also affecting robustness, since
the merged segment of the process will be executed
multiple times.
Process example Ex3 (Figure 7) illustrates process
merging by an exclusive gateway. In Ex3a, a paral-
lel gateway splits the process into two path segments
calling services at participants P1 / P2. The related
robustness graph shown by Figure 8 has been created
using parallel gateway transition rules by extending a
common graph path (cf. Table 1). After an exclusive
gateway merging P3 is executed twice, since the two
A Graph-based Approach for Process Robustness in Unreliable Communication Environments
101
Ex2
T1
T2
Ex2'
P1
x
T1'
G
P2a
x
P2b
x
T2'
T3
P3
x
P3l
x
T3' T4 P4
x
T4' T5
x
x
x
x
x
x
b)
a)
Figure 5: Robustness graph of Ex2.
Ex2
P1
x
P2a
x
P2b
x
Ex2'T3
P3
x
P3l
x
T4 P4
x
x
x
x
x
x
x
Figure 6: Reduced robustness graph of Ex2.
Ex3
T2
T1
T3
b)
a)
P1
P2
P3
Figure 7: Process example Ex3 featuring a merging exclu-
sive gateway.
process tokens created by the parallel gateway have
not been synchronized.
The parallel gateway has been replaced by an in-
clusive gateway in Ex3b. One, some or all outgo-
ing process segments may be chosen by the inclusive
gateway, depending on process variables. The robust-
ness graph in Figure 9 reflects this by three separate
paths for i) P1, ii) P2, iii) P1 and P2. Here, each path
continues to the end of Ex3b and includes the merged
process segment as many times as gateway options
have been combined. The path including both P1 and
P2 combines two options and the common path exe-
cutes P3 twice.
4.3.2 Integration of Subgraph Segments
Pools represent participants in BPMN. A participant
may be an actor or system part of a different organiza-
tion, resulting in Service Level Agreements (SLA’s)
taking care about the robustness of offered services
or functionalities. However, a participant may also
be part of the same organization accepting robustness
configuration demands. In the latter case, relevant ro-
bustness graph segments of the service offering par-
ticipant can be integrated into the graph of the calling
participant.
This has been done for the graph of P1, which was
inserted into the graph of Ex1 in Figure 10. P1 in-
Ex3a P1 Ex3a'P2 P3 P3
2-times P3
Figure 8: Robustness graph of Ex3a.
P1 P3
P2 P3
P1 P2 P3
Ex3b'
P3
Ex3b
x-times P3x gateway options
Figure 9: Robustness graph of Ex3b.
cludes two separate paths for calling P6 / P7 and is
now part of Ex1’s robustness calculation. Ex1 may
choose the service for P1 to enhance robustness. The
same procedure allows to integrate graphs of sub-
processes.
4.3.3 Integration of Dynamic Participants
rBPMN allows to enhance robustness by dynamically
integrating participants at process runtime. Using
OppDynTasks, dynamic participants add an option to
an existing OppMessageGroup that needs to be re-
flected in the robustness graph. The illustration pro-
vided in Figure 11 is based on process example Ex1 of
Figure 2. Besides calling a service at P1, T1 may call
a service located at the dynamically appearing partic-
ipant Pd. Typical use cases for dynamic participants
are ad-hoc, delay-tolerant or opportunistic networks
[cf. (Fall, 2003), (Pelusi et al., 2006)].
Ex1
T1
T2
Ex1'
P1
T1'
P7
P6 P1'
Subgraph of P1
Figure 10: Integrated path segment of P1 into robustness
graph of Ex1.
Pd
T1'P1
Ex1
T1
T2
Ex1'
Figure 11: Dynamic participant Pd in the robustness graph
of Ex1.
ENASE 2020 - 15th International Conference on Evaluation of Novel Approaches to Software Engineering
102

Table 2: Robustness metrics.
Semantic Symbol & Formula P*
Number of path edges n ∈ N X
Robustness of path edge R
e
∈ R
(Total) robustness of path R
t
=
∑
n
i=1
R
e
i
Robustness level of path R
l
= min(R
e
1
,...,R
e
n
) X
Average robust. of path R
a
= R
t
/n X
Median robust. of path R
m
= median(R
e
1
,...,R
e
n
) X
Range of path R
r
= max(R
e
1
,...,R
e
n
) − R
l
X
P* ⇒ also applicable to probability-based graphs
5 ROBUSTNESS GRAPH
ANALYSIS
Based on the robustness graphs of Section 4, this
Section defines robustness metrics and applies graph-
based search algorithms to find robust process config-
urations.
5.1 Robustness Metrics
Multiple metrics to measure robustness are introduced
subsequently. A distinction is made between the ap-
plication of edge weights based on estimated connec-
tivity and based on probabilities.
5.1.1 Estimated Connectivity Weights
rBPMN introduced a mechanism to calculate the ro-
bustness of a message flow at design time. The calcu-
lation includes parameters such as estimated message
size, protocol overhead, available bandwidth, and fail-
ure probability. In (Nordemann et al., 2020), the
mechanism has been used to specify whether or not
a message flow is robust. However, the resulting ro-
bustness R
e
∈ R|R
e
≥ 0 of the calculation includes ad-
ditional information. R
e
basically describes, how of-
ten a message can be sent in an available time period
(cf. Equation 1).
R
e
< 1 : Message can be sent only partly
R
e
= 1 : Message can be sent exactly once
R
e
> 1 : Message can be sent more than once
(1)
The calculated robustness R
e
for a message flow is
used as a weight for the corresponding edge in the
robustness graph. This way, it is not only possible to
find a robust process path, but to rank the robustness
of different paths. Identified process paths may be
compared by metrics of Table 2.
Table 3: Metrics exclusive to probability-based graphs.
Semantic Symbol & Formula
Probability of path edge P
e
∈ R|0 ≤ P
e
≤ 1
Probability of path P
p
=
∏
n
i=1
P
e
i
Boolean prob. of path P
b
= 0 (∀ P
p
< 1)
P
b
= 1 (∀ P
p
= 1)
Calculations are based on estimated parameters and
may differ from real-world connectivity. Raising the
minimum robustness level R
l
allows to include a con-
nectivity safety margin for robust process paths. For
instance, a scenario may define a minimum R
l
= 2.0
for robust process paths. A path with R
l
= 1.5 would
be rated as not robust, since it is not able to provide
the requested connectivity safety margin.
5.1.2 Probability Weights
Estimating use case connectivity by detailed parame-
ters may be challenging for domain experts unfamiliar
with communication technologies. It may be easier
for them to describe connectivity based on probabili-
ties. Alternatively, used applications may record con-
nectivity by logging successful and failing message
transfers. In these cases, evaluations may be done
by applying the identified probabilities as robustness
probability P
e
∈ R|0 ≤ P
e
≤ 1 to appropriate edges.
Applicable metrics are listed in Table 2 and Table 3.
5.2 Shortest-path / Longest-path
Analysis
Shortest-path algorithms such as Dijkstra (Even,
2011) and Bellman-Ford (Bellman, 1958) find the
path with lowest total weight (or cost) from a source
to a destination. Since not minimum cost, but
maximum robustness is desired here, edge weights
need to be adjusted by i) inverting positive weights
(R
e
new
= (R
e
old
− R
e
max
) ∗ −1) or by ii) applying nega-
tive weights (R
e
new
= R
e
old
∗−1), if supported. Or else,
a longest-path analysis with maximum total weight is
applied, leading to the same result. While the longest-
path problem is NP-hard in general, it can be solved
in polynomial time in DAG’s applied here (Sedgewick
and Wayne, 2011). If calculation effort is not critical,
implementations may be based on the Breadth-First
Search [BFS, (Even, 2011)]. Since the following sub-
sections apply positive edge weights, the longest-path
method is used subsequently.
Figure 12 shows the result of a longest-path anal-
ysis on process example Ex2 with the chosen path as
a dashed line. While the path with highest robustness
R
t
from Ex2 → Ex2’ has been chosen, the path is not
robust because of the path robustness level R
l
= 0.8.
A Graph-based Approach for Process Robustness in Unreliable Communication Environments
103

P1
T3
6.0
Ex2
0.8
P2a
1.5
P2b
2.1
Ex2'
P3
1.4
P3l
3.0
T4 P4
2.01.7
2.3
1.6
2.3
3.0
Figure 12: Longest-path analysis on Ex2 using estimated
connectivity weights.
P1
T3
3.0
Ex2
P2a
1.5
P2b
2.1
Ex2'
P3
1.4
P3l
3.0
T4 P4
2.01.7
2.3
1.6
2.3
3.0
Figure 13: Longest-path analysis on Ex2 after removal of
non-robust edges (R
e
max
= 3.0).
This is due to the impact of an edge with a weight
of 6.0, which guides the algorithm to include P1 into
the path. The mechanism might help for maximizing
the total weight, but certainly not for finding robust
process paths.
Removing all non-robust edges R
e
< 1 (cf.
Equation 1) from a graph enables the analysis to find
only robust paths. Furthermore, it is suggested to limit
the maximum weight of an edge R
e
max
to avoid over-
weighting graph edges. R
e
max
is also applied to edges
representing locally moved functionality (e.g., edges
connected to P3l of Ex2) and edges that have no ro-
bustness influence. Figure 13 presents an adjusted
process graph and the resulting path with highest ro-
bustness of a longest-path analysis.
Figure 14 illustrates a longest-path analysis using
exemplary probability values as edge weights. The
analysis summarizes edge weights to choose the path
with highest total weight
∑
n
i=1
P
e
i
. Especially when
using probabilities, this might not identify the most
appropriate path. It is important to include other met-
rics such as the probability of the path P
p
. Further-
more, adjusting the graph by removing all edges not
fulfilling a defined minimum robustness level R
l
may
be useful.
5.3 Maximum-step Analysis
With the maximum-step analysis, a straightforward
heuristic for finding robust process paths is introduced
in this paper. Based on the Depth-First Search (DFS,
(Tarjan, 1972)), the algorithm chooses the edge with
the highest weight at each separation point (or step)
until the end vertex is reached. The algorithm in-
cludes an optional parameter for a minimum path ro-
bustness level R
l
. If it has to choose an edge not meet-
ing the desired robustness level, the algorithm returns
to the last separation point and chooses the next high-
est ranked edge to continue the path to the end vertex.
The analysis will present no outcome if no path with
the required robustness level exists.
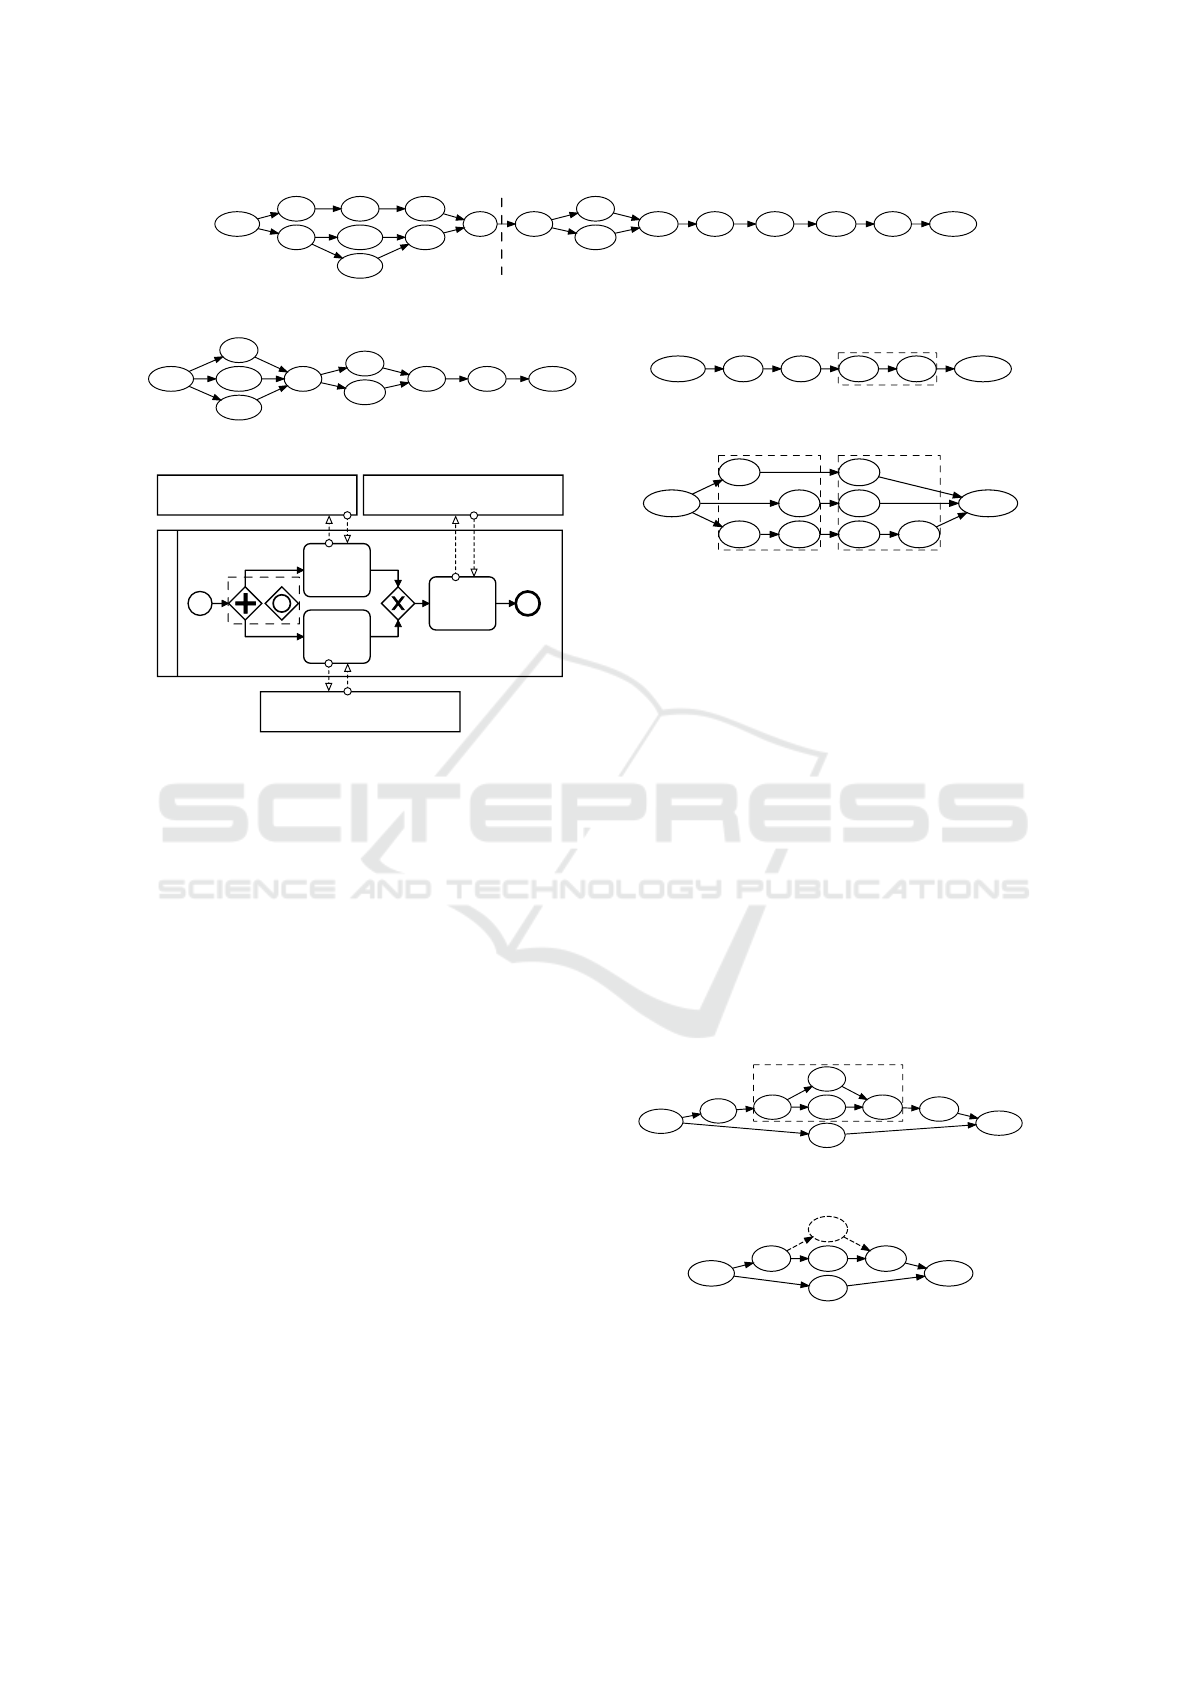
Applying the maximum-step heuristic to the Ex2
P1
T3
1.0
Ex2
0.7
P2a
0.8
P2b
0.9
Ex2'
P3
0.8
P3l
1.0
T4 P4
0.90.9
0.9
0.9
0.9
1.0
Figure 14: Longest-path analysis on Ex2 using probability
edge weights.
P1 P3
1.3
Ex4
1.7
P2
1.5
Ex4'
P4
2.0
P5
1.4
P6
2.3
1.4
2.5
Figure 15: Challenging robustness graph for maximum-step
heuristic.
graphs of Figure 13 and Figure 14 leads to the same
chosen paths as depicted in the Figures. However,
facing conditions as shown by Figure 15 is challeng-
ing for the maximum-step analysis and will not re-
sult in finding the most robust path. In the graph of
Figure 15, the heuristic is unable to notice the more
robust path including P2 / P4 / P6. However, the
algorithm may be an appropriate choice for highly
dynamic scenarios, where graph edge values show a
level of uncertainty or do change rapidly.
5.4 All-path Analysis
Evaluating robustness graphs using the all-path
method is a versatile type of analysis. All pos-
sible process paths between source and destination
are identified (e.g. using BFS or DFS). The differ-
ent paths are compared by use-case-driven metrics.
For instance, the robustness level of a path R
l
is of
main interest for many scenarios, especially when dis-
tinguishing between different robust process paths.
When working with non-robust process paths and
edge weights based on probabilities, the probability
of the path P
p
might be the main relevant factor.
Table 4 compares the paths for process example
Ex2 with different metrics. The estimated connec-
tivity and probability weights of Figure 12 and Fig-
ure 14 are used for the calculations. Evaluating esti-
mated connectivity edges by path robustness R
t
leads
to chose the path including P1 / P3l, a non-robust pro-
cess path. Focusing on the robustness level of the
path R
l
corrects the evaluation by choosing the path
including P2b / P3l. The same result is presented by
the probability of the path P
p
. Metrics may be prior-
itized or combined to decide on the most appropriate
process path.
5.5 Combined-path Analysis
Finding the most robust configuration for a process
does not necessarily mean to find the path with high-
est robustness R
t
or highest probability P
p
. A pro-
cess may utilize hybrid networks to combine different
ENASE 2020 - 15th International Conference on Evaluation of Novel Approaches to Software Engineering
104

Table 4: Comparison of different process paths using an all-
path analysis and selected metrics.
Path variation Est. edge weights Prob. edge weights
Ex2 → Ex2’
R
l
R
t
R
a
R
r
P
p
P
l
P
a
P
r
P1 / P3 0.8 14.1 2.35 5.2 0.41 0.7 0.87 0.3
P1 / P3l 0.8 17.1 2.85 5.2 0.57 0.7 0.92 0.3
P2a / P3 1.4 10.5 1.75 0.9 0.42 0.8 0.87 0.1
P2a / P3l 1.5 13.5 2.25 1.5 0.58 0.8 0.92 0.2
P2b / P3 1.4 11.7 1.95 0.9 0.47 0.8 0.88 0.1
P2b / P3l 2.0 14.7 2.45 1.0 0.66 0.9 0.93 0.1
technologies for communication (Mayer, 2012). For
instance, the combination of infrastructure-based (e.g.
Cellular, WiFi in access-point mode, LoRaWAN) and
infrastructure-free (e.g. WiFi in ad-hoc mode) tech-
nologies multiplies communication opportunities, es-
pecially in environments with unreliable communica-
tion.
The combined-path analysis introduced in this
subsection allows to combine process paths realized
by different communication technologies to enhance
robustness of a process. The analysis is inspired by
maximum-flow algorithms of network graphs such as
(Ford and Fulkerson, 2009) and (Dinic, 1970), finding
the maximum amount of flow able to be transferred
from a source to a sink in a capacity-restricted net-
work. While robustness graphs already represent net-
work graphs, maximum-flow algorithms are not ap-
plicable here. Robustness graphs do not use capacity-
labeled edges required by the algorithms, but edge
weights based on estimated connectivity or probabil-
ities. The meaning of edge weights is not equiva-
lent and application of maximum-flow algorithms will
not necessarily result in enhanced robustness. For
instance, a combination of non-robust connectivity
weights of different paths does not result in a robust
path. However, the maximum-flow principle may be
adapted for robustness as shown subsequently. Pre-
requisite for using a combined-path analysis on a ro-
bustness graph is to only include separate path seg-
ments that use different communication technologies
compared to each other.
Figure 16 illustrates the use of different technolo-
gies to communicate with participants in Ex2 with
probability edge weights. A combination of paths
is possible for segments Ex2 → T3 and T3 → T4.
Combining m different paths to a joint edge P
je
be-
tween separation points results in summarizing the
probabilities of each separate path, as illustrated by
Equation 2.
P
je
= min
m
∑
j=1
n
j
∏
i=1
P
e
j,i
, 1
!
(2)
P1
T3
1.0
Ex2
0.7
P2a
0.8
P2b
0.9
Ex2'
P3
0.8
P3l
1.0
T4 P4
0.90.9
0.9
0.9
0.9
1.0
Cellular
Locally
LoRaWAN
WiFi
Ad-Hoc
moved functionality
Figure 16: Enhancing robustness by combining communi-
cation technologies.
Ex2 T3
1.0
Ex2'T4
1.0
P4
0.9 0.9
Figure 17: Summarized robustness of different communi-
cation technologies.
Consequently, a graph with combined segments as
shown by Figure 17 is created. The summarized val-
ues for Ex2 → T3 (2.23) and T3 → T4 (1.72) have
been limited to 1 by Equation 2, since probability
edge weights P
e
> 1 are not allowed (cf. Table 3).
Based on the combined graph, other metrics such
as the path probability P
p
and the path robustness
level P
l
may be applied to evaluate effectiveness
of path combinations. For instance, evaluation of
the path probability P
p
of the most robust path of
Figure 16 (including P2b and P3l) and the individ-
ual path of Figure 17 illustrates an enhancement from
P
p
F16
= 0.66 to P
p
F17
= 0.81.
When using the combined-path analysis on graphs
with estimated connectivity weights, calculation of a
combined path segment is based on Equation 3. The
calculation summarizes the average weight of every
path segment to a joint edge weight R
je
. Combina-
tions need to be done carefully, since the joint weight
R
je
might not indicate that path segments may include
a weak or unstable edge (cf. Ex2 → P1 → T3 in Fig-
ure 12). The robustness level R
l
of the different paths
may help to identify the number of non-robust paths.
R
je
=
m
∑
j=1
∑
n
j
i=1
R
e
j,i
n
j
!
(3)
6 DISCUSSION
The presented graph-based approach proves to be able
to identify and rank robust paths in a process. Using
the approach, process robustness may be verified at
design time and optimized during runtime. The in-
troduced metrics and methods for the application of
graph edge weights allow to design the robustness
analysis flexible and use-case-oriented.
Creating robustness graphs is guided by process-
to-graph transition rules. While the transition is ex-
plicit for most process elements, certain elements re-
quire context information to be translated automati-
cally. Integrating segments of other participants / sub-
processes as subgraphs allows to completely influence
the process path according to robustness demands.
A Graph-based Approach for Process Robustness in Unreliable Communication Environments
105

Depending on the objectives of the robustness
analysis and the available connectivity knowledge,
edge weights based on connectivity estimations or
based on probabilities may be used. Additional con-
nectivity knowledge may be gained by using process
mining techniques (Van Der Aalst, 2011) on past pro-
cess data (event logs).
If robust process paths shall be found and ranked,
connectivity estimations should be applied as edge
weights. Likewise, integrating a connectivity safety
margin to compensate differences between estima-
tions and real-world connectivity requires to use es-
timated weights. However, estimated connectivity
weights require detailed knowledge or statistics about
the scenario’s connectivity. If limited knowledge
or only simple connectivity statistics exist, robust-
ness probabilities might be the right choice as edge
weights. Furthermore, probability edge weights are
not subjected to over-weighting and are perfectly suit-
able for combined-path analyses.
Evaluation of graph-based search algorithms indi-
cates that the application of shortest-path / longest-
path algorithms may not be optimal due to their fo-
cus on total weight. A promising choice is the all-
path analysis combined with a use-case-driven selec-
tion of appropriate robustness metrics. Most scenar-
ios may operate well by focusing on a preferably high
robustness of the weakest element of the path (path
robustness level R
l
) or a high path probability P
p
. If
accuracy of edge weights is uncertain or weight val-
ues change rapidly due to scenario-related circum-
stances (e.g. at runtime), utilization of the maximum-
step heuristic is considerable. Finally, in scenar-
ios featuring different communication technologies, a
combined-path analysis may optimize robustness by
combining process paths. A graph preparation (e.g.
limiting maximum edge weight, removing edges not
fulfilling required robustness) has shown to be useful
prior to analysis.
7 CONCLUSION
Operation of processes taking place in unreliable
communication environments is exposed to the risk of
intermittent or failing connectivity, resulting in pro-
cess interruptions or complete break downs. While
rBPMN provides extensions to support robust process
modeling in BPMN, mechanisms and metrics to ver-
ify and optimize robustness of an entire process are
missing.
This paper introduces a graph-based approach to
identify the most robust configuration of a process re-
garding the applied use case. Process-to-graph transi-
tion rules for BPMN and rBPMN process elements al-
low to automatically generate robustness graphs. Ro-
bustness metrics based on connectivity estimations
and alternatively based on probabilities allow finding
robust process paths and to rank their robustness.
As illustrated by process examples, shortest-path
and longest-path algorithms may not identify the most
robust process configuration. An all-path graph anal-
ysis using metrics for the path robustness level and
the path robustness probability is a promising choice
for most scenarios. An additional combined-path
analysis may enhance robustness by combining paths
which use different communication technologies.
ACKNOWLEDGEMENTS
The presented work is part of the OPeRAte project
(OPeRAte, 2019). OPeRAte is supported by funds
of the Federal Ministry of Food and Agriculture
(BMEL) based on a decision of the Parliament of the
Federal Republic of Germany via the Federal Office
for Agriculture and Food (BLE) under the innovation
support program.
REFERENCES
Bellman, R. (1958). On a routing problem. Quarterly of
applied mathematics, 16(1):87–90.
Bocciarelli, P. and D’Ambrogio, A. (2011). A BPMN
extension for modeling non functional properties of
business processes. In Proceedings of the 2011 Sym-
posium on Theory of Modeling & Simulation, pages
160–168. Society for Computer Simulation Interna-
tional.
Bocciarelli, P., D’Ambrogio, A., Giglio, A., and Paglia, E.
(2014). Simulation-based performance and reliabil-
ity analysis of business processes. In Proceedings of
the 2014 Winter Simulation Conference, pages 3012–
3023. IEEE Press.
Bocciarelli, P., D’Ambrogio, A., Giglio, A., and Paglia,
E. (2017). A BPMN extension for modeling cyber-
physical-production-systems in the context of Indus-
try 4.0. In 14th International Conference on Network-
ing, Sensing and Control (ICNSC), pages 599–604.
IEEE.
Braun, R. and Esswein, W. (2014). Classification of
domain-specific BPMN extensions. In IFIP Working
Conference on The Practice of Enterprise Modeling,
pages 42–57. Springer.
Ceballos, H. G., Flores-Solorio, V., and Garcia, J. P. (2015).
A probabilistic bpmn normal form to model and ad-
vise human activities. In International Workshop
on Engineering Multi-Agent Systems, pages 51–69.
Springer.
ENASE 2020 - 15th International Conference on Evaluation of Novel Approaches to Software Engineering
106

Chiu, H.-H. and Wang, M.-S. (2013). A study of IoT-aware
business process modeling. International Journal of
Modeling and Optimization, 3(3):238.
Dijkman, R., Dumas, M., and Garc
´
ıa-Ba
˜
nuelos, L. (2009).
Graph matching algorithms for business process
model similarity search. In International confer-
ence on business process management, pages 48–63.
Springer.
Dijkman, R. M., Dumas, M., and Ouyang, C. (2007). For-
mal semantics and automated analysis of bpmn pro-
cess models. preprint, 7115.
Dinic, E. A. (1970). Algorithm for solution of a problem of
maximum flow in networks with power estimation. In
Soviet Math. Doklady, volume 11, pages 1277–1280.
Domingos, D., Resp
´
ıcio, A., and Martinho, R. (2016). Us-
ing resource reliability in BPMN processes. Procedia
Computer Science, 100:1280–1288.
Domingos, D., Resp
´
ıcio, A., and Martinho, R. (2020). Re-
liability of IoT-aware BPMN healthcare processes. In
Virtual and Mobile Healthcare: Breakthroughs in Re-
search and Practice, pages 793–821. IGI Global.
Even, S. (2011). Graph algorithms. Cambridge University
Press.
Fall, K. (2003). A delay-tolerant network architecture for
challenged internets. In Proceedings of the 2003 con-
ference on Applications, technologies, architectures,
and protocols for computer communications, pages
27–34. ACM.
Ford, L. R. and Fulkerson, D. R. (2009). Maximal flow
through a network. In Classic papers in combina-
torics, pages 243–248. Springer.
Gounaris, A. (2016). Towards automated performance op-
timization of bpmn business processes. In East Euro-
pean Conference on Advances in Databases and In-
formation Systems, pages 19–28. Springer.
Graja, I., Kallel, S., Guermouche, N., and Kacem, A. H.
(2016). BPMN4CPS: A BPMN extension for mod-
eling Cyber-Physical Systems. In 25th International
Conference on Enabling Technologies: Infrastructure
for Collaborative Enterprises (WETICE), pages 152–
157. IEEE.
Martinho, R. and Domingos, D. (2014). Quality of informa-
tion and access cost of IoT resources in BPMN pro-
cesses. Procedia Technology, 16:737–744.
Martinho, R., Domingos, D., and Resp
´
ıcio, A. (2016). Eval-
uating the reliability of ambient-assisted living busi-
ness processes. In ICEIS (2), pages 528–536.
Mayer, C. P. (2012). Hybrid Routing in Delay Tolerant Net-
works. KIT Scientific Publishing.
Mazzola, L., Kapahnke, P., Waibel, P., Hochreiner, C.,
and Klusch, M. (2017). FCE4BPMN: On-demand
QoS-based optimised process model execution in the
cloud. In 2017 International Conference on Engineer-
ing, Technology and Innovation (ICE/ITMC), pages
305–314. IEEE.
Meyer, S., Ruppen, A., and Magerkurth, C. (2013). In-
ternet of Things-aware process modeling: integrating
IoT devices as business process resources. In Interna-
tional Conference on Advanced Information Systems
Engineering, pages 84–98. Springer.
Nordemann, F., T
¨
onjes, R., and Pulverm
¨
uller, E. (2020).
Resilient BPMN: Robust process modeling in unre-
liable communication environments. In 8th Interna-
tional Conference on Model-Driven Engineering and
Software Development (MODELSWARD). Scitepress.
OMG (2011). Object Management Group: Business Pro-
cess Model and Notation (BPMN) 2.0 Specification,
www.omg.org/spec/BPMN/2.0/About-BPMN (2019-
09-03).
OPeRAte (2019). Osnabrueck University of Ap-
plied Sciences: OPeRAte research project,
http://operate.edvsz.hs-osnabrueck.de (2019-09-
03).
Pelusi, L., Passarella, A., and Conti, M. (2006). Oppor-
tunistic networking: data forwarding in disconnected
mobile ad hoc networks. IEEE Communications Mag-
azine, 44(11):134–141.
Resp
´
ıcio, A. and Domingos, D. (2015). Reliability of
BPMN business processes. Procedia Computer Sci-
ence, 64:643–650.
Sedgewick, R. and Wayne, K. (2011). Algorithms.
Addison-Wesley Professional, 4th edition.
Sungur, C. T., Spiess, P., Oertel, N., and Kopp, O. (2013).
Extending BPMN for wireless sensor networks. In
2013 IEEE 15th Conference on Business Informatics,
pages 109–116. IEEE.
Tarjan, R. (1972). Depth-first search and linear graph algo-
rithms. SIAM journal on computing, 1(2):146–160.
Van Der Aalst, W. (2011). Process mining: discovery,
conformance and enhancement of business processes,
volume 2. Springer.
A Graph-based Approach for Process Robustness in Unreliable Communication Environments
107
