
Using BERT and Semantic Patterns to Analyze Disease Outbreak
Context over Social Network Data
Neelesh Rastogi and Fazel Keshtkar
St. John’s University, 8000 Utopia Pkwy, Queens, New York 11439, U.S.A.
Keywords:
Social Network Streams, Classification, Neural Networks, BERT, Word Embedding, Topic Modelling,
Emergency Response, Sentiment Analysis, Disease Ontology.
Abstract:
Predicting disease outbreaks has been a focus for various institutions and researchers for many years. How-
ever, any models that seemed to get close to resolve this issue have failed to predict potential outbreaks with
accuracy over time. For leveraging the social media data effectively, it is crucial to filter out noisy information
from the large volume of data flux so that we could better estimate potential disease outbreaks with growing
social data. Not satisfied with essential keyword-based filtration, many researchers turn to machine learning
for a solution. In this paper, we apply deep learning techniques to address the Tweets classification problem
concerning disease outbreak predictions. To achieve this, we curated a labeled corpus of Tweets that reflect
different types of disease-related reports, showcasing diverse community sentiment and varied potential us-
ages in emergency responses. Further, we used BERT, a word embedding and deep learning method to apply
transfer learning against our curated dataset. Applying BERT showed that it performs better in comparable
results to Long short-term memory (LSTM) and outperforming the baseline model on average in terms of
accuracy and F-score.
1 INTRODUCTION
Social media over the past years has increased the po-
tential of how information is collected and analyzed
over time, as the data grows (Collier and Doan, 2012).
Researchers to date have been leveraging such a plat-
form to aggregate and find patterns in community be-
havior, information retrieval, sentiment analysis, out-
break detection, and damage assessment (Keshtkar
and Inkpen, 2009). A foundation that guarantees the
success of all these tasks is an (or some) effective fil-
tering technique(s) that could filter out noisy infor-
mation carried by the data stream and cream off those
messages containing rich information about such an-
alytical patterns (Lampos and Cristianini, 2010).
This study intends to examine such data, espe-
cially tweets, for modeling a disease-related outbreak
detection system. Our model allows users to monitor
and estimate potential disease-outbreaks within a se-
lected area (NYC). The model pipeline illustrated in
Figure 1 describes our process of identifying tweets
as personal, news, or disease-related and further uti-
lizes a combination of natural language processing
techniques, machine learning algorithms, and deep
learning models to determine features, patterns, top-
ics, word embedding, and other linguistics patterns.
We then conducted various analyses, such as; Iden-
tifying language models, Document-based Cluster-
ing, Spam Classification, Tf-idf, Word2Vector, Topic
Modeling (LDA), and finally creating BERT Classifi-
cation Model for Sickness Related Tweets.
At the first glance, we investigated that many
tweets on just simple keyword-based streaming col-
lected many noise-related tweets like news articles,
retweets, known-sickness-related health mentions,
and so on so forth. So to obtain relevant tweets out
of our noisy streams, we applied spam filtration, clas-
sified tweets for importance and then applied different
preprocessing techniques and analysis to identify suit-
able features and patterns, to further train and hyper-
tune our sickness related tweets classification model.
(Saeed et al., 2019)
Post model creation, we obtain a unique cor-
pus of tweets, which are health and sickness-related,
showing interesting patterns. Based on our collected
and processed corpus, we investigated that our fi-
nal Tweets based disease distribution obtained a very
close correlation (0.983) with the best model pub-
lished by CDC for the 2012-13 flu season (Shah,
2017).
854
Rastogi, N. and Keshtkar, F.
Using BERT and Semantic Patterns to Analyze Disease Outbreak Context over Social Network Data.
DOI: 10.5220/0009375908540863
In Proceedings of the 13th International Joint Conference on Biomedical Engineering Systems and Technologies (BIOSTEC 2020) - Volume 5: HEALTHINF, pages 854-863
ISBN: 978-989-758-398-8; ISSN: 2184-4305
Copyright
c
2022 by SCITEPRESS – Science and Technology Publications, Lda. All rights reserved

Our model identified various pattern in unique
term usage within sickness-related tweets, for exam-
ple, most frequent keywords found within our cor-
pus hinted towards the measles outbreak in the year
2012 and locality-wide sickness in general (Collier
and Doan, 2012). Most frequent keywords included
terms such as; hope, better, got, flu, feel, sick, allergy,
chicken, vaccine. In other findings, we investigated
most trigrams patterns, such as: ‘I, got, measles,’
‘chickenpox measles,’ ‘got, chicken, pox,’ ‘think, got,
measles.’ and so forth.
Another interesting pattern that we investigated
using the Word2vector model and t-SNE visualiza-
tion was that the term ‘sick’ represented itself as the
center of the network and was closely surrounded by
frequent terms such as health, elderly, mentally, dirt,
chicken, and hospital, among others. Seeing this as a
suitable feature we also enabled this as a visual fea-
ture within our system’s dashboard to allow user to
visualize any related word in the tweet, and visualize
all the surrounded patterns. (Wang et al., 2017)
Using sentiment analysis; we used the positive,
negative and neutral sentiment to identify further if
the tweet present within our corpus of sick and health
tweets convey negative and neutral sentiment so it
may act as a cross measure to confirm the tweet as
a suitable document for disease intent.
Lastly, in time series analysis, called temporal
analysis; we identified total 104,293 sickness and
health-related tweets from New York area itself,
where the weekly number of tweets indicated that dis-
ease symptoms were strongly correlated with weekly
CDC ILI outpatient counts from October 2012 - May
2013 (r = 0.93; p <0.001) (Aramaki et al., 2011).
Other findings and analysis were also observed within
our conducted EDA Reports as well.
This paper is organized in following sections:
Section 2 describes different datasets collected for the
study. Section 3 describes the methods utilized for
data preprocessing. Section 4 explains our method-
ology and how models are curated. Section 5 explain
obtained results of classification, clustering, and other
analysis.
2 DATA ACQUISITION
For our study we curated a unique collection of
datasets from various sources for measuring accuracy
against ground truth values as well as a streaming col-
lection of 1.2 Million unique tweets from New York
City (NYC) Region.
2.1 CDC Dataset
To curate our ground truth dataset, we utilized the data
published by Epidemiology and Prevention Branch in
the Influenza Division at the Centers for Disease Con-
trol (CDC), where they collect, compile and analyze
information on influenza related activity year-round
in the United States and produce FluView, a weekly
influenza surveillance report, and FluView Interac-
tive, which allows for more in-depth exploration of in-
fluenza and flu related surveillance data across states
(Cooper et al., 2015).
Information gathered within these published data
dumps on CDC site marks information within five cat-
egories from eight different data sources, such as:
• when and where influenza and sickness related ac-
tivity is occurring.
• Track influenza-related and flu related illness
cases.
• Determine what type of viruses are circulating
within states.
• Measure the impact influenza and other viruses
have on hospitalizations and deaths.
Based on these data sources the following data
was extracted, transformed and loaded (ETL) within
our environment for validating results:
2.1.1 ILI Net Data
ILINet consists of more than thirty five hundrred en-
rolled outpatient healthcare providers in all 50 states,
Puerto Rico, the District of Columbia and the U.S.
Virgin Islands reporting more than 47 million patient
visits each year (Wang et al., 2017). Each week, ap-
proximately two thousand and two hundred outpatient
healthcare providers around the country report data to
CDC on the total number of patients seen for any rea-
son and the number of those patients with influenza-
like illness (ILI) by age group (0-4 years, 5-24 years,
25-49 years, 50-64 years, and >65 years) (Collier and
Doan, 2012).
Baseline levels for flu activity are calculated using
this data both nationally and for each region. Percent-
ages at or above the baseline level are considered el-
evated and thus a potential outbreak. This baseline is
used as our threshold.
2.1.2 WHO Data / NREVSS Data
Data collection from both the U.S. World Health
Organization (WHO) Collaborating Laboratories and
National Respiratory and Enteric Virus Surveillance
System (NREVSS) laboratories began during the
Using BERT and Semantic Patterns to Analyze Disease Outbreak Context over Social Network Data
855

1997-98 season (Ji et al., 2013). The volume of tested
specimens has greatly increased during this time due
to increased participation and increased testing. Dur-
ing the 1997-98 season 43 state public health labora-
tories participated in surveillance, and by the 2004-05
season all state public health laboratories were partic-
ipating in surveillance (Lamb et al., 2015). The ad-
dition of NREVSS data during the 2000 season on-
wards roughly doubled the amount of virologic data
reported each week.
The number of specimens tested and percentage
positive rate vary by region and season based on dif-
ferent testing practices including triaging of speci-
mens by the reporting labs, therefore it is not appro-
priate to compare the magnitude of positivity rates or
the number of positive specimens between regions or
seasons. (Long-Hay et al., 2019)
To avoid such bias in our ground truth dataset, this
data source was also used in addition to the ILI Net
data as a filter to generate a better and more accurate
Annual Curve Series of our ground truth values.
2.2 Twitter Historic Data Stream
This tweet dataset was acquired via Full-Archive
Search (FAS) Closed Enterprise Twitter API used by
Prof. Xiang Ji and Prof. James Geller at New Jersey
Institute of Technology, and Dr. Soon Chun at City
University of New York - College of Staten Island, as
part of their research. (Ji et al., 2013)
Within their paper on page 2, authors describe
their dataset and mention that they keep a track of 4
twitter API key-word based streams which gathered
unique tweets (no retweets) from New York area for
2 bacterial based diseases, listeria and Tuberculosis
respectively, and, two viral diseases chickenpox and
measles. For an easier accessibility to their dataset,
on an approved request, their dataset was shared and
is now stored within our MySQL DB instance. We
utilize these collected tweet datasets as a data input
for analyzing and understanding a unique pipeline for
detecting NLP patterns and clues for further predict-
ing potential outbreaks.
The acquired dataset has following components:
• listeria related tweets: 49023 tweet count (2011-
10-18 to 2012-4-6) and (2012-5-10 to 2012-11-
30)
• measles related tweets: 88205 tweet count (2011-
10-18 to 2012-4-6) and (2012-5-10 to 2012-11-
30)
• swine-flu related tweets: 284,531 tweet count
(2011-10-18 to 2012-4-6) and (2012-5-10 to
2012-11-30)
• tuberculosis related tweets: 167,380 tweet count
(2011-10-18 to 2012-4-6) and (2012-5-10 to
2012-11-30)
2.2.1 ATAM Twitter Historic Data
This tweet dataset was curated by M. Paul and M.
Dredze, during their study (Paul et al., 2017). This
dataset collection includes the set of tweets used as in-
put for training Ailment Topic Aspect Model (ATAM)
for tweets which further allowed them to identify and
tag named entities associated with ailments and sick-
ness and their symptoms (Paul et al., 2017). We uti-
lized their training dataset along with our previous
FAS collected corpus to further generate a smoother
time series dataset for generating a ILI based Tweet
frequency curve for sickness related tweets.
The tweets used in their study was streamed using
a keywords text file which contains a total of two hun-
dred and fifty six health-related keywords describing
the names of diseases, symptoms, and treatments and
medications (Paul et al., 2017). These keyword lists
are used to create input for ATAM (which requires
phrases to be labeled as symptoms or treatments), and
also to initially filter our dataset when constructing
our health classifiers.
Based on above keyword streams their dataset
was further organized in two columns for distribution
where first column represented unique tweet IDs and
the second column indicated the ailment ID for the
ailment sampled for that tweet.
The dataset being rather large for API query rate
limit only Tweet ID was provided which through
tweet hydration process (Paul et al., 2017) was further
successfully retrieved, processed and loaded within
our twitter dataset leading to a total final count of two
million four hundred and seventy-five thousand, two
hundred and seventy-two tweets.
2.3 Twitter Spam Annotation
As in all social networks, spam messages drastically
increase distribution noise and provide no saliency
when generating the ILI distribution (Aramaki et al.,
2011). In this study, we consider as spam all tweets
that do not refer to disease.
To achieve this we used a pre-labeled health
tweets annotations dataset, of 5000 tweets which was
tagged using Amazon’s Mechanical Turk, as pro-
duced by Michael J. Paul and Mark Dredze, during
their research at Johns Hopkins University (Paul et al.,
2017). The annotations as described on page 2 of their
paper, label tweets as they relate to health.
For our use case we utilized above dataset to place
tweets in one of the five categories, and that each indi-
Cognitive Health IT 2020 - Special Session on Machine Learning and Deep Learning Improve Preventive and Personalized Healthcare
856

Table 1: Spam Annotation Tags and Label Index.
tags label
health 0
notenglish 1
notsure 2
sick 3
unrelated 4
vidual tweet must reside in a given category. We only
took into account self-reported tweets in our pipeline;
in this process, we eliminate anomalies in our gener-
ated curve due to mass media coverage of rare dis-
eases (Lampos and Cristianini, 2010). We addition-
ally distinguish individuals who have a disease from
those who are worried about another’s ailments, with
the former affecting the resultant distribution.
The annotations proposed in the study, label
tweets for if as they relate to person talking about
their sickness, health-information or not. The labels
which were used to tag tweets as important vs spam
are shown in Table 1.
For current study, we trained an SVM Model us-
ing linear kernel over n-grams for 1-3 tokens to pre-
dict the tags on our 2 million tweet corpora, we ob-
tained total of 135,547 tweets which were sickness
and health related and the rest were marked as spam
with an accuracy of 0.983. After obtaining sickness
and health related tweets, we conducted feature en-
gineering processes to build our outbreak prediction
pipeline. The process of how this predication model
was curated and it’s results are explained more pre-
cisely in section 4 of this paper.
3 PREPROCESSING AND
FEATURE SELECTION
3.1 UTF-8 Unicode-encoding
All tweets over loading within SQL Database with
UTF-8 encoding, many tweets retained it’s original
form, but when retrieved within our analysis pipeline
even though the tweets were intact, by observing at
some randomly selected entries, we observed strange
patterns of characters “\xef \xbf \xbd”, occurring
consistently over corpus, in exploratory analysis re-
port we discovered most of them represented encoded
emoji text, which is an essential aspect in addition to
identifying proper sentiment in modern text (Keshtkar
and Inkpen, 2009). So instead of discarding such in-
formation during format translation, we normalized
and decomposed tweet text for obtaining the original
tweet form. This process is commonly known as NF
(Normalization Form) + KD (Compatibility Decom-
position) (Keshtkar and Inkpen, 2009). We applied
this process over our tweets corpus with ASCII setting
and as a result we obtained proper tweets with intact
emoji text, preserved URLs, hashtags and mentions
with minimal special characters within our corpus.
3.2 Tokenization
Once we have cleaner pure tweets with no retweets,
we then applied tokenization methods: for this we
used a python based NLTK package’s Twitter-aware
tokenizer. This tokenizer is designed to be flexible
and easy to adapt to new domains and tasks. The ba-
sic logic follows that the tuple regex defines a list of
regular expression strings that are then put, in order,
into a compiled regular expression object where we
then apply tokenization where preserve case option is
set to be False enabling us to reduce the number of
duplicate tokens caused due to capitalization issue.
Once our tweet was tokenized with twitter aware
tokenizer, we noticed some inconsistencies still left
within our processed tweets like ’@’, ’http’, ’https’.
This was mainly due to the presence of weblinks
and mentions. To deal with such, we utilized a
third party, preprocessing package called “twitter-
preprocessor”. This preprocessor cleaned and parsed
tweets of, URLs, Hashtags, Mentions and Reserved
words (RT, FAV).
3.3 Stemming and Lemmatization
Before proceeding to analysis, it is suggested to have
more common terms within the corpora, to achieve
better vectors (Brownstein et al., 2010). We processed
our corpora further by stemming the words/tokens it-
self. To do this we used snowball stemmer as it’s
known to be better model for stemming documents
with more than one language. Once, with the stemmer
we trimmed our words for all the ending action words
like “-ing”, “-ed” or “-s”. Through this process, we
obtained the word’s pure dictionary form. But usu-
ally, when we stem words, we tend to lose the actual
meaning of the word itself, as the trim may happen
either too much or too less. So, to resolve this we
applied a WordNet Lemma trained on Google News
Corpus, which then converted our stemmed words to
its closest dictionary form.
Using BERT and Semantic Patterns to Analyze Disease Outbreak Context over Social Network Data
857
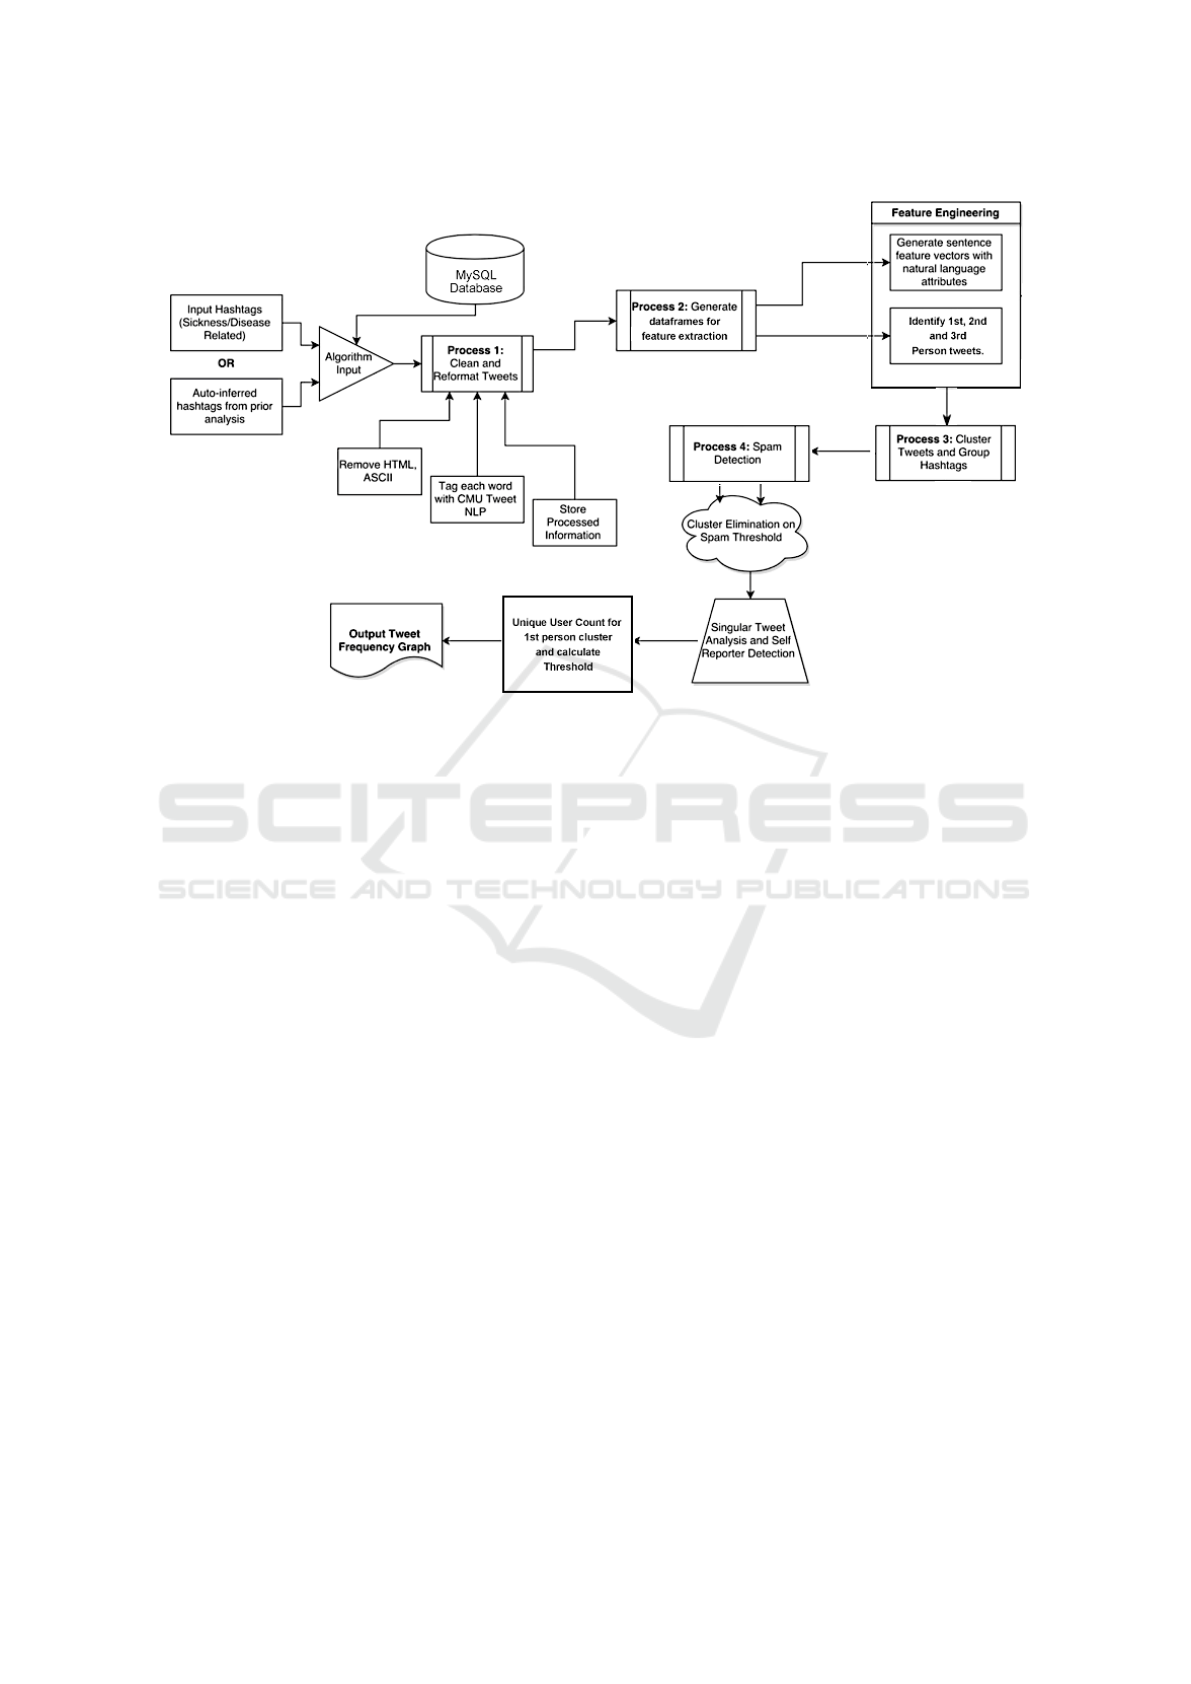
Figure 1: System flowchart for tweets pre-processing.
3.4 N-Grams
Once we obtained our sickness and health related
tweets post preprocessing, we first produced a fre-
quency distribution graph to find the most common
words and collections of words within our tweet cor-
pus. The results obtained from this are shown in Fig-
ure 2a and Figure 2b.
3.5 TF-IDF and Bag of Words
Once, done tokenizing, we performed a term-
frequency and inverse document frequency score on
our tweet corpus to identify top terms occurring to-
gether within our dataset. The following are some
terms which occurred most frequently together: hope,
better, got, flu, feel, sick, allergy, chicken, vaccine.
In Bag of words findings, we investigated most tri-
grams patterns repeating, such as: ‘I, got, measles,’
‘chickenpox measles,’ ‘got, chicken, pox,’ ‘think, got,
measles.’ and so forth.
3.6 Sentiment Polarity
VADER (Valence Aware Dictionary and sEntiment
Reasoner) is a lexicon and rule-based sentiment anal-
ysis tool that is specifically attuned to sentiments ex-
pressed in social media. This sentiment lexicon takes
care of emoji’s and as well as sentiment expressed via
slang keywords.
Some examples of term combinations detected as
score boosters within sentiment analysis done by this
package, including proper handling of sentences is:
• typical negations (e.g., “not good”) and use
of contractions as negations (e.g., “wasn’t very
good”)
• conventional use of punctuation to signal in-
creased sentiment intensity (e.g., “Good!!!”) and
word-shape to signal emphasis (e.g., using ALL
CAPS for words/phrases)
• Use of degree modifiers to alter sentiment inten-
sity (e.g., intensity boosters such as “very” and
intensity dampeners such as “kind of”)
• understanding many sentiment-laden slang words
as modifiers such as ‘wassup’ or ‘friggin’ or
‘kinda’ and many sentiment-laden emoticons such
as “:(” and “:/”
• translating utf-8 encoded emojis and sentiment-
laden initialisms and acronyms.
Out of all scores provided by this package we
used compound score to analyze tweet sentiment. The
compound score is computed by summing the valence
scores of each word in the lexicon, adjusted accord-
ing to the rules, and then normalized to be between -1
(most extreme negative) and +1 (most extreme pos-
itive). This is the most useful metric in our case
as it gives a single unidimensional measure of sen-
timent for a given sentence (Collier and Doan, 2012).
Cognitive Health IT 2020 - Special Session on Machine Learning and Deep Learning Improve Preventive and Personalized Healthcare
858
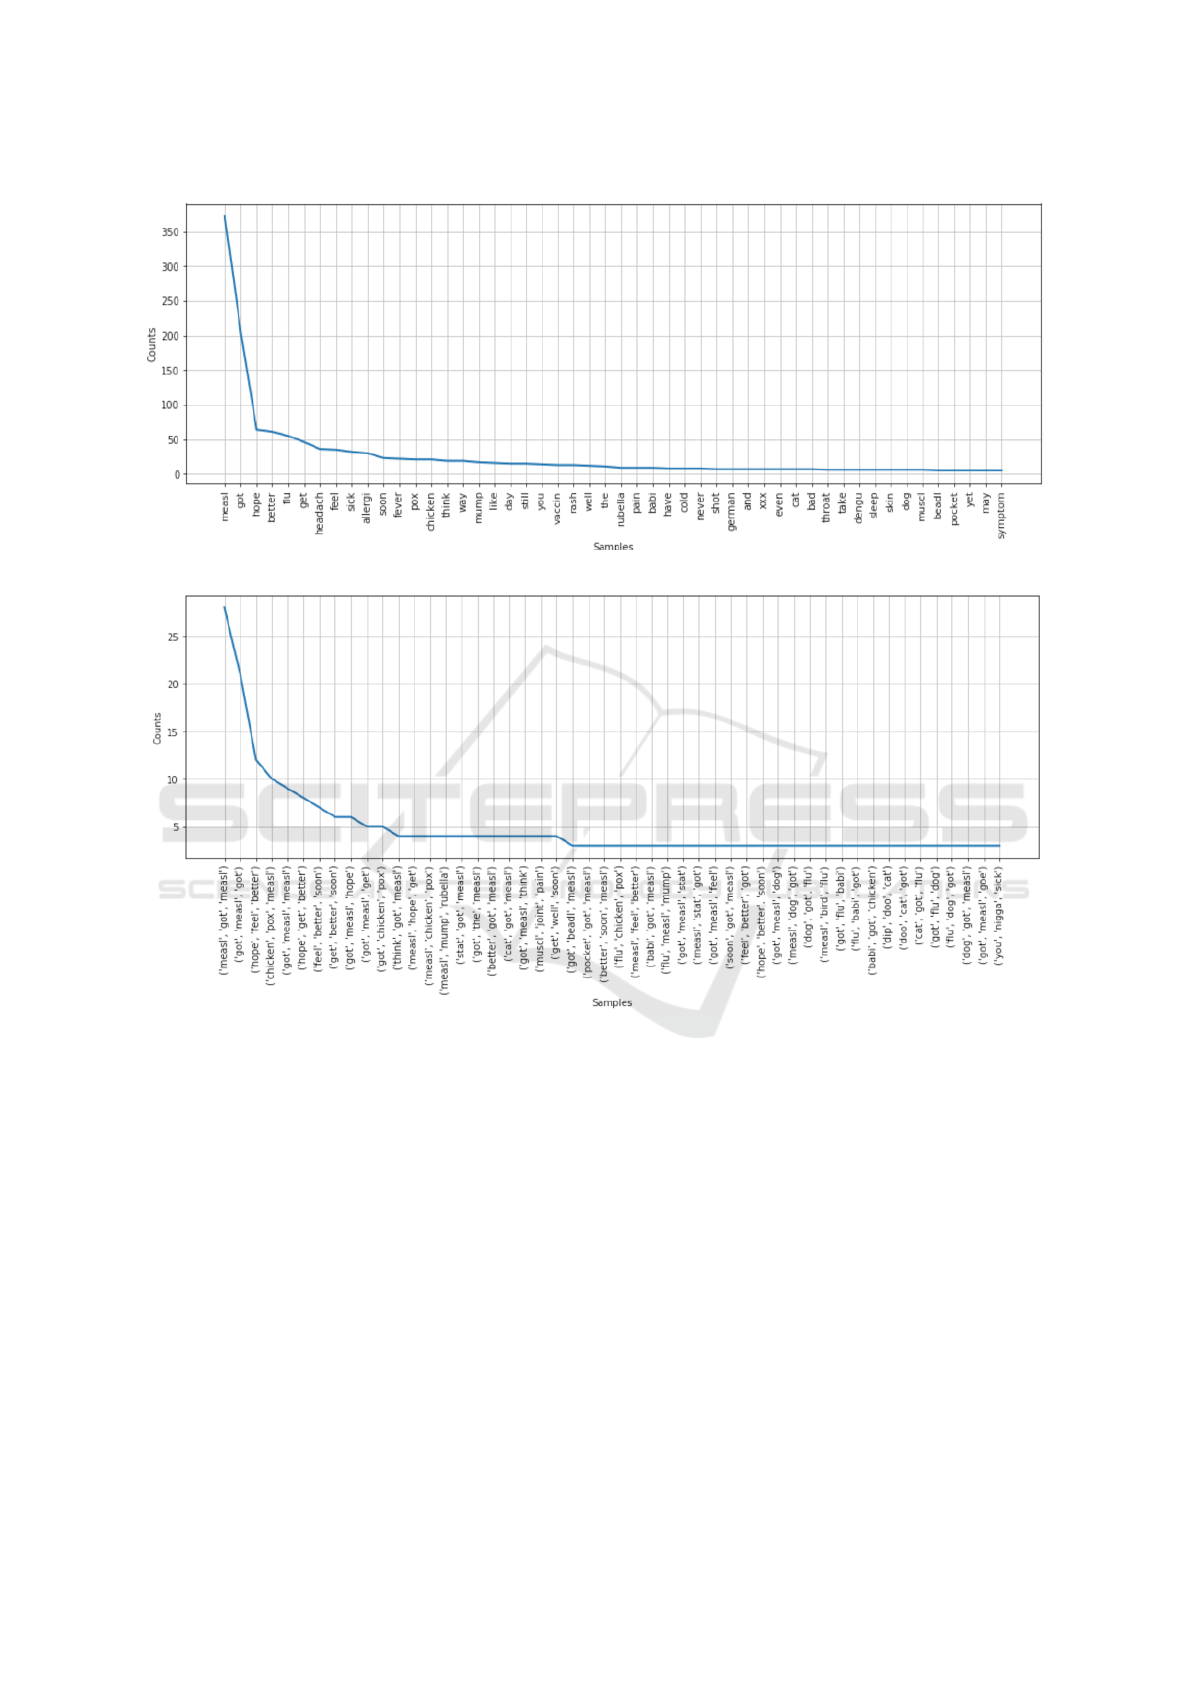
(a) Unigram Results
(b) Trigram Results
Figure 2: Term frequency charts (a, b), represents x axis as terms and y axis as each term’s frequency count.
Calling it a ‘normalized, weighted composite score’
(NWCS for short) is accurate. We set standardized
thresholds for classifying sentences as either posi-
tive, neutral, or negative. Typical threshold values for
grading sentiment labels are:
• positive sentiment: NWCS >= 0.05
• neutral sentiment: -0.05 <NWCS <0.05
• negative sentiment: NWCS <= -0.05
The positive, neutral, and negative scores are ra-
tios for proportions of text that fall in each category
(so these should all add up to be 1 or close to it with
float operation). We use the positive negative and neu-
tral sentiment to further identify if the tweet present
within our corpus of sick and health tweets convey
negative and neutral sentiment so it may act as a cross
measure to confirm the corpus as suitable document
for disease intent.
3.7 Part-Of-Speech (POS) Tags
In NLTK, POS functionality is present in a form of a
drop in tagger, that reads text in around all languages
for us mainly English and assigns parts of speech to
each word (and other token), such as noun, verb, ad-
jective, etc., as shown in Figure 4. We focus mainly
on pronouns and nouns to identify if the tweet is ini-
tiated by a 1st person, second person or 3rd person
Using BERT and Semantic Patterns to Analyze Disease Outbreak Context over Social Network Data
859
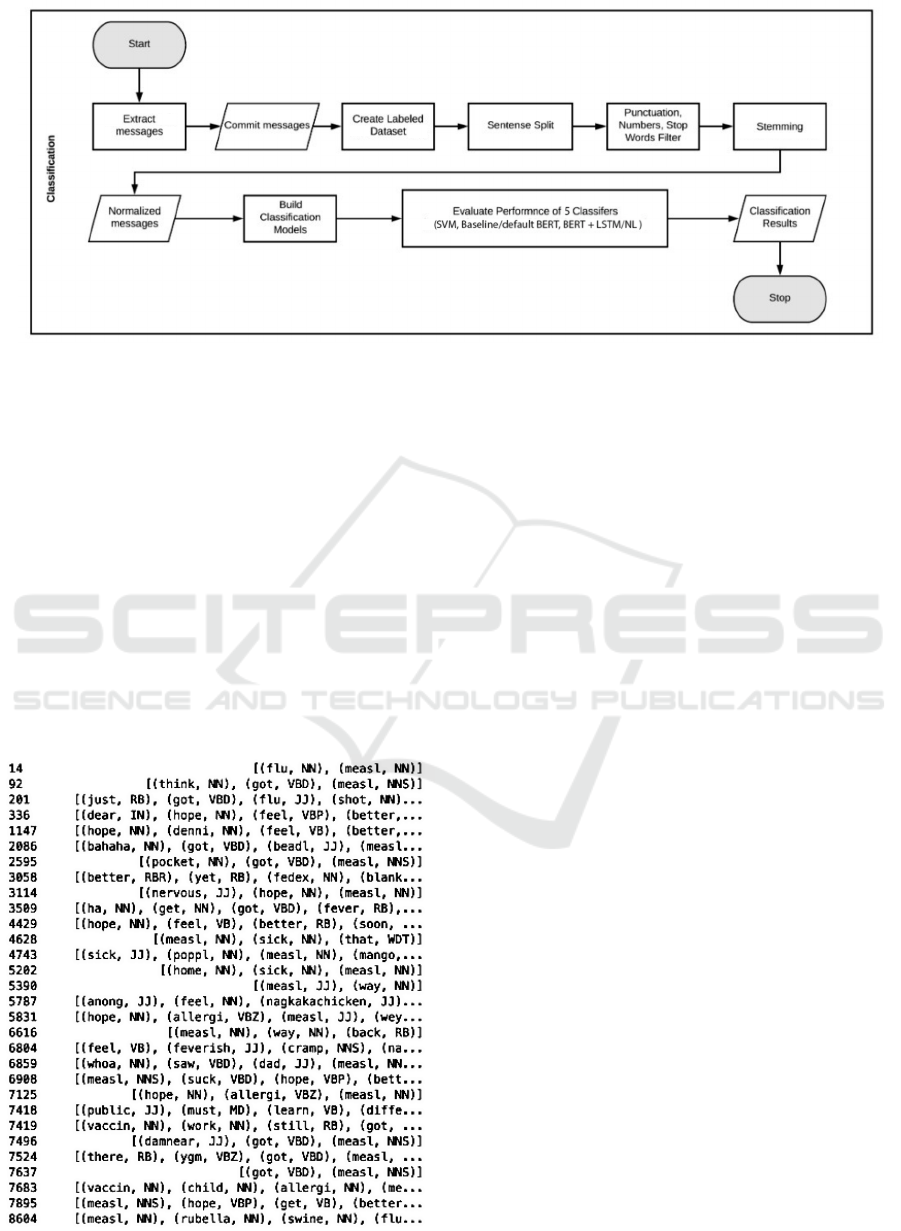
Figure 3: Classification Pipeline.
speech and use noun tags to identify, if the nouns
present within our corpus match with any Symptoms
and disease type so we may have an estimate to what
type of disease is highlighted predominantly within
our corpus (Collier and Doan, 2012).
3.8 Significant Tweet Isolation
Based on the processed tweet corpora and Euclidean-
cosine similarity measure we produce similar docu-
ments clusters, in which we systematically identify
our spam vs not spam tweets, then train, and apply
a linguistic attribute-based classifiers to randomly se-
lected subsets of each cluster, rejecting an entire clus-
Figure 4: Terms associated with their respective tags.
ter if its chosen subset contains a sufficiently large
number of non-sickness tweets.
3.9 Topic Modeling
As shown in Fig 5, with the use of LDA we iden-
tify the popular topics among each batch of remain-
ing tweets clusters allowing us to identify most talked
symptoms which further shows us information about
most common disease within the outbreak.
3.10 Outbreak Threshold
The outbreak baseline is provided by CDC each year
per region. As our stream checks for many influenza
like illnesses we utilized similar calculation methods
as cdc to calculate baseline threshold. As NYC falls
under Region 2 in CDC ILI Net Dataset, therefore
as per CDC the base line is 3.1% (New Jersey, New
York City, Puerto Rico, and the U.S. Virgin Islands).
The national percentage of patient visits to healthcare
providers for ILI reported each week is calculated by
combining state-specific data weighted by state pop-
ulation. This percentage is then compared each week
with the national baseline of 2.2%. As baseline is
compared in percentage, for us to convert our Tweets-
ILI Corpus distribution into baseline format we do
this by calculating the mean percentage of tweets for
a non-influenza time period and comparing it against
total number of tweets scraped for that season. A non-
flu or non-sickness week is defined as periods of two
or more consecutive weeks in which each week ac-
counted for less than 2% of the season’s total number
of specimens that tested positive for sickness in public
health laboratories (Blei et al., 2003).
Cognitive Health IT 2020 - Special Session on Machine Learning and Deep Learning Improve Preventive and Personalized Healthcare
860

Table 2: Evaluation metrics.
Model Accuracy Matthew’s coeff Macro precision Macro recall Macro F1
SVM-LinearSVC (5 k-fold) 0.63 - 0.62 (avg) 0.33 (avg) 0.36 (avg)
baseline BERT 0.71 0.56 0.58 0.6843 0.6071
default BERT 0.67 0.59 0.6043 0.7114 0.64
BERT+NL 0.67 0.59 0.6057 0.68 0.6314
BERT+LSTM 0.69 0.60 0.6129 0.6986 0.6400
4 RESULTS AND DISCUSSION
Figure 1 details our model pipeline to its fullest ex-
tent marking each relevant process. The pipeline ac-
cepts as input either a list of hashtags or auto-inferred
terms from prior analysis (determined via linguistic
term association). Our system then leverages the API
to stream twitter data and runs an in-depth uninfor-
mative tweet elimination to allow identification of
anomalies and unique disease outbreaks, thus provid-
ing predictive significance.
4.1 Tweet Clustering
Using the TF-IDF features ascertained in previous
step and a mixed Euclidean-cosine similarity mea-
sure, we cluster tweets according to minimal clus-
ter RSS value via the centroid-based k-means ap-
proach. Once our preprocessing and feature extrac-
tion was done, we wanted to identify topic clusters
for all tweets identified as health and sickness related
and see what topics were most common among our
tweet-corpus.
To achieve this we applied Latent Dirichlet Al-
location (LDA) over our clustered corpus to further
identify 1st Person Tweets and Health related tweets
to find topics and related words. This topic modelling
step gave us insights into understanding the specific
disease talk and also highlighted symptom informa-
tion further assisting us in nailing down a potential
outbreak disease name when compared against cur-
rent disease ontology (Mikolov et al., 2014). For ex-
ample, for the measles corpus topics as shown in Fig-
ure 5 were identified as significant.
4.2 SVM and BERT Classification
We used classification techniques to identify tweets as
either sickness or health related using Health Tweet
Annotation dataset. The flowchart diagram as shown
in Figure 3 overviews our comprehensive process of
cleaning up corpus and identifying a classifier with
maximum accuracy.
Post aggregating and preprocessing our the dataset
with the aforementioned health-tweet annotation and
spam filtration, we used our resultant corpus as train-
ing data to create a health tweet classifier for disease
related tweets. To compare our model, we use SVM
classifier with LinearSVC kernel and BERT along
with it’s other customized variations.
On further result comparison as shown in table
2, we investigated that the fine-tuned approach in
the paper of Devlin et al (Wang et al., 2017). and
BERT-based bidirectional LSTM achieved best per-
formance, boosting up 3.34% in terms of accuracy.
And F-1 as compared to results obtained via our Lin-
ear Kernel SVM model and other customized BERT
Variations.
The reason we choose BERT over other classi-
fiers, it has achieved state-of-art performance in many
NLP tasks. For baseline, we set up a bidirectional
LSTM with GloVe Twitter embeddings. These mod-
els are built based on the pytorch-pretrained-BERT
repository possessed by huggingface
1
. All the BERT
models are built upon BERT base uncased model,
which has 12 transformer layers, 12 self-attention
heads, and with a hidden size 768. The baseline
model is a single-layer bidirectional LSTM neural
network with hidden size 256. The model receives
pre-trained GloVe Twitter 27B embeddings (200d) as
input. The stacked final hidden state of the sequence
is linked to a fully connected layer to perform soft-
max.
4.3 Time Series Analysis
We subsequently plot the frequency distribution of
relevant tweets over time in order to compare our
model’s predicted health and sickness tweets upon the
CDC-ILI curve.
Our system when given 2012-2013 tweet dataset
which was known for a major measles outbreak dur-
1
https://github.com/huggingface/pytorch-pretrained-BERT
Using BERT and Semantic Patterns to Analyze Disease Outbreak Context over Social Network Data
861
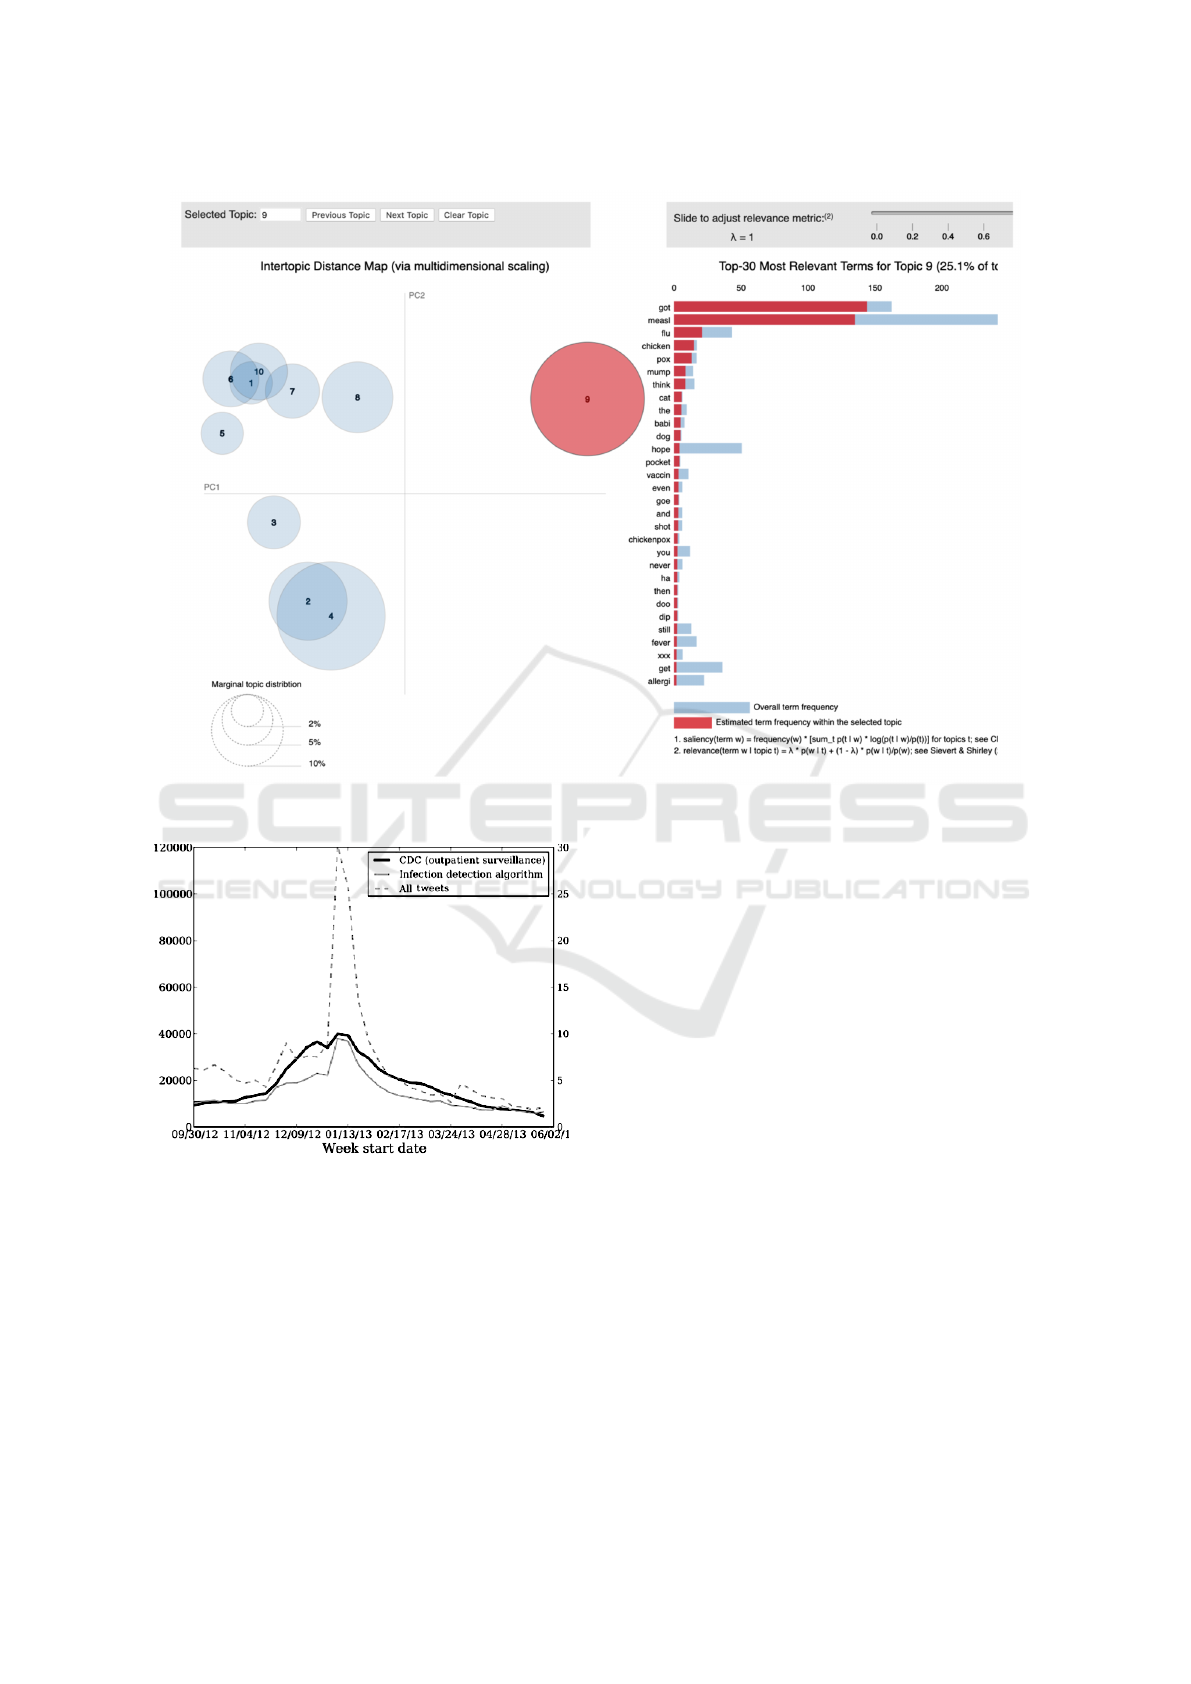
Figure 5: Prominent measles related topics in our corpus.
Figure 6: Tweets vs CDC ILI 2012.
ing those times; it identified 104,200 sickness and
health tweets from New York Area itself and the
weekly number of tweets indicating disease symp-
toms showed a strong correlation with weekly CDC
ILI outpatient counts from October 2012 - May 2013
(r = 0.93; p <0.001). The difference between these
correlations were also significant at the p<0.001
level.
The mean absolute error of the keyword-based es-
timates is 0.0102 after normalizing the weekly rates
sum to 1. The mean absolute error of our symptoms
in tweet estimates is 0.0046, a 45% reduction in error
over the keyword filter. The national estimates pro-
duced by our classification model alongside the CDC
rates is shown in Figure 6.
5 CONCLUSION
In this paper, we apply deep learning techniques, such
as BERT, LSTM and word embedding, to address the
Tweets classification for disease outbreak predictions.
We used a labeled corpus of Tweets that reflect differ-
ent types of disease-related reports. We used different
features, i.e, ngrams, Part-of-speech, TFIDF, to mea-
sure our analysis. As results, we investigated some
semantics patterns that users used in their tweet are
very relevant to disease outbreak, i.e, ‘I, got, measles,’
‘chickenpox measles,’ ‘got, chicken, pox,’ ‘think, got,
measles’. For future work, we plan to apply other
dataset related to other disease to compare with cur-
rent work.
Cognitive Health IT 2020 - Special Session on Machine Learning and Deep Learning Improve Preventive and Personalized Healthcare
862

REFERENCES
Aramaki, E., Maskawa, S., and Morita, M. (2011). Twitter
Catches The Flu: Detecting Influenza Epidemics us-
ing Twitter. In Proceedings of the 2011 Conference on
Empirical Methods in Natural Language Processing,
pages 1568–1576, Edinburgh, Scotland, UK. Associ-
ation for Computational Linguistics.
Blei, D. M., Ng, A. Y., and Jordan, M. I. (2003). Latent
Dirichlet Allocation. Journal of Machine Learning
Research, 3(Jan):993–1022.
Brownstein, J. S., Freifeld, C. C., Chan, E. H., Keller, M.,
Sonricker, A. L., Mekaru, S. R., and Buckeridge, D. L.
(2010). Information Technology and Global Surveil-
lance of Cases of 2009 H1n1 Influenza. New England
Journal of Medicine, 362(18):1731–1735.
Collier, N. and Doan, S. (2012). Syndromic Classification
of Twitter Messages. In Kostkova, P., Szomszor, M.,
and Fowler, D., editors, Electronic Healthcare, vol-
ume 91, pages 186–195. Springer Berlin Heidelberg,
Berlin, Heidelberg.
Cooper, G. F., Villamarin, R., Tsui, F.-C. R., Millett, N.,
Espino, J. U., and Wagner, M. M. (2015). A Method
for Detecting and Characterizing Outbreaks of Infec-
tious Disease from Clinical Reports. J Biomed Inform,
53:15–26.
Ji, X., Chun, S. A., and Geller, J. (2013). Monitoring public
health concerns using twitter sentiment classifications.
In 2013 IEEE International Conference on Healthcare
Informatics, pages 335–344.
Ji, X., Chun, S. A., and Geller, J. (2013). Monitoring Pub-
lic Health Concerns Using Twitter Sentiment Classi-
fications. In 2013 IEEE International Conference on
Healthcare Informatics, pages 335–344, Philadelphia,
PA, USA. IEEE.
Keshtkar, F. and Inkpen, D. (2009). Using sentiment ori-
entation features for mood classification in blogs. In
2009 International Conference on Natural Language
Processing and Knowledge Engineering, pages 1–6.
Lamb, A., Paul, M. J., and Dredze, M. (2015). Separating
Fact from Fear: Tracking Flu Infections on Twitter.
page 7.
Lampos, V. and Cristianini, N. (2010). Tracking the flu pan-
demic by monitoring the social web. In 2010 2nd In-
ternational Workshop on Cognitive Information Pro-
cessing, pages 411–416, Elba Island, Italy. IEEE.
Long-Hay, P., Yamamoto, E., Bun, S., Savuth, T., Buntha,
S., Sokdaro, S., Kariya, T., Saw, Y. M., Sengdoeurn,
Y., and Hamajima, N. (2019). Outbreak detection of
influenza-like illness in Prey Veng Province, Cambo-
dia: a community-based surveillance. Nagoya J Med
Sci, 81(2):269–280.
Mikolov, T., Yih, W.-t., and Zweig, G. (2014). Linguistic
Regularities in Continuous Space Word Representa-
tions. page 6.
Paul, M. J., Dredze, M., and University, J. H. (2017). You
Are What You Tweet: Analyzing Twitter for Public
Health. page 8.
Saeed, Z., Abbasi, R. A., Maqbool, O., Sadaf, A., Raz-
zak, I., Daud, A., Aljohani, N. R., and Xu, G. (2019).
What’s Happening Around the World? A Survey and
Framework on Event Detection Techniques on Twit-
ter. J Grid Computing, 17(2):279–312.
Shah, M. (2017). Disease Propagation in Social Networks:
A Novel Study of Infection Genesis and Spread on
Twitter. page 17.
Wang, C.-K., Singh, O., Tang, Z.-L., and Dai, H.-J. (2017).
Using a Recurrent Neural Network Model for Classi-
fication of Tweets Conveyed Influenza-related Infor-
mation. In Proceedings of the International Workshop
on Digital Disease Detection using Social Media 2017
(DDDSM-2017), pages 33–38, Taipei, Taiwan. Asso-
ciation for Computational Linguistics.
Using BERT and Semantic Patterns to Analyze Disease Outbreak Context over Social Network Data
863
