
From a Traditional Bicycle to a Mobile Sensor in the Cities
Pedro Nunes, Carlos Nicolau, Jos
´
e Paulo Santos and Ant
´
onio Completo
Department of Mechanical Engineering, University of Aveiro, Portugal
Keywords:
Connectivity Platform, Cloud Services, IoT.
Abstract:
The present study focuses on the development of a web cloud based connectivity platform to apply in the
context of cycling. One of the main challenges in using bicycle as mean of transportation is related to the
cyclists safety and risk perception. In response to that problem, we propose an IoT based module, that will be
embedded in the bicycle, allowing sensor data collection and real time sending to the connectivity platform.
The data will be used to perceive cyclists route choice preferences, give support to stakeholders either in
making new policies to promote bike use or to give cyclist suggestions about the most convenient route,
depending on his profile. The main objective is to transform a traditional bicycle into a mobile sensor in the
city. The connectivity platform will enable several services, so the bicycle can easily be integrated in a free
floating bike-sharing environment.
1 INTRODUCTION
The bicycle use as a means of transport is becom-
ing increasingly popular, especially for commuting
trips, as it avoids car congestion in large urban centers
(Lindsay et al., 2011). For some journeys, it may be
the fastest transport, because it allows avoiding long
stops due to car traffic. In addition, it is cheap, pro-
motes a reduction in pollutant emissions while con-
tributes to improve user’s health (Hsu et al., 2016).
However, there are some challenges associated with
cycling, being safety a major inherent concern. Ac-
cording to the annual report of the ANSR (National
Road Safety Authority), in 2018 there were 17 cy-
clists who were fatal victims on Portuguese roads,
114 seriously injured, 1984 being the total number of
victims that year. There are several reasons for this
worrying number, some of them are related to lack
of appropriate cycling infrastructure, misbehavior of
motor vehicle drivers, among others. In addition, for
a cyclist with a lack of knowledge of the surround-
ing cycling network, it is not easy to choose the most
suitable route.
The most reasonable decision for a beginner cy-
clist is to look for cycle paths or other cycling infras-
tructures, however, sometimes due to poor planning
the built infrastructures are not as safe as desirable.
The most common problems are the non-existence of
physical separation from motorized traffic, obstacles
as lamp posts in the middle of the track, or closure to
side parks (Dondi et al., 2011), who may cause haz-
ards, since the track may be obstructed by a parked
vehicle opened door.
For the reasons mentioned, more people would
consider using bicycle if they could use a bike route
planner (Akar and Clifton, 2009), however, the cre-
ation of a tool for cyclists requires a great diversity of
available data. Firstly, it requires the mapping of in-
frastructures that influence cyclist safety, such as the
existence of bike lanes, infrastructure characteristics
(Pucher and Buehler, 2008), slope, route singulari-
ties (Menghini et al., 2010) or traffic calming features
such as speed bumps (Buehler and Dill, 2016). On the
other hand, it requires some extra information, such as
the state of traffic or the state of infrastructure such as
bicycle lanes. This data is dynamic, since may occur
the infrastructure’s degradation, thus data should be
constantly updated.
This work is divided in six sections. In Section 2,
we will address the main motivations and objectives
of this work, while, in Section 3, we discuss some re-
lated work. In Section 4, the proposed methodology
and the created tool are shown in detail. In Section 5
are presented some results, while in Section 6 we con-
clude our work presenting new steps to accomplish.
Nunes, P., Nicolau, C., Santos, J. and Completo, A.
From a Traditional Bicycle to a Mobile Sensor in the Cities.
DOI: 10.5220/0009349700810088
In Proceedings of the 6th International Conference on Vehicle Technology and Intelligent Transport Systems (VEHITS 2020), pages 81-88
ISBN: 978-989-758-419-0
Copyright
c
2020 by SCITEPRESS – Science and Technology Publications, Lda. All rights reserved
81

2 OBJECTIVES AND
MOTIVATION
The objective of this study is to develop a new tool.
It intends to help stakeholders and policy makers
to decide the localization of new cycling infrastruc-
tures or identify infrastructures that need mainte-
nance. For other hand, it intends to facilitate cyclist’s
route choices, by joining several useful information
in the same tool. The main motivation for this topic
is the increasing need for sustainable means of trans-
port, which drives us to the necessity to create policies
that protect cyclists, and tools to help them making
the best decisions when using the road network. For
this purpose, we propose a cloud based platform, web
services, as well as an IoT system embedded in the bi-
cycle. It allows the data collection and real time send-
ing to the connectivity platform, thus the data could
be analyzed in order to determine cyclists route pref-
erences, pavement quality, detect car drivers misbe-
havior or places where the car traffic is heavier. With
these inputs, policy makers can perceive places where
infrastructures need maintenance or optimize new in-
frastructures location. At the same time, this platform
can work as a tool for cyclists, since the data can be
used as an input to a bike routing app or to give sug-
gestions to the cyclist as well.
When we think in data collection from bikes, we
usually think in bike sharing systems, however, the
proposed architecture is designed to be applied in any
bicycle, which includes personal bikes or bikes from a
bike-sharing system. The cloud services allow almost
any bike to be easily integrated in a free floating bike-
sharing system, because the IoT module allows the
bike to be remotely unlocked.
3 RELATED WORK
Some works related to bike instrumentation, data col-
lection and bike routing have been developed, in this
section we discuss some of them.
The concept of IoT has been applied in some stud-
ies to collect data from instrumented bicycles. For ex-
ample, (Grama et al., 2018) proposed an IoT solution
with multiple modules that could be replaced accord-
ing to cyclist needs. The modules have two main fea-
tures, the measurement of bicycle parameters and the
measurement of environmental parameters. Aiming
to create a platform to collect and share data about air
pollution in urban environment, (Aguiari et al., 2018)
also proposed an IoT based module to instrument bi-
cycles.
Since the bike use has become more common,
some market solutions have appeared to guarantee an
increase of security for bikes against thefts, usually
these are designated as smart locks. In this field, there
are several solution, as the Linka
1
lock, which has a
Bluetooth connectivity, an alarm against thefts and a
smart phone app where the user can unlock the bicy-
cle. The Bitlock
2
lock, has the same specs, but with a
different design, since it is not attached to the bicycle
rear wheel. Lastly, there are locks in the market that
act as IoT modules, since they have communication
modules who uses the mobile network, for example
the BL10
3
lock has the same features that the other
mentioned solutions have, plus a connectivity mod-
ule, that allows it to send data remotely to a connec-
tivity platform.
The mentioned solutions only tackle a part of the
problem that we are trying to solve, there is a lack of
a connectivity platform, in which data could be stored
and used to determine infrastructures condition. Be-
sides that, the determination of the locations with poor
cycling conditions is not straightforward, the data has
to be analyzed by models who should be calibrated.
In fact, the full potential of data collected by instru-
mented bicycles is not used. A proof of that is the fact
that there have been proposed several works related
to bike routing, for example (Song et al., 2014) and
(Luxen et al., 2011) that used OpenStreetMaps data
to create bike routing solutions, (Singleton and Lewis,
2012) was further and considered accident data in his
algorithms, however, we have not knowledge of stud-
ies who use real sensor data collected by bicycles to
have additional information about cycling network,
thus improving the route suggestions quality.
4 METHODOLOGY
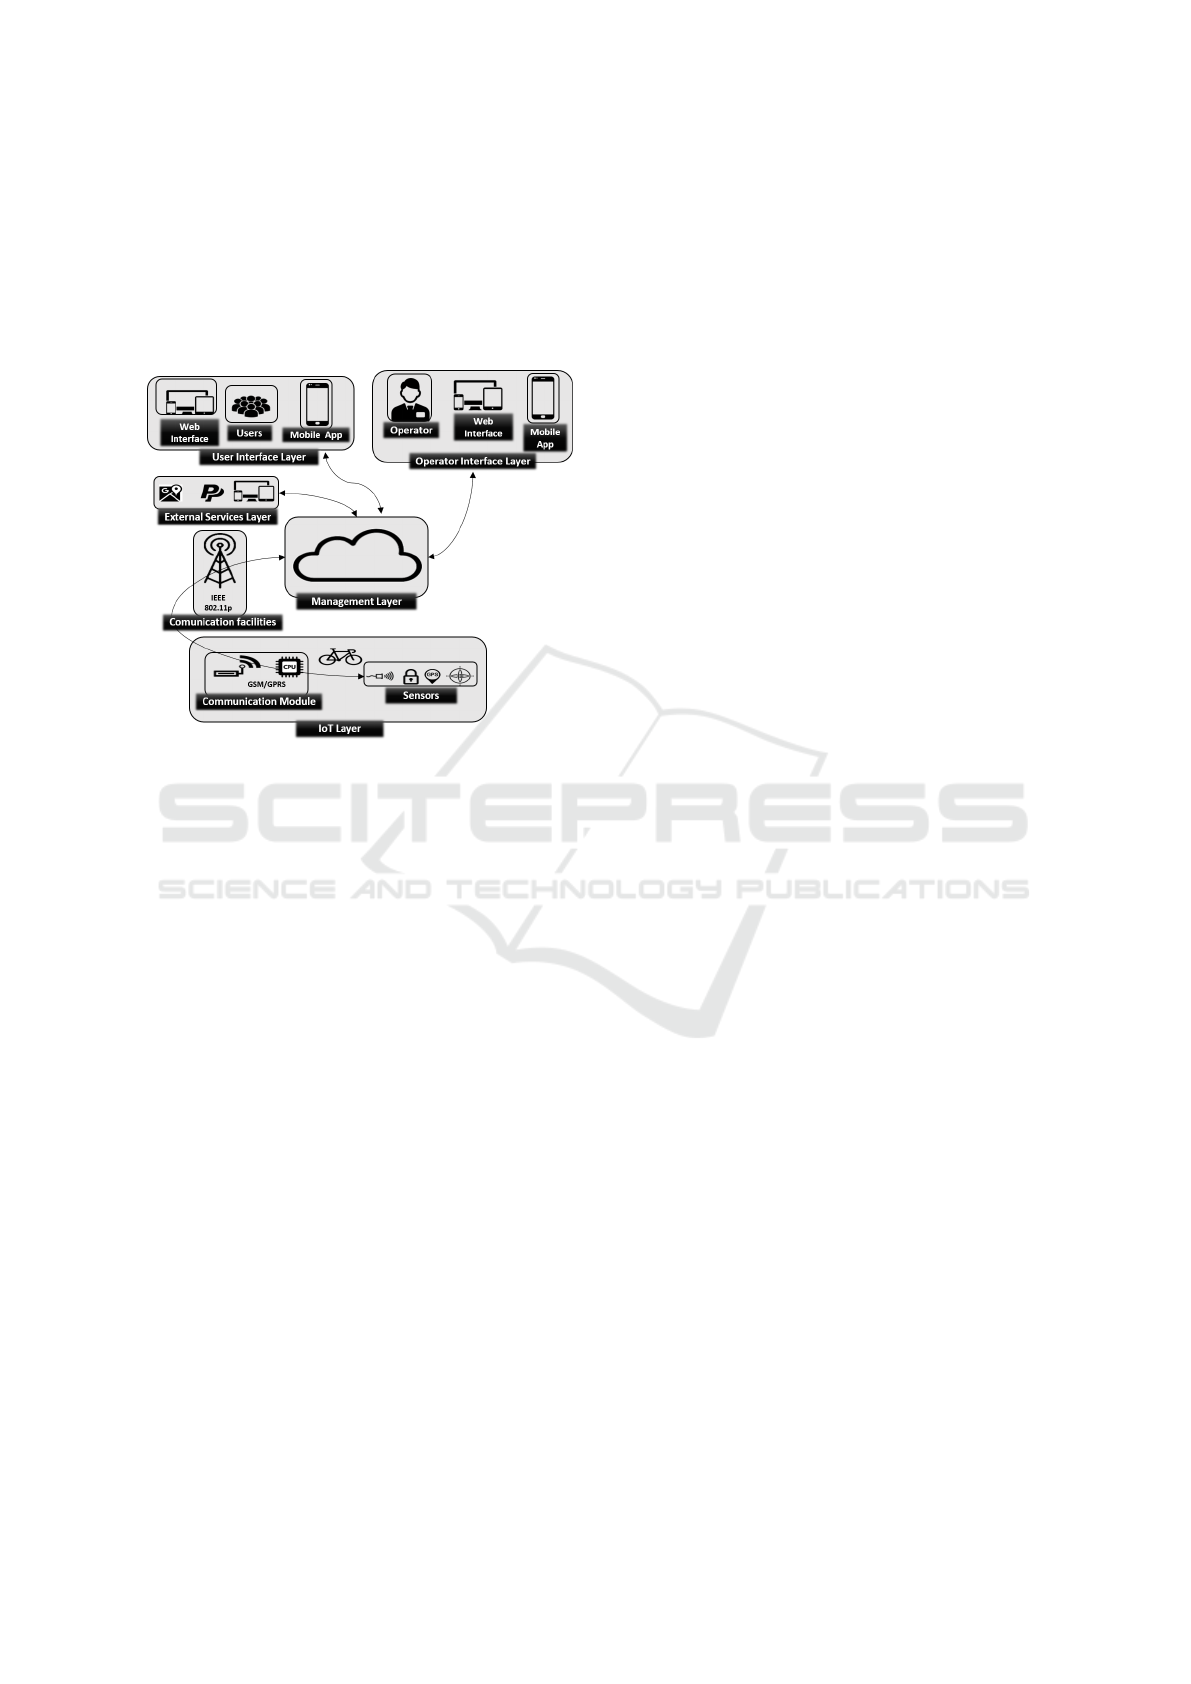
To achieve the objectives mentioned, our solution en-
compasses a cloud based management layer, user and
operator interfaces,external web services and an IoT
layer which includes a communication module and
sensors, as shown in Figure 1. To have real time in-
puts about the bike and road network status, each bike
has embedded sensors and a communication module,
which uses the mobile network to send the sensor data
in real real time to the management layer, where the
information is stored and analyzed.
The proposed solution is projected to be used
in several situations, since the on-board device (IoT
1
https://www.linkalock.com
2
https://bitlock.com
3
https://www.jimilab.com
VEHITS 2020 - 6th International Conference on Vehicle Technology and Intelligent Transport Systems
82
layer) has an actuator to lock or unlock the bike, mak-
ing it easy to integrate almost any bike in a free float-
ing bike-sharing system. Users and operators can in-
teract with the system using both, web interfaces and
mobile apps. It allows operators to control and moni-
tor the system while cyclists can use routing services
and remotely monitor their bicycles.
Figure 1: Proposed Solution Schematic.
The cloud based platform is divided in 5 layers,
as shown in Figure 2, the user and operator interface,
external services, IoT and management layer. In the
further subsection, these layers will be discussed in
detail.
4.1 IoT Layer
The IoT layer is composed by a GPS (Global Po-
sitioning System) to track the bicycle location and
speed and sensors as an IMU (Inertial Measurement
Unit), to measure accelerations and angular veloci-
ties. These features are used to determine the pave-
ment quality, detect bike turns, accidents and van-
dalism attempts. The distance sensor intends to give
some perception about the motor vehicle drivers be-
havior, namely if they respect the minimum lateral
distance when they overtake a bicycle. In order to
send the sensor data to data storage unit, the IoT layer
has a communication module, which consists of a mi-
cro controlled modem that uses the mobile network to
access a broker (Management Layer).
The communication between bicycle and cloud
based platform (Management Layer) is done through
the MQTT (Message Queuing Telemetry Transport)
protocol. At a time that all sensor data is read, the
modem sends a message to the mosquitto broker con-
taining the following fields:
• GPS Coordinates: Latitude, longitude and alti-
tude.
• GPS Velocity: Instant bike velocity, according to
the GPS satellites.
• Angular Velocity: Instant angular velocity over
the 3 axis.
• Linear Accelerations: Instant linear acceleration
over the 3 axis.
• Lateral Distance: To minimize errors, the follow-
ing features related to the lateral distance are sent:
– Instant Distance: Measurement at the sending
moment.
– Average Distance: Average of all measure-
ments, between sendings.
– Minimum Distance: Minimum measurement
between sendings.
– Maximum Distance: Maximum measurement
between sendings.
• Bike state: The smart lock has an embedded con-
tact sensor, thus is sent a boolean containing ”0”
if the bike is unlocked or ”1” if it is locked.
The information published on mosquitto broker is
then subscribed by a MQTT client application built in
python language and sent to a non relational Mongo
database (data storage, Management Layer). Lastly,
the IoT layer is encompasses a compact smart lock de-
vice attached to the bicycle rear wheel, to protect the
bicycle against thefts. However, this is not the single
purpose of this component, it is built in order to make
possible to use almost any bike in a bike-sharing sys-
tem. This is specially true, if we are talking about a
free floating business model, because communication
module and the services available in the management
layer, make possible to rent a bike, using remote pay-
ment systems and unlock it automatically when the
system notices that a payment has been made.
4.2 User Interface Layer
The user interface layer is essentially composed by
web interfaces and mobile apps. These interfaces
may differ, if we are considering a bike owner or a
bike-sharing system user. In the first case, the main
objective is to allow the cyclist to monitor the sen-
sor data embedded in the bicycle, provide him travel
management interfaces in which he can save his trip
records containing information about distance, dura-
tion, slope during the segments of the trip, wasted
calories, among others. In the second use case, it
also allow the use of bike-sharing services and remote
payment systems, among others. The communication
From a Traditional Bicycle to a Mobile Sensor in the Cities
83
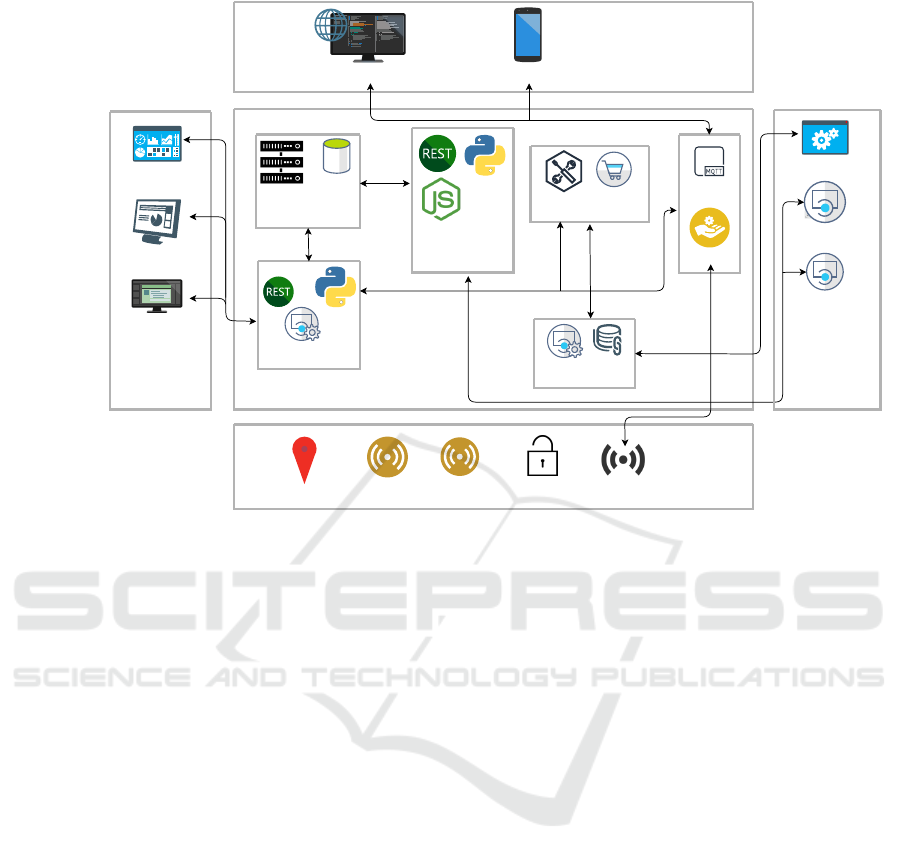
Dashboards
Monitoring
Control
Operator
interface layer
Broker
MQTT
protocol
SSL
Custom
API
Services
Data Storage
Business Logic
Management Layer
IoT Layer
Location
Communication
module
IMU
Smart
Lock
Distance
Sensor
User
interface layer
Web interface
Mobile App
Weather API
External
services layer
Bike-sharing
Cycling
network
API
Intelligence
engine
Figure 2: Connectivity Platform Architecture.
between user interfaces and the management layer is
made through the MQTT protocol, because it allows
easy management of the different service requests.
The main concern of this study is the cyclist safety
and bike security, thus the main feature of these in-
terfaces are the routing recommendations, that allow
each user to make the best route choice, according
to his profile. The user interface also allows the
bike monitoring, since it has an embedded IMU (IoT
layer), the system can send an alert when the bike is
disturbed, and keep it tracked with the GPS module.
Lastly, with the smart lock, the user can lock or un-
lock his bike remotely, using a smart phone app or
a web interface instead, making it possible to easily
share his vehicle with other people.
4.3 Operator Interface Layer
The operator layer interface intends to be used by the
system managers. It allows the creation of metrics
and dashboards to follow the work progress and goals
achievement. It is important to have tools to handle
the system management, to control the platform usage
and for monitoring the data sent to databases. These
interfaces are web based and use REST (Representa-
tional State Transfer) services to communicate with
the business logic engine.
This layer can also be used by external mobility
services managers. As the proposed solution is in-
tended to be used by bike owners and by bike-sharing
business owners or other soft mobility systems, we
provide simple interfaces for these entities, thus they
can control and monitor their business logic, for ex-
ample changing or creating taxes or service packages.
One problem in some bike-sharing systems is related
to vandalism and the bikes misuse, such as inappro-
priate parking. Since the on-board device (IoT layer)
has a GPS, the business owners know where their
bikes are, any time, and if they detect misuse, they
can impose the appropriate fine to the breaker, since
it will be registered in the system.
To handle the integration of different external sys-
tems with different business models, we provide cus-
tomized APIs (Application Programming Interfaces),
thus an undetermined number of external systems can
be added, with no loss of privacy and quality. We use
SSL (Secure Sockets Layer) to guarantee the commu-
nication security.
4.4 External Services Layer
The external services layer serves two different pur-
poses. One of them is related to the integration of
external mobility systems. As mentioned, the opera-
tor interface layer can work as a management inter-
face for external services owners. To integrate these
services, we propose customized APIs that allow the
access to several services, such as automatic pay-
VEHITS 2020 - 6th International Conference on Vehicle Technology and Intelligent Transport Systems
84

ment systems, user registration platforms, data stor-
age units, among others.
The second purpose of this layer is the communi-
cation with external data sources. To create an effi-
cient tool to help cyclists, we need a great variability
of data sources. As mentioned, we use data collected
from the several bikes as input for routing engines
and to make relevant suggestions to cyclists. How-
ever, this is not the only data source used, since we
use different external APIs to get detailed information
about network. In this field we can highlight Open-
StreetMaps, because it has very detailed information
about the cycling network and cycling infrastructures.
Other sources are used to enrich the cyclist knowledge
and ensure his safety, as weather services or traffic
services, if it they are available. This way, we can
provide a great amount of information to the cyclist
in a single application.
4.5 Managemet Layer
The management layer is the link between all layers.
It comprises several modules that guarantee the cor-
rect functionality of the entire platform. In the next
subsections, each module will be discussed in detail.
4.5.1 Communication Bus
The communication bus is composed by a mosquitto
broker which ensures the connection between the bi-
cycles, management layer and the user. The user as-
sumes a subscriber role, i.e, when he/she uses the pay-
ment methods, interact with smart lock or intends to
monitor bike trips records or other data, a subscription
is made in the broker and it returns a MQTT response,
containing the requested data, that have to previously
published by the management layer on the broker.
The communication module (IoT layer) has both
roles, publisher and subscriber, it publishes the col-
lected data on broker and subscribes bike states and
payment records, to ensure that the smart lock only
unlocks when the payment is successfully made (on
bike-sharing use case).
4.5.2 Customized Integration Module
The customized integration module works as link be-
tween external mobility systems and the management
layer. We create customized restful APIs for each
entity who needs to be integrated into our platform.
These APIs, allow the external entities to use ser-
vices as payment methods, data storage according to
personalized business models and other personalized
methods that could be relevant. This way, we can in-
clude a great diversity of external mobility services
and regard the stakeholders interests.
4.5.3 Data Storage
The data storage unit is where the data from differ-
ent sources is organized and stored. The data sources
comprise:
• Sensors(IoT Layer): The data collected by sensors
and mentioned in Section 4.1 is stored in a non
relational Mongo database.
• Business Model: Each system integrated into
the management layer may have his own busi-
ness model, which comprises users data, pay-
ment records, packages and taxes, fleet informa-
tion as number of bikes, type, among others. In
these cases, the database project is directly re-
lated to the business model complexity, thus we
use both, a NoSQL Mongo databases and SQL
SQLite databases.
• External Sources: To create useful tools for cy-
clists, we collect data from some external sources,
as OpenStreetMaps, weather services, among oth-
ers. In the first case, the information collected is
processed and saved in memory, as text file. The
real time information, such weather state, is col-
lected and shown to cyclist when requested, but
there is no need to store it in memory.
4.5.4 Business Logic
This module is composed by python based applica-
tions who publish services on broker. These services
can be related to the business logic, for example, pay-
ment methods, or it can be a more general service, as
a bike routing tool suggestion for cyclists. The last
service is designated to any user of our tool, since our
main goal is to improve the safety for cyclists and in-
crease the number of bike users.
Lastly, we have restful APIs, based on NodeJS to
allow operators to monitor their business in friendly
web interfaces. It also enables the creation or the
modification of mobility packages or taxes, making
the link between the data storage unit and the opera-
tors monitoring panels and dashboards.
4.5.5 Intelligence Engine
The intelligence engine is one of the most important
pieces in our platform, because the main goal of our
solution, that is the creation of a tool to help cyclists
and policy makers, is directly related to the intelli-
gence engine.
From a Traditional Bicycle to a Mobile Sensor in the Cities
85

The first step to build a tool to help cyclists, is to
understand their behavior as route users. If we have
a plethora of bikes sending GPS coordinates to our
databases, we can trace a profile of the user, based on
his choices and preferences. However, it is not a sim-
ple task, the GPS coordinates can have small inaccu-
racies due to poor GPS signal, thus a data treatment
known as map matching has to be done. To handle
this task, we use some python modules.
The IMU measurements are also processed by
other parallel python routines, in order to identify
places with poor surface condition or obstacles. To
achieve this goal, acceleration in 3 axis is measured
with a frequency high enough to allow multiple mea-
surements when passing over a road hole. The accel-
eration measured over the axis that points on Earth
gives information about the pavement, while the ac-
celeration over the other two axis and the angular ve-
locities allow to determine if there are road obstacles
avoided by cyclist. With this information, machine
learning algorithms are calibrated in order to detect
locations with the worst pavement condition or infras-
tructures who need maintenance. This kind of infor-
mation is an asset, when policy makers need to make
decisions, because they can do it in a more conscien-
tious way.
Other use that is given to the IMU data is the van-
dalism detection, if the bike is locked and a perturba-
tion is detected, the intelligence engine sends an alert
to the bike owner by email or SMS. The lateral dis-
tance sensor data is used to perceive road links where
motor vehicle drivers do not respect the minimum lat-
eral distance when they are overtaking a bicycle. We
use python in order to match these information with
the OpenStreetMaps data.
Finally, the most important role of the intelli-
gence engine is to create a tool to help cyclists in
route choice decisions, improving cycling safety. To
achieve that goal, we collect road network data from
OpenStreetMaps, throw the API provided by this en-
tity. Then, the data is processed and a cost is asso-
ciated to each edge, according to metrics shown in
literature and improved with the cyclist preference
choices determined from the GPS data. This data
is complemented with sensor data, i.e., in the edges
where poor surface conditions or obstacles in the cy-
clists way were detected, have an additional cost. The
joining of all data sources is used in routing algo-
rithms that provide cyclists an easy way to chose the
best route between departure point and destination ac-
cording to his profile and taking into account his per-
sonal preferences.
5 RESULTS AND DISCUSSION
In this section are presented some results, namely
some graphs containing data collected by sensors (IoT
layer). The sensors were chosen taking into account
their utility to determine road conditions, road users
behavior and detect obstacles in cycling infrastruc-
tures.
Figure 3 shows linear accelerations in the 3 axis,
measured by the IMU during a bike trip. In the begin-
ning of the trip, accelerations along the Y and Z axis
are near 0 m/s
2
and the acceleration along the X axis
is between -10 and -9 m/s
2
, which makes sense, con-
sidering that the bicycle was stopped and the X axis
is aligned with the gravity direction. The trip started
at the instant marked with the first rectangle. The ac-
celeration peak in Z axis on that instant, denotes the
bike positioning to start the trip.
The second rectangle represents a passage over a
bicycle path curb. According to figure 3, this inad-
equacy is visible by the inverted peak in the X axis.
In the third rectangle is visible that the number of
peaks in this curve increased. This happen, because
there was a change in the road pavement, the cyclist
was previously cycling on smooth asphalt and then
the pavement changed to cobblestone. The oscilla-
tory peaks in Y and Z axis represent the bike insta-
bility, this values, together with the angular velocity
data are useful to give information about user behav-
ior, and with a considerable amount of data, obstacles
in the road can be detected due to cyclists turns and
bike position. The IMU data can also be used to detect
accidents or car crashes during the trips. However, to
have precise models that detect crashes from data, a
calibration with data sets in which occurred accidents
or crashes needs to be done.
Figure 4 shows measurements made by the lateral
sensor distance who is pointed to the cyclists left. The
main goal that led us to use this sensor was the detec-
tion of motor vehicles misbehavior, namely, the trans-
gression of the minimum lateral overtaking distance.
The lateral distance associated with the GPS coordi-
nates allows to create a list of places and time of the
day where most of transgressions occur.
The frequency of data acquisition is much higher
than the sending frequency to the databases (man-
agement layer), so, in order to not lose measurement
peaks and smooth reading errors, we send to the con-
nectivity platform the average of all measurements
between sends, the minimum and maximum measure-
ments and the instant measurement. Note that the
graph in figure 4 does not show the instant measure-
ments for the test trip, because they are not relevant to
the discussion. Figure 4 has two regions that are in-
VEHITS 2020 - 6th International Conference on Vehicle Technology and Intelligent Transport Systems
86
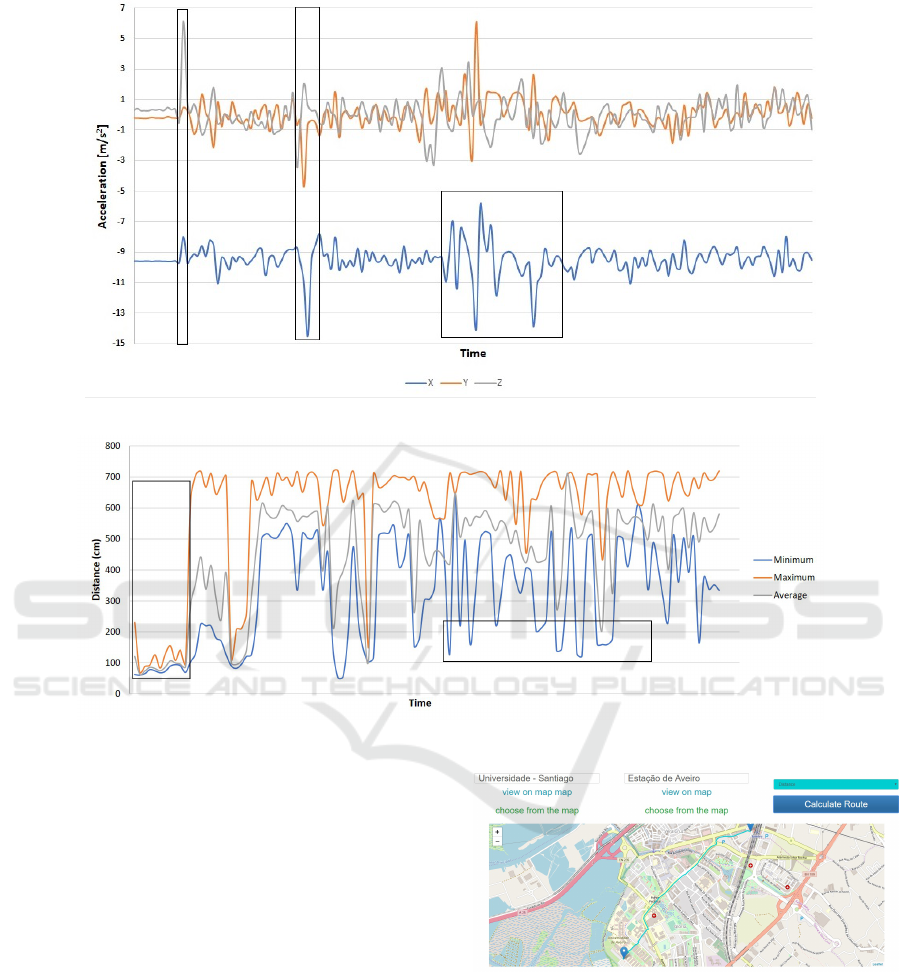
Figure 3: Linear Accelerations (IMU Measurements).
Figure 4: Lateral Distance (Sensor Measurements).
teresting for discussion marked by a vertical and hor-
izontal rectangles. The first one, where the distance
values are small, represents a period in which the bike
was confined by the surroundings, i.e., the cyclist was
passing over a bridge and was confined by it’s bound-
aries. The horizontal rectangle show periods in which
real overtakes occurred (as confirmed by tests). Note
that the other oscillations and peaks do not represent
motor vehicles overtakes, but other obstacles during
the trip. The results show that motor vehicles behav-
ior detection from this data is not an easy task, thus,
the creation of a mobile interface or embedded button
in which the cyclist could mark the places where real
overtakes have occurred would facilitate the determi-
nation of places where drivers misbehavior occurs.
In figure 5, is shown the proposed routing in-
terface. This service takes into account sensor data
and data collected from third party entities, as Open-
StreetMaps, to compute algorithms which calculate
the best route between two locations, according to
Figure 5: Routing Interface.
one of four criteria: distance, travel time, comfort or
safety.
In general, the tests made confirm that the IoT
layer’s components work as expected. We can en-
sure a reasonable sending frequency to the database.
Sometimes there are communication delays that oc-
cur due the poor signal coverage in some places, but
the system recovers automatically in just few seconds.
The laboratory tests with IMU and the distance sen-
From a Traditional Bicycle to a Mobile Sensor in the Cities
87

sor, showed good measurement accuracy, thus some
deviation from expected values, shown in figure 3
only results from the fixation on the bike. The GPS
also worked as expected, i.e., the marked points on a
map corresponds to the real path taken by the cyclist,
with no significant deviations.
6 CONCLUSIONS
This work presents a concept of a connectivity plat-
form and a IoT based solution embedded on bikes.
The results showed that the chosen hardware works
as expected and the collected data is valuable to de-
termine road features and cyclists behavior. The plat-
form services were tested in laboratory with a bike-
sharing system concept.
As future work, we would like to develop the me-
chanical concept of a smart lock, in order to have the
on-board unit (IoT layer) embedded on it. The man-
agement layer also needs further developments. The
first step will be to test the services as payment or
bike renting in a controlled environment, and the re-
solve some issues that may appear and test it in real
environment.
The data collected by sensors proved his impor-
tance, with exception to the lateral distance. It is im-
possible to distinguish real overtakes from confined
environments as shown in Section 5, thus it needs
the development of a mechanism in which the cyclist
could mark real overtakes.
The routing recommendation engine is functional
with four criteria, distance, travel time, comfort and
safety. However it considers mainly static data from
external data sources as OpenStreetMaps. To take
more serious conclusions, we need to test the on-
board unit (IoT layer) in fleet of bikes, in order to
have a significant dataset. It also would give us bet-
ter insights about cyclists profile and preferences. Our
system is prepared to provide the sensor and GPS data
through an API, thus third party entities can use it, in
order to create their own recommendation systems or
to help stakeholders or policy makers making the best
decisions.
ACKNOWLEDGEMENTS
POCI-01-0247-FEDER-033769 - ”Ghisallo –
Investigac¸
˜
ao e Desenvolvimento de uma nova
soluc¸
˜
ao de comutac¸
˜
ao urbana, assente num novo
conceito de ve
´
ıculo el
´
etrico de pr
´
oxima gerac¸
˜
ao”
– ”Ghisallo - Research and Development of a new
urban commuting solution, based on a new concept
of a next-generation vehicle”.
UID / EMS / 00481/2019-FCT
CENTRO-01-0145-FEDER-022083
REFERENCES
Aguiari, D., Delnevo, G., Monti, L., Ghini, V., Mirri, S.,
Salomoni, P., Pau, G., Im, M., Tse, R., Ekpanyapong,
M., and Battistini, R. (2018). Canarin II: Designing
a smart e-bike eco-system. CCNC 2018 - 2018 15th
IEEE Annual Consumer Communications and Net-
working Conference, 2018-Janua(762013):1–6.
Akar, G. and Clifton, K. (2009). Influence of Individual
Perceptions and Bicycle Infrastructure on Decision to
Bike. Transportation Research Record: Journal of
the Transportation Research Board, 2140(2140):165–
172.
Buehler, R. and Dill, J. (2016). Bikeway Networks: A
Review of Effects on Cycling. Transport Reviews,
36(1):9–27.
Dondi, G., Simone, A., Lantieri, C., and Vignali, V. (2011).
Bike Lane Design: the Context Sensitive Approach.
Procedia Engineering, 21:897–906.
Grama, A., Petreus, D., Baciu, C., Bia, B., Coca, O., and
Socaciu, V. (2018). Smart Bike Improvement Using
Embedded Systems. In Proceedings of the Interna-
tional Spring Seminar on Electronics Technology, vol-
ume 2018-May, pages 1–4. IEEE.
Hsu, Y.-T., Kang, L., and Wu, Y.-H. (2016). User Behavior
of Bikesharing Systems Under Demand–Supply Im-
balance. Transportation Research Record: Journal
of the Transportation Research Board, 2587(1):117–
124.
Lindsay, G., Macmillan, A., and Woodward, A. (2011).
Moving urban trips from cars to bicycles: impact
on health and emissions. Aust NZ J Public Health,
35(1):54–60.
Luxen, D., Gmbh, N., and Vetter, C. (2011). Real-
Time Routing with OpenStreetMap data Categories
and Subject Descriptors. In Proc. of the 19th ACM
SIGSPATIAL GIS Conf., pages 513–516.
Menghini, G., Carrasco, N., Sch
¨
ussler, N., and Axhausen,
K. W. (2010). Route choice of cyclists in Zurich.
Transportation Research Part A: Policy and Practice,
44(9):754–765.
Pucher, J. and Buehler, R. (2008). Making Cycling Irre-
sistible: Lessons from The Netherlands, Denmark and
Germany. Transport Reviews, 28(4):495–528.
Singleton, A. D. and Lewis, D. J. (2012). Including Ac-
cident Information in Automatic Bicycle Route Plan-
ning for Urban Areas. Urban Studies Research,
2011:1–10.
Song, Q., Zilecky, P., Jakob, M., and Hrncir, J. (2014).
Exploring pareto routes in multi-criteria urban bicy-
cle routing. In 2014 17th IEEE International Con-
ference on Intelligent Transportation Systems, ITSC
2014, number September, pages 1781–1787.
VEHITS 2020 - 6th International Conference on Vehicle Technology and Intelligent Transport Systems
88
