
Fully Connected Visual Words for the Classification of Skin Cancer
Confocal Images
Athanasios Kallipolitis
1a
, Alexandros Stratigos
2
, Alexios Zarras
2
and Ilias Maglogiannis
1b
1
Department of Digital Systems, University if Piraeus, Piraeus, Greece
2
1st Department of Dermatology, Andreas Syggros Hospital, Medical School,
National and Kapodistrian University of Athens, Athens, Greece
Keywords: Reflectance Confocal Microscopy, Bag of Visual Words, Skin Cancer, Neural Networks, Speeded up Robust
Features, Haralick.
Abstract: Reflectance Confocal Microscopy (RCM) is an ancillary, non-invasive method for reviewing horizontal
sections from areas of interest of the skin at a high resolution. In this paper, we propose a method based on
the exploitation of Bag of Visual Words (BOVW) technique, coupled with a plain neural network to classify
extracted information into discrete patterns of skin cancer types. The paper discusses the technical details of
implementation, while providing promising initial results that reach 90% accuracy. Automated classification
of RCM images can lead to the establishment of a reliable procedure for the assessment of skin cancer cases
and the training of medical personnel through the quantization of image content. Moreover, early detected
benign tumours can reduce significantly the number of time and resource consuming biopsies.
1 INTRODUCTION
There are two main types of skin cancers that invade
human epidermis, Melanomas and non-Melanomas.
Melanomas refer to the formation of malignant
tumours of melanocytes which are the cells
responsible for the production of melanin, whereas
non-Melanomas includes two main categories, basal
cell carcinomas (BCC) and squamous cell carcinomas
(SCC) and refer accordingly to basal and squamous
cells. The statistics about skin cancer make an
undisputed statement concerning the universality and
severity of the issue. In the United States 3,4 million
people were treated for non-Melanomas in 2012 with
equal cases of BCC and SCC (Rogers et al, 2012). In
Australia Melanomas and non-Melanomas represent
the 75% of all cancers (Doran et al, 2016). According
to estimations in (Bray et al, 2018), there will be 18.1
million new cases [17.0 million excluding non-
Melanomas Skin Cancer (NMSC) cases] and 9.6
million cancer deaths (9.5 million excluding NMSC)
worldwide in 2018. Nevertheless, early detection and
treatment of each of those cases can pose a
devastating effect on the number of mortalities
a
https://orcid.org/0000-0001-9234-0069
b
https://orcid.org/0000-0003-2860-399X
reducing it by many figures. Apart from the
traditional method of dermoscopy through which
many skin cancers cases are detected and the invasive
method of conducting biopsy to verify the
malignancy of those cases, RCM lies in the middle. It
offers early detection and verification, while relieving
the patient and the doctor from the invasive part of the
methodology. The review of horizontal skin intervals
is made possible through the detection of
backscattered light from illuminated in vivo samples,
in multiple levels (depth), in longitudinal and
transverse axis and in real time. The contribution of
the method to the diagnosis of skin cancer
malignancies is based on its ability to depict the skin
lesions at the cellular level, thus, offering, in
conjunction with dermoscopy, a more accurate
diagnosis. However, classification of skin cancer
RCM images relies on human objectivity, requires
training and is a rather time-consuming procedure.
RCM images are hard to interpret and classify by the
human eye providing, thus, space for computer vision
to “join the scene”. Furthermore, required specialized
equipment is hard and expensive to obtain, therefore,
consisting the method not accessible to majority of
Kallipolitis, A., Stratigos, A., Zarras, A. and Maglogiannis, I.
Fully Connected Visual Words for the Classification of Skin Cancer Confocal Images.
DOI: 10.5220/0009328808530858
In Proceedings of the 15th International Joint Conference on Computer Vision, Imaging and Computer Graphics Theory and Applications (VISIGRAPP 2020) - Volume 5: VISAPP, pages
853-858
ISBN: 978-989-758-402-2; ISSN: 2184-4321
Copyright
c
2022 by SCITEPRESS – Science and Technology Publications, Lda. All rights reserved
853
the academic community. Machine learning
techniques along with neural networks have long ago
provided an assistive hand to the quantization of
visual patterns. In this context, we propose a
methodology for fast classification of RCM images
based on the formation of a visual vocabulary and a
plain neural network. Accuracy of classification
reaches 92,6% which is rather promising, but future
work is required concerning the extraction of
semantic information from the images’ interest
points.
The remainder of this paper is structured as
follows: Section 2 presents the related work, while
Section 3 describes the proposed methodology for
classification. Section 4 describes the experimental
results and Section 5 concludes the paper.
2 RELATED WORK
Although RCM was discovered in the second half of
the 20
th
century, related literature describes limited
applications in the medical field of dermatology. The
same limitations apply equally to the field of
computer vision. However, the last decade many
researchers have focused their strength in the specific
area, even though annotated RCM images are few and
the respective databases even fewer. The sparsity of
samples opposes to the universal trend of deep
learning techniques to solve classification problems.
Nevertheless, (Wodzinski et al, 2019) presents a
Resnet type convolutional neural network
configuration which is pretrained on the ImageNet
database and fine-tuned with confocal images. The
achieved accuracy is 87%. A deep learning technique
is proposed in (Combalia et al, 2019) for the digital
staining of confocal images. This technique, mainly
based on the utilization of a generative adversarial
network, can be proved useful for the enhancement of
cellular details and the visualization of mitosis. Many
attempts have been made towards the segmentation
and classification of segmented tiles of the whole
image. The segmentation is based in two scenarios,
either on the depicted visual patterns of each tile that
are of significance to dermatologists or according to
the thickness of the skin and, afterwards, classified in
respective categories. The first scenario takes place in
(Zheng et al, 2019), where the images are divided in
tiles depicting meshwork, clod, ring, aspecific and
background patterns. Speeded Up Robust Features
are extracted to form a dictionary and, consequently,
classification of each tile is performed by a Support
Vector Machine scheme. Classification shows 55-
81% sensitivity and 81-89% specificity in
distinguishing these patterns. The second scenario is
described in (Kaur et al, 2016), where a hybrid deep
learning approach is utilized that mixes unsupervised
texton-based learning with a supervised deep neural
network. In this case, the accuracy reaches 82%,
improved by 31% in respect with the simple deep
learning approach.
Taking into consideration the lack of image
samples, the success of previous works that utilized
dictionary schemes for the classification of whole
images or smaller tiles, the robustness of Speeded Up
Robust Features (SURF) in different image
variations, the lack of color information and the need
to balance the inefficiency of the visual vocabulary
schemes concerning localized information, we
describe a classification system that tackles with
efficiency all the above-mentioned obstacles. The
inputs (RCM images) are augmented in number,
analysed for feature extraction and finally classified
to a promising accuracy, therefore, providing
evidence that predicting malignancies from these
images can lead to the reduction of biopsies and the
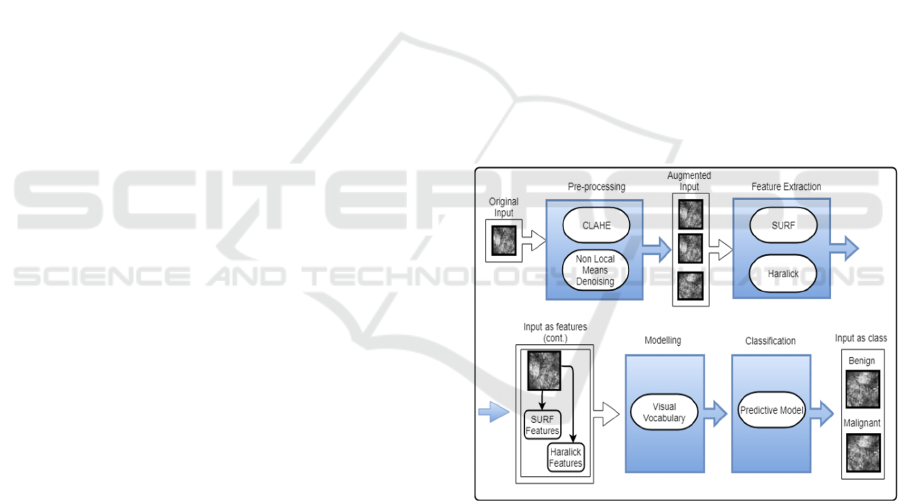
improvement of training of medical personnel. A
general overview of the system is depicted in Figure
1.
Figure 1: Overall system architecture.
3 METHODOLOGY
The methodology presented in this paper to address
classification problems, consists of four (4) stages
(namely):
Augmentation;
Feature Extraction;
Modelling;
Classification.
VISAPP 2020 - 15th International Conference on Computer Vision Theory and Applications
854
3.1 Augmentation
The stage of augmentation consists of applying two
types of transformations. Although it is often
observed that data augmentation takes place by
simple alterations of the original images (rotation, flip
etc.), the methodology follows a different path by
selecting a contrast enhancement and denoising
algorithm to reach its goal. The choice is based on
experiments that demonstrated the improved
performance of the classification algorithm in images
that were initially imposed to contrast enhancement
and denoising afterwards. In order to get the first set
of images, Contrast Limited Adaptive Histogram
Equalization (CLAHE) is performed. CLAHE
(Zuiderveld, 1994) is basically an Adaptive
Histogram Equalization algorithm; therefore, it
generates localized image histograms corresponding
to each area that displays different brightness levels
from another, and through them increases the
intensity value at the points where edges are located.
For the generation of the second set of images a Non-
Local Means Denoising algorithm is applied on the
contrast enhanced image. The NL Means (Buades et
al, 2011) Denoising algorithm is utilized to reduce
noise through non-local means. This algorithm works
as a convolutional filter calculating the mean from the
values of all the pixels in the image (instead of only
the adjacent pixels) with added weight on each pixel.
The data augmentation procedure results to the
triplication of the dataset size, which is essential for
training the neural network in the predictive model.
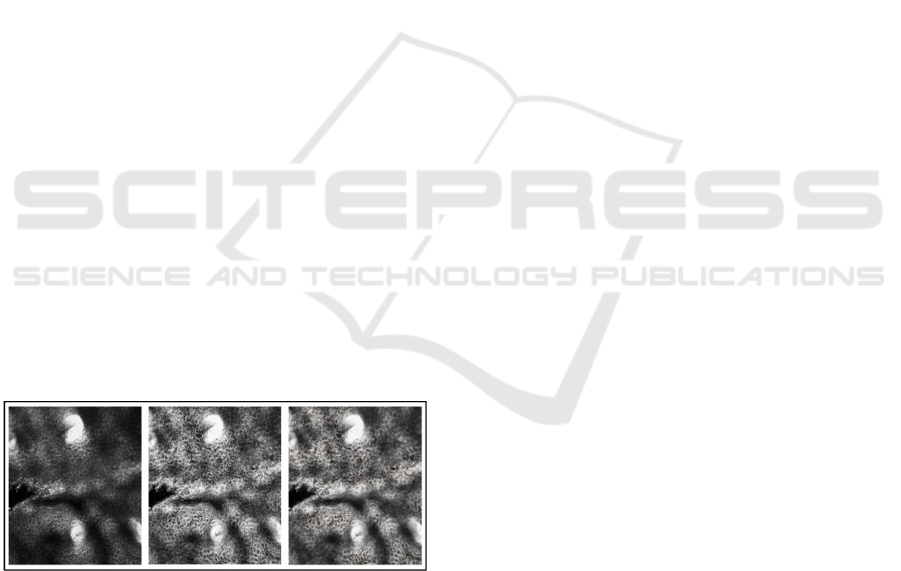
In Figure 2, the initial RCM image showing an Acral
Nevus and two synthetic copies produced by the
augmentation procedure.
Figure 2: Data Augmentation. The initial image on the left,
the contrast enhanced image in the centre and the denoised
image on the right.
3.2 Feature Extraction
Each image is processed for the extraction of visual
features utilizing the SURF and Haralick algorithm.
The application of the SURF algorithm (Bay et al,
2008) to each image is performed locally on the
interest points that are detected by a fast Hessian
Detector. This operation results to the extraction of a
large number of 64-dimensional vectors, which are
representative of the information depicted in each
interest point. On the other hand, Haralick features
(Haralick, 1979) are extracted globally on each image
producing a 14-dimensional vector. Concluding this
procedure, a set of 64 dimensional vectors and a 14-
dimensional vector is assigned to each image. The
combination of these two techniques has been proven
to be rather efficient in the classification of colorectal
histopathology images in (Kallipolitis and
Maglogiannis, 2019), exhibiting similar patterns.
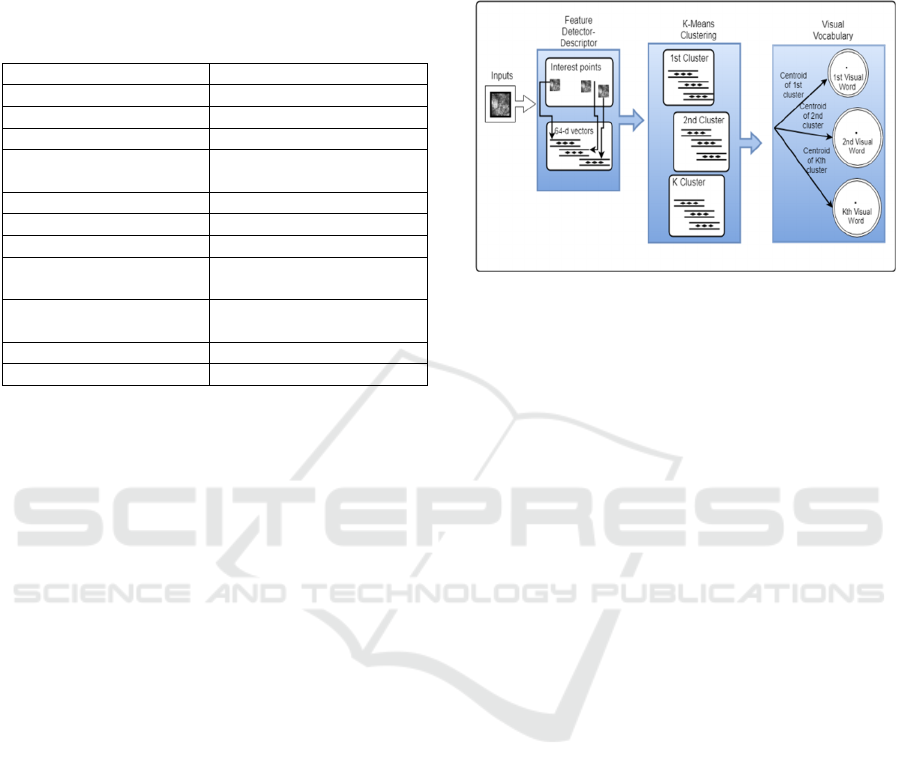
3.3 Modelling
In order to model the information extracted from the
RCM images, a visual vocabulary is created by K-
Means clustering of the whole set of 64 dimensional
vectors from the augmented dataset. The appropriate
number of clusters is defined by performing elbow
analysis while clustering. At a certain number of
cluster (for the system k=345) the slope of the
graphical representation becomes shallow. The k
values that belong to the shallow curve are excluded
to avoid the known curse of high dimensionality. The
K-Means clustering leads to the formation of a 345-
word visual vocabulary, where each word represents
each centroid of K clusters. In order to feed the next
step (classification), each image needs to be
represented as a single vector. The utilization of a
local feature extractor (SURF) creates the necessity
of a structure (Visual vocabulary) that can map
multiple vectors into one. This mapping operation is
performed by associating the interest points of each
image to the visual words of the vocabulary. The
association takes place by measuring the Euclidean
distance between visual words and interest points.
The completion of this procedure leads to the
representation of each image with a 345-dimensional
vector (vocabulary vector). To reach the form of the
final vector the vocabulary vector is concatenated
with the 14-dimensional Haralick vector. However,
values deriving from the Haralick algorithm are by far
greater than the values deriving from the mapping.
Therefore, the Haralick values are normalized
according to the minimum and maximum values of
the vocabulary vector.
3.4 Classification
The 359-dimensional feature vector is the input to a
simple neural network which consists of three fully
connected layers. A simple fully connected neural
network approach is selected instead of a deep
Fully Connected Visual Words for the Classification of Skin Cancer Confocal Images
855
learning technique, based on the sparsity of samples
and the fact that a compact representation of visual
features is already provided by steps B and C. The
parameters of the neural network are set to the values
that are presented in Table 1.
Table 1: Basic neural network parameters.
Paramete
r
Value
Hidden Layers 3
Activation function Tanh
Wei
g
ht Initialization Xavie
r
Learning Rate
0,25 for Stochastic
Gradient Descent
1st Hidden La
y
er 27 neurons
2nd Hidden La
y
er 9 neurons
3rd Hidden Laye
r
3 neurons
Output Layer Activation
Function
Softmax
Output Layer Loss
Function
Negative Log Likelihood
E
p
ochs 5500
Paramete
r
Value
4 EXPERIMENTAL RESULTS
In order to evaluate the proposed system, a dataset is
provided by the Syggros Hospital. The dataset
includes 136 RCM grayscale images with
corresponding labeling from specialist dermatologists
in the hospital. The labels classify the images in seven
specific types of pathological and physiological
conditions as follows:
Spitz;
Basal Cell Carcinoma (BCC);
Actinic Keratosis (AK);
Lentigo Maligna-Lentigo Maligna Melanoma
(LM-MM);
Seborrheic Keratosis;
Solar Lentigo;
Nevus.
All images are captured by a Mavig Vivascope 3000
that operates at 830nm, therefore, providing images
until the depth of 200μm. However, the resulting
analysis beyond the depth of 150μm provides in-
adequate discriminative capability for the human eye.
Computer vision can assist for these remaining 50μm,
where the human eye lacks.
The images’ dimension is 1000x1000. The dataset
consists of 10 Actinic Keratosis (AK) images, 4 Spitz
images, 42 Nevus (including 1 Acral Nevus type), 15
Lentigo Maligna-Lentigo Maligna Melanoma (LM-
MM), 17 Basal Cell Carcinoma (BCC), 3 Solar
Lentigo, 1 Ink Spot Lentigo and 44 Seborrheic
Keratosis (SK) images which are categorized in two
main classes: Benign (Nevus, Ink Spot Lentigo, Solar
Lentigo, SK), Malignant(AK, BCC, Spitz, LM-MM)
for classification.
Figure 3: Visual Vocabulary formation.
Initially, experiments are carried out with the
formation of a SURF based vocabulary. For the
second attempt, the vector is formed by the
concatenation of the local SURF and global Haralick
vector and the last attempt is accomplished with the
formation of a local SURF-Haralick vector which is
created by the areas of interest (30x30 pixel area is
chosen) detected by the fast Hessian Detector.
Reliability of experiments results is established by a
10-fold cross validation scheme. Accuracy, recall,
precision and specificity are utilized as evaluation
metrics for binary and multiclass classification. In
multiclass classification, a one versus all classifier is
assumed in order to report macro-averaging binary
precision, recall and specificity metrics, meaning that
the average value of the metrics of each individual
class is calculated. Thanks to the utilization of the
visual vocabulary in conjunction with a plain ‘vanilla’
neural network, the required hardware is limited to a
PC equipped with an Intel i5 processor that runs at
1.8GHz and an 8GB RAM. The classification is
performed in two different scenarios, the first for two
classes (benign /malignant) and the second for five
classes (AK/ SK/ NEVUS/ BCC/ LM_MM).
Classification results for the two scenarios are
presented in Table 2. The five classes scenario for the
Global Haralick implementation is not presented due
to its low performance. In Table 3 error results for
predicting the skin condition in the two classes
scenario are presented. Each column refers to the
feature extraction method.
VISAPP 2020 - 15th International Conference on Computer Vision Theory and Applications
856

Table 2: (A)ccuracy, (S)ensitivity, (P)recision, (Sp)ecificity
of classification results of the dataset in two and five
classes.
Classification Tas
k
Various
Implementations
Two Classes Five Classes
SURF BOVW
A:0,90
S:0,82
P:0,92
Sp:0,95
A:0,82
S:0,80
P:081
Sp:0,95
Global Haralick
A:0,74
S:0,76
P:0,43
Sp:0,91
A:0,61
S:0,30
P:059
Sp:0,88
SURF BOVW+
Global Haralick
A:0,92
S:0,86
P:0.95
S
p
:0,97
A:0,84
S:0,79
P:0,81
S
p
:0,96
SURF+ Local
Haralick BOVW
A:0,91
S:0,84
P:0.92
Sp:0,95
A:0,80
S:0,77
P:0,80
Sp:0,96
SURF BOVW+
Global Haralick
(Without data
augmentation)
A: 086
S:0,81
P:0,82
Sp:0,94
A:0,80
S:0,75
P:0,90
Sp:0,91
Table 3: Error for skin condition prediction according to
different feature extraction method for the two classes
scenario.
Error
Skin Condition SURF
SURF
+Haralic
k
BCC 0,18 0,13
Nevus
0,10
0,18
S
K
0,07 0,32
A
K
0,2 0,07
Spitz 0,08 0,03
S. Lenti
g
o 0.02 0,02
Acral Nevus 0,94 0,01
5 CONCLUSIONS AND FUTURE
WORK
Results after data augmentation (SURF BOVW) are
satisfying and improve the accuracy up to 4% in
reference with the implementation which utilizes the
initial dataset. Nevertheless, image classification
accuracy with the combination of local SURF and
global Haralick features is further improved to reach
92.6% (2.5% improvement). The enhancement of the
original SURF vector with Haralick features reduces
the classification error concerning AK samples to half
but demonstrates the opposite effect for BCC
samples. The contribution of the proposed
methodology beyond the high precision of
classification into two classes concerns the fact that
the training of the predictive model is achieved with
a small number of samples and without the use of
increased computer resources (e.g. GPU graphics
card). The classification results of the three
implementations (namely SURF BOVW, SURF
BOVW+ Global Haralick, SURF + Local Haralick
BOVW) demonstrate that the proposed approach can
exceed more complex implementations based on deep
neural networks. Despite of the positive feedback
provided by the initial results, further and thorough
investigation should be directed towards the relations
between visual words and the transformation of
simple information to knowledge concerning the role
of each visual pattern in determining the prediction.
Moreover, the combination of vectors deriving from
different processes (SURF/Haralick) is an area where
future work can shed light by the utilization of
modern data fusion techniques.
ACKNOWLEDGEMENTS
This research has been co‐financed by the European
Union and Greek national funds through the
Operational Program Competitiveness,
Entrepreneurship and Innovation, under the call
RESEARCH – CREATE – INNOVATE (project
code: Transition - T1EDK-01385).
REFERENCES
Bay, H., Tuytelaars, T., Gool, V.G., 2008. Speeded Up
Robust Features. Computer Vision and Image
Understanding, 110(3), 346-359.
Bray, F., Ferlay, J., Soerjomataram, I., Siegel, R. L., Torre,
L. A., Jemal, A., 2018. Global cancer statistics 2018:
GLOBOCAN estimates of incidence and mortality
worldwide for 36 cancers in 185 countries. CA: A
Cancer Journal for Clinicians, 68: 394-424.
Buades, A., Coll, B., Morel, J.M., 2011. Non-Local Means
Denoising. Image Processing Online, 1.
Combalia, M., Pérez-Anker, J., García-Herrera, A., Alos,
L., Vilaplana, V., Marqués, F., Puig, S., Malvehy, J.,
2019. Digitally Stained Confocal Microscopy through
Deep Learning. Proceedings of the 2nd International
Conference on Medical Imaging with Deep Learning,
PMLR 102, 121-129.
Doran, C.M., Ling, R., Byrnes, J., Crane, M., Shakeshaft,
A.P., Searles, A., et al, 2016. Benefit cost analysis of
three skin cancer public education mass-media
Fully Connected Visual Words for the Classification of Skin Cancer Confocal Images
857

campaigns implemented in New South Wales, Australia
PLoS One, 11 (1).
Haralick, R.M., 1979. Statistical and structural approaches
to texture, Proc. IEEE, 67(5), 786-804.
Kallipolitis, A., Maglogiannis, I., 2019. Creating visual
vocabularies for the retrieval and classification of
histopathology images. EMBC.
Kaur, P., Dana, K.J., Cula, G.O., Mack, M.C., 2016. Hybrid
deep learning for Reflectance Confocal Microscopy
skin images. 23rd International Conference on Pattern
Recognition (ICPR), 1466-1471.
Rogers, H.W., Weinstock, M.A., Feldman, S.R., Coldiron.
B.M., 2012. Incidence estimate of nonmelanoma skin
cancer (keratinocyte carcinomas) in the U.S.
population, JAMA Dermatol, 151 (10) (2015), pp.
1081-1086.
Wodzinski, M., Skalski, A., Witkowski, A., Pellacani, G.,
Ludzik, J, 2019. Convolutional Neural Network
Approach to Classify Skin Lesions Using Reflectance
Confocal Microscopy. EMBC.
Zheng, Y., Jiang, Z., Zhang, H., Xie, F., Ma, Y., Shi, H., &
Zhao, Y., 2018. Histopathological Whole Slide Image
AnalysisUsing Context-Based CBIR. IEEE
Transactions on Medical Imaging, 37, 1641-1652.
Zuiderveld, K., 1994. Contrast Limited Adaptive
Histogram Equalization. Graphics Gems IV. P.
Heckbert. Boston, Academic Press. IV: 474—485.
VISAPP 2020 - 15th International Conference on Computer Vision Theory and Applications
858
