
Comparison of Models for Predicting the Risk of Falling in the
Non-hospitalized Elderly and Evaluation of Their Performances on
an Italian Population
Elisa Salvi
1
, Irma Sterpi
2
, Antonio Caronni
2
, Peppino Tropea
2
, Michela Picardi
2
,
Massimo Corbo
2
, Giordano Lanzola
1
, Silvana Quaglini
1
and Lucia Sacchi
1
1
Department of Electrical, Computer and Biomedical Engineering, University of Pavia, Pavia, Italy
2
Department of Neurorehabilitation Sciences, Casa di Cura Privata del Policlinico, Milan, Italy
Keywords: Fall Risk, Predictive Models, Model Comparison, Aging in Place.
Abstract: Within the NONCADO project, which aims at preventing falls in the elderly living alone at home, we
performed a literature search for models that provide an estimate of the subject’s risk of falling. Our goal is
to combine the scores produced by multiple models to derive an overall risk score. In this work we described
nine predictive models and we tested their concordance in assessing the risk of falling of two patient
populations, namely a simulated patient population and an Italian real-world patient population. Using the
real-world population, we also measured the performance of a subset of these models, by comparing their
predictions with the outcome (in terms of occurred falls) collected in a 9-months follow-up study. Our
experiments showed poor model concordance and dependence of the results on the population. Furthermore,
the predictive performance measured the Italian population were limited. Therefore, attempts to combine the
risk predictions of multiple models should be cautious.
1 INTRODUCTION
Falls in elderly people are a recognized social
problem. They are a major cause of loss of
independence, hospitalization (or increase of hospital
stay), decreased quality of life, and increased social
costs. They are also associated with psychological
and functional sequelae, independently from the
injury severity. Falls may be associated to a variety of
risk factors, related to the person’s health status (e.g.,
neurological disorders, traumas, and drug therapies),
lifestyle (e.g., lack or excess of physical activity),
living environment (e.g., inadequate lighting, and
slippery floors), and social and economic condition,
possibly leading to malnutrition or impossibility of
adapting the home to the patient’s needs (Hoffman
and Rodriguez, 2015).
Within NONCADO, a project funded by the
Lombardy Region, in Italy, we aim at preventing falls
of the elderly living alone at home. Living alone
implies a difficult or delayed detection of a possible
decline, that in turn may increase the risk of falling.
This motivated developing a system for detecting
changes in the individual’s fall risk by integrating
data coming from (1) wearable sensors, including
activity trackers, (2) environmental sensors, and (3)
clinical data that may be measured during the
patient’s medical appointments or gathered from the
patients’ medical record. Clinical data and
information on the subject’s lifestyle have been used
in past studies to develop several models for
quantifying the individual’s risk of falling.
In this work we focus only on models that can be
applied to non-hospitalized subjects, since they
represent the intended users of the NONCADO
system. This paper has two aims. The first aim is to
test the concordance of the different models in
assessing the risk of falling. The second aim is to
evaluate the predictive performance of the models on
a real-world patient population. We exploited data
from a set of patients treated at the “Casa di Cura
Privata del Policlinico Hospital” (CCPP), in Milan,
Italy, who underwent a 9 months follow-up study.
We believe that results of this work represent both
an alert about the generalizability of existing models,
and a first step for understanding the potentiality of
their combination and their integration with sensor-
based monitoring data, with the final goal of building
an overall risk score for the individual.
718
Salvi, E., Sterpi, I., Caronni, A., Tropea, P., Picardi, M., Corbo, M., Lanzola, G., Quaglini, S. and Sacchi, L.
Comparison of Models for Predicting the Risk of Falling in the Non-hospitalized Elderly and Evaluation of Their Performances on an Italian Population.
DOI: 10.5220/0009169207180723
In Proceedings of the 13th International Joint Conference on Biomedical Engineering Systems and Technologies (BIOSTEC 2020) - Volume 5: HEALTHINF, pages 718-723
ISBN: 978-989-758-398-8; ISSN: 2184-4305
Copyright
c
2022 by SCITEPRESS – Science and Technology Publications, Lda. All rights reserved

2 METHODS
A literature search has been performed for models able
to estimate the risk of falling of fragile people living at
home, that is significantly different from the risk of the
hospitalized elderly. Nine models were found, the
characteristics of which are summarized in Table 1.
The models differ in their eligibility criteria, in the set
of considered variables, and in the method used to
quantify the risk of falling. According to the used
method, we classified the models into three categories:
rule-based models, checklist models, and logistic
regression models. In particular, a rule-based (R)
model assigns a risk level (i.e., either “high risk” or
“low risk”) according to a set of rules, that can be
derived from a classification tree. In a checklist (C)
model, the risk score is computed as a weighted sum of
a set of fall risk factors. Based on the obtained score
and on a set of thresholds, the subject is assigned a risk
level. In logistic regression (L) models, which can be
considered as a subclass of checklist models, the risk
level is computed according to the results of a
multivariate logistic regression. The weights for the
variables included in the model are provided by the
estimated regression coefficients.
Table 1: Description of the considered predictive models.
Type and
eligibility
Included variables
(variable weight,
when a
pp
licable)
Risk score
and risk
level
1.
Type: C.
Adult people
with
neurological
problems
(Yoo et al.,
2015)
Cardiovascular disease
(2), falls in the latest
year (3), qualitative
evaluation of the
walking capability (2-
6), overestimation of
walking ability (7)
Range: 0-18
2.
Type: C
Age >= 60
years and
expected
life>= 6
months
(Whitney et
al., 2012)
Cognitive problems (1),
impulsivity or
confusion (1),
qualitative evaluation
of the walking
capability (1-2), falls in
the latest year (1),
anxiolytic therapy (1)
or antidepressant
therapy (1)
Range: 0-7
Levels:
0%
(score=1);
10%
(score=2);
23%
(score=3);
45%(score=
4); 62%
(score =5);
82%(score
6); 100%
(score =7)
3.
Type: R
Age >= 65
y
ears, no
Diet, age, BMI, fat
mass index, visual or
hearing problems,
Rule-based
levels:
“At risk”;
“Not at risk”
history of
falls, able to
walk alone
for 30
seconds
(Deschamps
et al., 2016)
balance alterations, foot
diseases
4.
Type: C
Age > 70
years, no
neurological
diseases
(Stalenhoef et
al., 2002)
Depression (male:4,
female:2), falls in the
latest year (male:6,
female:4), reduced grip
strength (male:6,
female:4), postural
sway abnormalities
(male:7, female:5)
Range: 0-23
Levels:
“High”
(score > 13);
“Moderate”
(score in 8-
13); “Low”
(score < 8)
5.
Type: R
Female > 65
years, need
for gait
assistance
(Lamb et al.,
2008)
Falls in the latest year,
qualitative evaluation
of the walking
capability, need for
assistance in daily
activities, BMI,
reduced knee muscle
strength, low gait spee
d
Rule-based
calculation
of fall
probability
6.
Type: L
Age> 65
years, history
of falls
(Askari,
2014)
Age, qualitative
evaluation of the
walking capability, fear
of falling, orthostatic
hypotension
Fall
probability
according to
the
regression
model
7.
Type: C
Age > 65
years
(Tromp et al.,
2001)
Falls in the latest year
(5), urinary
incontinence (3), visual
impairment (4), need
for assistance in daily
living (3)
Range: 0-15
Levels:
“High”
(score > x*);
“Low”
(score < x*)
8.
Type: C
Age > 65
years
(Pluijm et al.,
2006)
Falls in the latest year
(4; 6 if fear of falling),
dizziness (4), need for
assistance in daily
living (3), low grip
strength (3), weight (2),
fear of falling (2; 4 if
previous falls), pets (2),
education (1), alcohol
(1)
Range: 0-31
Levels:
“High
(score >
x*);
“Low”
(score < x*)
9.
Type: C
Age > 65
years
(Ivziku et al.,
2011)
Impulsivity/confusion
(4), depression (2),
urinary incontinence
(1), dizziness (1), male
(1), antiepileptic
therapy (2),
benzodiazepine therapy
(1), difficulty in getting
up from chair (1-4)
Range: 0-16
Levels:
“High”
(score >= 5);
“Low”
(score < 5)
* In the referenced paper, the authors show results for
different threshold values
Comparison of Models for Predicting the Risk of Falling in the Non-hospitalized Elderly and Evaluation of Their Performances on an Italian
Population
719

After considering the eligibility criteria, Model #3
(Deschamps et al., 2016) was left out from further
analyses, since it excludes patients with fall history,
who are the main target of our system.
2.1 Model Concordance
Our medical partners provided us with an
anonymized dataset of 123 patients aged over 60
years and having history of falls. Due to its
retrospective nature, this dataset did not contain all
the variables included in the considered models.
Nevertheless, 112 patients presented all the data
necessary to apply models 2, 7 and 9. To test also the
other models, we used a simulation approach. We
generated a population of 100,000 subjects, aged
between 65 and 85 years, by sampling variable values
according to their probability distribution. Those
distributions were derived from the literature, namely
from the papers presenting the 9 models, from a
review (Hofman et al., 2006), and from our real
dataset. Moreover, the simulation of patients
considered obvious constraints, to avoid, for example,
generating a case where the measured “walking
capability” is normal and the “subjective
overestimation of walking ability” is TRUE, or a case
where “Antidepressant drug” is TRUE and
“Depression” is FALSE. Similarly, all the other
constraints among the variables considered by the 9
models were taken into account.
For both populations, i.e., the simulated one and
the real one, we computed the number of patients
eligible for every model. In addition, we assessed the
concordance of the models in rating the patient’s risk.
More precisely, for each patient, we computed the
following variables:
n
p
= number of models the patient is eligible for;
n
1
= number of models predicting a “high risk” level;
n
0
= number of models predicting a “low risk” level
with n
p
=n
1
+n
0
. We combined these variables to assess
two parameters that quantify the concordance among
the models. In particular, considering all the n
p
predictions, each patient can be assigned an overall
risk label: “high risk” (in case n
1
> n
0
), “low risk”
(when n
1
<n
0
), or “Not available-NA” (when n
1
=n
0
).
To assess the label reliability, we calculated the
absolute quantity |n
1
- n
0
|, i.e. a measure of the
advantage of that label, compared to the other one.
By definition, the advantage is 0 for the NA label. In
addition, for each patient classified at high or low
risk, we computed the supporter models ratio, i.e. the
number of models assigning that label divided by n
p
.
The supporter models ratio ranges from 0 to 1.
Finally, we computed the Cohen Kappa
(McHugh, 2012) to test the concordance of all the
possible pairs of models in assigning the label. We
also computed the Fleiss coefficient (L. Fleiss, 1971),
which is the extension of the Cohen k in case of
multiple (>2) models. Well-accepted thresholds for k
and F (Table 2) were used to evaluate the obtained
coefficient values.
Table 2: Well accepted thresholds for the Cohen k and the
Fleiss coefficient.
Coefficient Range
Agreement among
models
Cohen k
< 0 No a
g
reement
[0-0.2]
Poor agreement
[0.21-0.4]
Fair agreement
[0.41-0.6]
Moderate agreement
[0.61-0.8]
Substantial agreement
[0.81–1]
Almost perfect
agreement
Fleiss
coefficient
< 0.4
N
o/poor a
g
reemen
t
[0.4-0.75]
Intermediate to good
a
g
reemen
t
> 0.75 Excellent a
g
reemen
t
2.2 Model Performance
After quantifying the concordance of the models, we
evaluated their performance in assessing the risk of
fall observed in the real patients, whose fall episodes
have been recorded in a 9 months follow-up study. As
anticipated, the dataset includes the complete set of
variables to run three out of the nine considered
models (models 2, 7 and 9 in Table 1). The three
models were used to compute three risk predictions
for each patient. In particular, since the three models
are checklists, each model assigns the subject a binary
fall risk prediction (i.e., “at risk” or not at risk)
according to a predefined threshold. For each model,
we then compared its prediction with the patient’s
follow-up outcome (i.e., either “fallen” or “not
fallen”), and we computed a set of performance
indicators, namely accuracy, Matthews correlation
coefficient (MCC), sensitivity (SE), specificity (SP),
positive predictive value (PPV), negative predictive
value (NPV), and area under the receiver operating
characteristic curve (AUC). For each model, we
adapted the timeframe of the analysis to the duration
of the follow-up study described by the authors of the
model. In particular, we considered the entire follow-
up period for models 2 and 7, and only the first
follow-up month for model 9. We compared the
obtained indicator values with the values reported by
the authors of the models, when available.
HEALTHINF 2020 - 13th International Conference on Health Informatics
720

3 RESULTS AND DISCUSSION
This section will first present the results in terms of
model concordance (considering both simulated and
real patients) and then in terms of the of the models’
predictive performance (for real patients only).
3.1 Model Concordance
In our experiments, agreement among the models in
assigning patients to a risk category was poor/fair.
The results for the two patient populations are
described in the following sections.
3.1.1 Simulated Patient Population
For each model, Table 3 reports the percentage of
eligible patients, and the percentage of patients
considered at high risk by the model.
Table 3: Fall risk classification per model.
Model
Percentage of eligible
patients
Percentage of
patients
considered at
risk
1 16.4 % 67.1 %
2 100 % 24.4 %
4 64.3 % 1.7 %
5 40 % 13.7 %
6 100 % 20.3 %
7 100 % 28.6 %
8 100 % 79.4 %
9 100 % 45.9 %
Even excluding those models that show specific
eligibility criteria (i.e., Model 1, 4, and 5), Table 3
highlights that the percentage of patients considered
at risk varied significantly between the different
models.
Table 4: Cohen k for each pair of models when applied to
the simulated dataset.
2 4 5 6 7 8 9
1 0.24 0 0.07 0.11 0.033
-
0.004
0.00
1
2 - 0.26 0.20 0.07 0.24 0.05 0.24
4 - - 0.24
0.00
5
0.03 0.008
0.00
8
5 - - -
0.00
3
0.30 0.05
0.00
3
6 - - - -
0.000
6
-
0.000
4
-
0.00
1
7 - - - - - 0.11 0.03
8 - - - - - - 0.06
On average, 6 out of the 8 models were applicable
to each patient. As regards the label reliability, the
average advantage was 2.65 (±1.7). Excluding
patients with the NA label (i.e., 11% of the sample),
the average supporter models ratio was 0.74 (±0.13).
Thus, when an informative label was assigned to the
patient, its support was on average satisfactory.
As regards the concordance of the models in
rating the patient’s risk, Table 4 shows the Cohen k
for all the possible pairs of models.
The obtained k values on the simulated dataset
ranged from -0.0045 to 0.3, with a mean value of
0.085. Thus, according to Table 2, the best achieved
concordance is “fair agreement”. In particular,
models 5 and 7 were the most concordant with a k
value of 0.3. We found 5 models applicable to all
patients, and for them we computed the Fleiss
coefficient, which was negative, indicating lack of
concordance between models, as expected from the
obtained paired k values.
3.1.2 Real-world Patient Population
As previously mentioned, only 3 models (i.e., models
2, 7, and 9) could be applied on the real patients’ data.
The k coefficients obtained for each pair of models
are listed in Table 5. The obtained Fleiss coefficient
was negative, as on the simulated population.
Table 5: Cohen k for each pair of models when applied to
the real-world dataset.
2 7 9
2 - 0.31 0.43
7 -- 0.18
The results in terms of k and F coefficient confirm the
poor/fair agreement among the models, except for the
pair composed by model 2 and model 9, which were
more concordant on this dataset. This higher
concordance could be due to differences in the
characteristics of the patient populations. For
example, all the real patients had a history of falls and
showed moderate or severe impairment in walking
ability. This could suggest that the considered models
may perform differently based on the considered
population.
3.2 Model Performance
When comparing the models’ predictions with the
observed outcome in terms of occurred falls, we
obtained the results shown in Table 6. In addition to
listing the values obtained for the performance
indicators, Table 6 describes the performance of the
Comparison of Models for Predicting the Risk of Falling in the Non-hospitalized Elderly and Evaluation of Their Performances on an Italian
Population
721
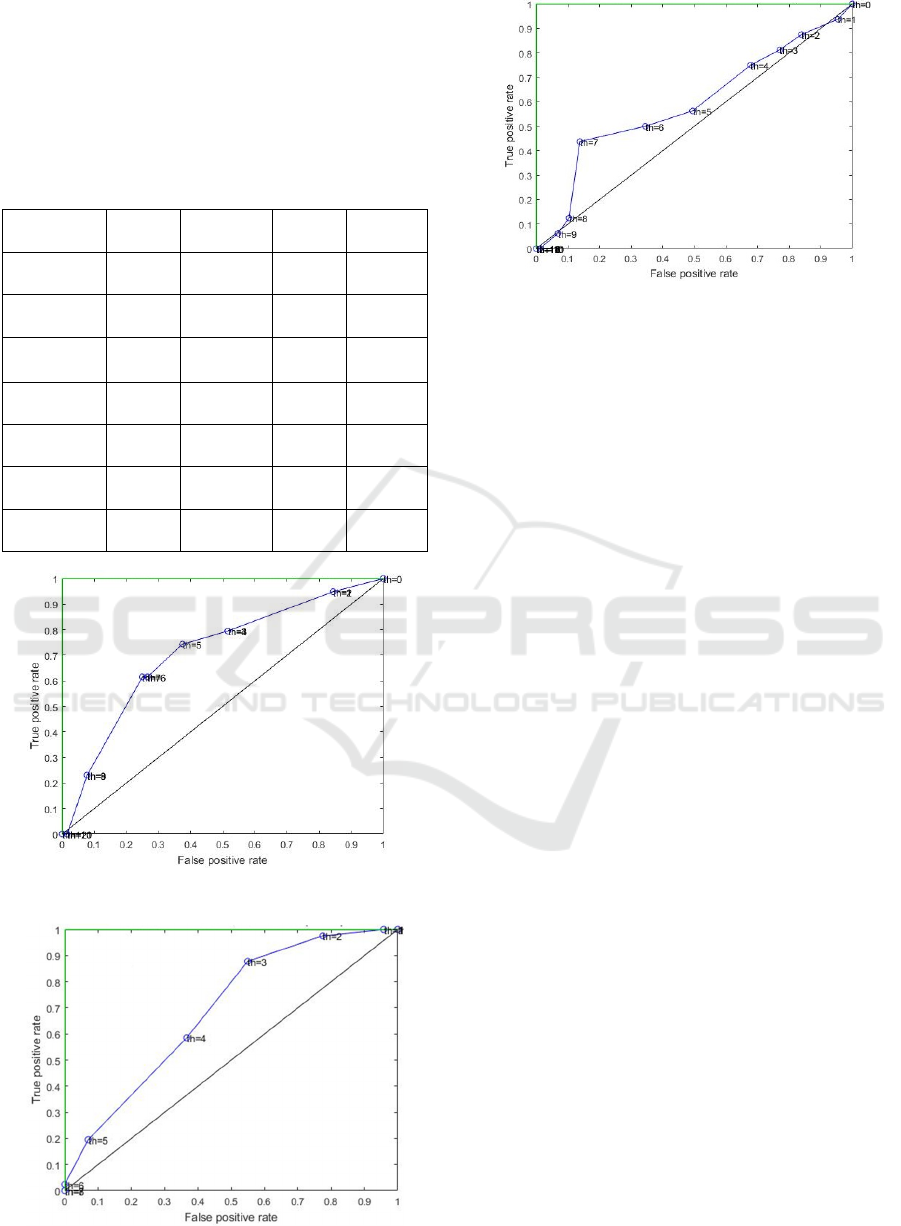
majority classifier (MC) on the same dataset. The
performance indicators reported by the authors of the
model are shown in brackets when available (NA= not
available). The receiver operating characteristic (ROC)
curves of the three models are shown in Figure 1-
Figure 3.
Table 6: Predictive performances observed by applying the
three models and a majority classifier to the CCPP dataset.
Indicator
Model
2
Model
7
Model
9
MC
Accuracy
0.62
(NA)
0.67
(NA)
0.51
(NA)
0.63
MCC
0.21
(NA)
0.31
(NA)
0.05
(NA)
NA
AUC
0.69
(0.79)
0.69
(0.65)
0.59
(0.71)
0.5
SE
0.59
(
NA
)
0.62
(
NA
)
0.56
(
0.86
)
0
SP
0.63
(NA)
0.7 (NA)
0.51
(0.43)
1
PPV
0.48
(NA)
0.56
(NA)
0.17
(0.11)
NA
NPV
0.73
(
NA
)
0.75
(
NA
)
0.86
(
0.97
)
0.63
Figure 1: ROC curve obtained for Model 2.
Figure 2: ROC curve obtained for Model 7.
Figure 3: ROC curve obtained for Model 9.
4 CONCLUSIONS
In this work, we considered nine literature models for
predicting the risk of fall in the elderly, and we tested
their concordance in stratifying a patient population in
terms of such risk. We performed the analysis on
model concordance both on a simulated patient
population and on an Italian real patient population.
Using the real-world population, we also assessed the
models’ predictive performances according to reports
of the subject’s falls collected in a 9 months follow-up
study.
Our results highlighted the difficulty in stratifying
the elderly based on their risk of falling. In particular,
agreement among the different models in predicting
the patient’s risk was poor or fair. Besides being poor,
the level of agreement seemed to vary based on the
characteristics of the considered population. Overall,
the predictive performance on the real-world dataset
was poor, although models 2 and 7 performed better
than the majority classifier, as shown in Table 6. The
poor performance may be due to ignoring informative
clinical variables (e.g. walking speed, specific clinical
tests) that are not considered in these three models,
since they are targeted to non-hospitalized patients
(while those variables are usually collected only at the
hospital). The performance might also have been
negatively influenced by the characteristics of the
population, since all our patients had history of falls.
This is a limitation of our work, and it will be necessary
to assess whether these models perform better on the
elderly who have not experienced any fall yet. Another
limitation is that we used a simulated population,
which of course could differ from a real one.
Despite those limitations, from our results it is
clear that using fall risk models for non-hospitalized
patients, both as single models or a combination of
them, should be very cautious, particularly for
HEALTHINF 2020 - 13th International Conference on Health Informatics
722

populations that are different from the one used to
develop such models. Thus, there is the need for
developing more accurate and generalizable models.
Further work will then focus on improving the fall
prediction by including into the models more
informative variables that nowadays may be collected
at home, thanks to unobtrusive technologies, and
easily integrated with the hospital medical record. For
example, wearable sensors can be used to collect data
on the subject’s sleep quality and physical activity,
sensorized carpets may monitor worsening of a set of
gait parameters, mobile applications may allow the
patient to report his/her symptoms. Of course, these
kinds of data will be affected by higher noise with
respect to data collected in a clinical environment,
and we do not aim at using them for diagnostic
purposes. However, they may be profitably used for
monitoring purposes, and they may complement the
patient’s medical record to build a comprehensive
risk score for the individual subject.
REFERENCES
Askari, M., 2014. Improving quality of fall prevention and
management in elderly patients using information
technology: The impact of computerized decision
support. Retrieved from http://dare.uva.nl/search?
identifier=872ded52-66dd-4cc2-8cdf-0cfbf8b6d63d
Deschamps, T., Le Goff, C. G., Berrut, G., Cornu, C., and
Mignardot, J.-B., 2016. A decision model to predict the
risk of the first fall onset. Experimental Gerontology,
81, 51–55. DOI: 10.1016/j.exger.2016.04.016
Hoffman, G. J., and Rodriguez, H. P., 2015. Examining
Contextual Influences on Fall-Related Injuries Among
Older Adults for Population Health Management.
Population Health Management, 18(6), 437–448. DOI:
10.1089/pop.2014.0156
Hofman, A., de Jong, P. T. V. M., van Duijn, C. M., and
Breteler, M. M. B., 2006. Epidemiology of neurological
diseases in elderly people: what did we learn from the
Rotterdam Study? The Lancet. Neurology, 5(6), 545–
550. DOI: 10.1016/S1474-4422(06)70473-2
Ivziku, D., Matarese, M., and Pedone, C., 2011. Predictive
validity of the Hendrich fall risk model II in an acute
geriatric unit. International Journal of Nursing Studies,
48(4), 468–474. DOI: 10.1016/j.ijnurstu.2010.09.002
L. Fleiss, J., 1971. Measuring Nominal Scale Agreement
Among Many Raters. Psychological Bulletin, 76, 378.
DOI: 10.1037/h0031619
Lamb, S. E., McCabe, C., Becker, C., Fried, L. P., and
Guralnik, J. M., 2008. The optimal sequence and
selection of screening test items to predict fall risk in
older disabled women: the Women’s Health and Aging
Study. The Journals of Gerontology. Series A,
Biological Sciences and Medical Sciences, 63(10),
1082–1088.
McHugh, M. L., 2012. Interrater reliability: the kappa
statistic. Biochemia Medica, 22(3), 276–282.
Pluijm, S. M. F., Smit, J. H., Tromp, E. a. M., Stel, V. S.,
Deeg, D. J. H., Bouter, L. M., and Lips, P., 2006. A risk
profile for identifying community-dwelling elderly
with a high risk of recurrent falling: results of a 3-year
prospective study. Osteoporosis international: a journal
established as result of cooperation between the
European Foundation for Osteoporosis and the National
Osteoporosis Foundation of the USA, 17(3), 417–425.
DOI: 10.1007/s00198-005-0002-0
Stalenhoef, P. A., Diederiks, J. P. M., Knottnerus, J. A.,
Kester, A. D. M., and Crebolder, H. F. J. M., 2002. A
risk model for the prediction of recurrent falls in
community-dwelling elderly: a prospective cohort
study. Journal of Clinical Epidemiology, 55(11), 1088–
1094.
Tromp, A. M., Pluijm, S. M., Smit, J. H., Deeg, D. J.,
Bouter, L. M., and Lips, P., 2001. Fall-risk screening
test: a prospective study on predictors for falls in
community-dwelling elderly. Journal of Clinical
Epidemiology, 54(8), 837–844.
Whitney, J., Close, J. C. T., Lord, S. R., and Jackson, S. H.
D., 2012. Identification of high risk fallers among older
people living in residential care facilities: a simple
screen based on easily collectable measures. Archives
of Gerontology and Geriatrics, 55(3), 690–695. DOI:
10.1016/j.archger.2012.05.010
Yoo, S.-H., Kim, S. R., and Shin, Y. S., 2015. A prediction
model of falls for patients with neurological disorder in
acute care hospital. Journal of the Neurological
Sciences, 356(1–2), 113–117. DOI: 10.1016/
j.jns.2015.06.027
Comparison of Models for Predicting the Risk of Falling in the Non-hospitalized Elderly and Evaluation of Their Performances on an Italian
Population
723
