Terahertz Reflection Imaging of Paraffin-embedded Human Breast
Cancer Samples: Some First Results
Mohamed Boutaayamou, Delphine Cerica and Jacques G. Verly
Department of Electrical Engineering and Computer Science, University of Liège, Liège, Belgium
Keywords: Terahertz Imaging, Breast Cancer, Paraffin-embedded Sample, Terahertz Absorbance.
Abstract: Several studies have shown that terahertz (THz) pulsed imaging has the potential of identifying the margins
of human breast cancer in paraffin-embedded tissue samples. Before using this technique for the assessment
of cancer margins during breast-conserving surgery, it is important to study the validity and reproducibility
of previously published results. In the present paper, we describe some first results in the characterization of
paraffin-embedded human breast cancer tissue through THz reflection imaging based on measurements
provided by a newly acquired THz time-domain spectrometer. First, we measured the THz reflection impulse
response of these samples using this spectrometer. Second, we processed, for one selected breast cancer tissue
sample, the recorded data to generate preliminary images of (1) several maps of parameters extracted in the
time- and frequency-domains, and (2) a map of the absorbance.
1 INTRODUCTION
One of the promising application of terahertz pulsed
imaging (TPI) is the characterization of biological
tissues, where terahertz (THz) means 10
12
Hz. In
particular, TPI has shown potential for identifying
human breast cancer during breast-conserving
surgery (Fitzgerald et al., 2006; Yu et al., 2012).
A key issue with this surgery is the more than 20%
rate of re-operation after postoperative
histopathological analysis of the cancer resection
margins (Jacobs, 2008). This rate results from the
current lack of accurate intraoperative cancer margins
assessment tools.
As a member of the TERA4ALL project consortium
that aims to promote THz technology applications
across the Walloon Region of Belgium, our group
investigates the use and validation of TPI in breast
cancer margins assessment, in the context of reducing
the re-operation rate of a breast-conserving surgery.
Previous studies (Fitzgerald et al., 2006; Ashworth
et al., 2009; Hassan et al., 2012; Bowman et al., 2017)
have already presented promising results of significant
contrast between normal and cancerous breast tissues
when TPI is applied to freshly excised or dehydrated
paraffin-embedded (PE) samples.
Although the water content of the tissue has been
shown to contribute significantly to the tissue’s optical
properties in the THz range, it has been suggested that
the interaction of THz radiation with this tissue may also
be sensitive to other factors, such as the tissues structure,
the cell density, and the presence of certain proteins
(Fitzgerald et al., 2006). These factors could explain
why imaging contrast between different tissue regions
can also be demonstrated for dehydrated samples
(Bowman et al., 2017).
In this paper, we describe some first results in the
characterization of PE human breast cancer tissue
samples through TPI in reflection mode using
measurements obtained by a newly acquired THz
time-domain (TD) spectrometer (Fig. 1).
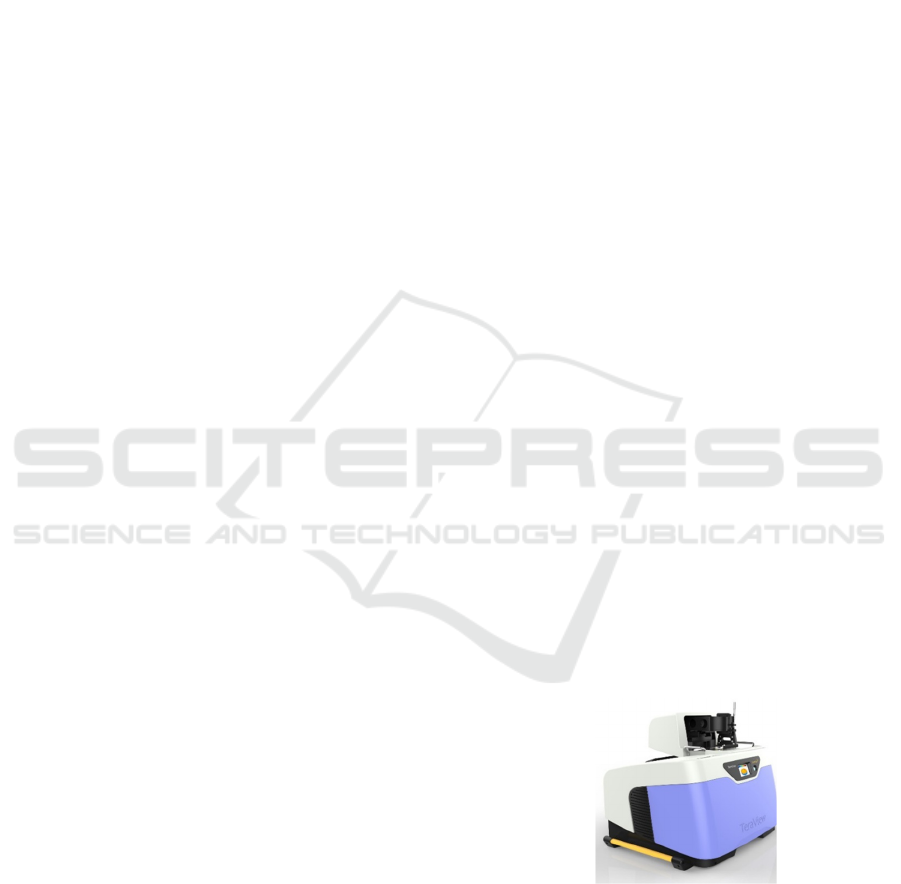
Figure 1: Picture of the THz time-domain spectrometer
TeraPulse 4000 (TeraView Ltd, Cambridge, UK).
There are two motivations for the choice of
considering these samples for this first stage of
research. First, they are easy to obtain (from
biobanks), to carry, and to store. Second, additional
testing on PE human breast cancer samples would be
200
Boutaayamou, M., Cerica, D. and Verly, J.
Terahertz Reflection Imaging of Paraffin-embedded Human Breast Cancer Samples: Some First Results.
DOI: 10.5220/0009163302000203
In Proceedings of the 13th International Joint Conference on Biomedical Engineering Systems and Technologies (BIOSTEC 2020) - Volume 2: BIOIMAGING, pages 200-203
ISBN: 978-989-758-398-8; ISSN: 2184-4305
Copyright
c
2022 by SCITEPRESS – Science and Technology Publications, Lda. All rights reserved
required in order (1) to investigate the reproducibility
of previously published results, (2) to potentially
improve the methodology used to obtain these results,
and (3) to provide a better understanding of the origin
of contrast in TPI without the presence of water in the
tissue samples.
2 EXPERIMENT & METHOD
PE human breast tissue samples of various
thicknesses (10, 20, 30, and 50 µm), containing both
normal and cancerous regions, were provided by the
Biobank of the University Hospital of Liège
(Biothèque Hospitalo-Universitaire de Liège). The
present study was approved by the local ethics
committee of the University of Liège, Liège, Belgium
(Ref: 2017/175).
We used the THz TD spectrometer TeraPulse
4000 (TeraView Ltd, Cambridge, UK) to record the
impulse response (IR) of theses samples in open air
(Fig. 1). The experimental setup is schematically
represented in Fig. 2.
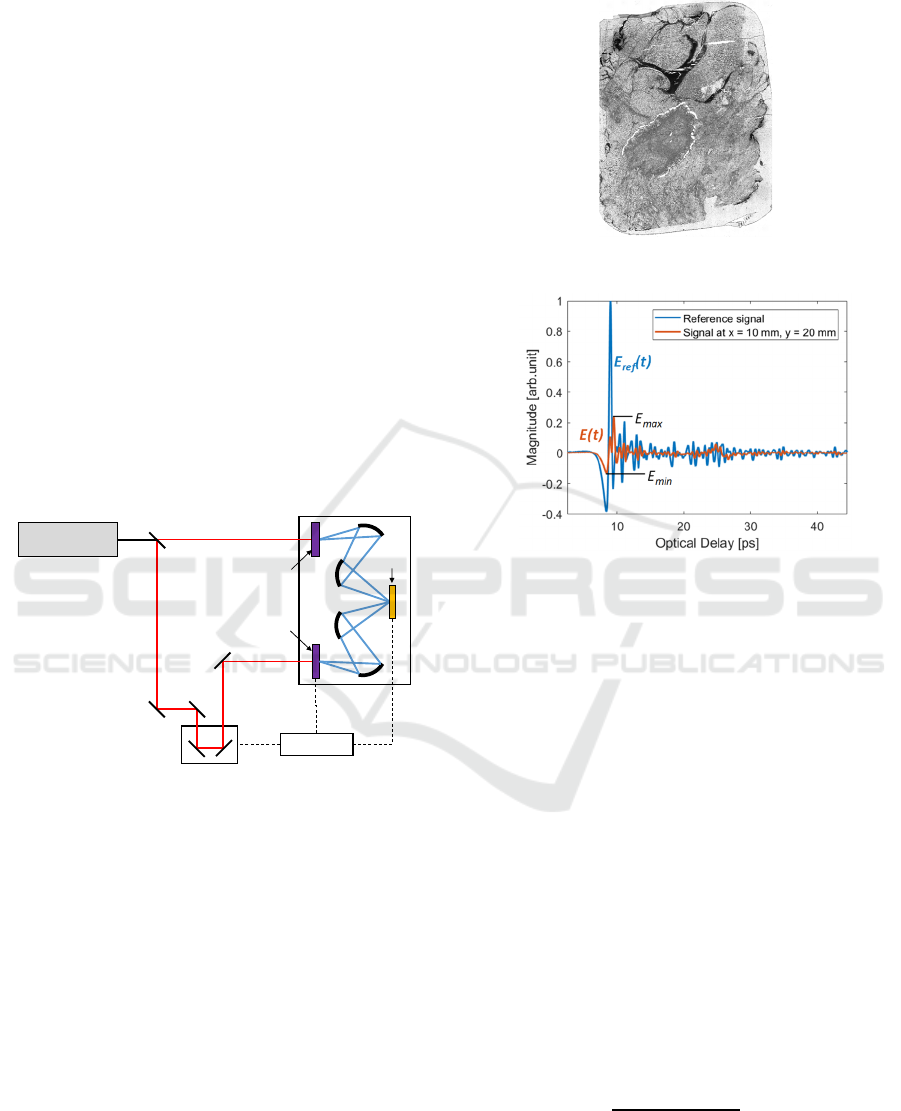
Figure 2: Schematic diagram of the experimental setup used
to measure the reflection THz IR of the sample.
The samples were mounted on glass slides. Thus, we
used the THz TD spectrometer in reflection mode as
THz radiation is strongly attenuated in glass. Prior to
scanning each sample, the reference IR (i.e., no sample
in the THz beam) was recorded from a gold-coated
alignment mirror (not shown in Fig. 1).
A sample of interest was then scanned point-by-
point in two orthogonal directions characterized by x-
and y-coordinates using a mapper unit (not shown in
Fig. 1). The scanning produced at each scan point a
full IR (signal), referred to as the measurement at this
point. The spatial scan step was 200 µm in each
direction. In addition, we used the TeraPulse software
to apply a fast Fourier transform (FFT) to the IR
obtained at each scan point, yielding the associated
frequency response (FR).
Figure 3: Picture of a 50 µm-thick sample.
Figure 4: Example of a recorded IR of the sample, in red,
and the recorded reference IR (using a gold-coated
alignment mirror), in blue.
In this paper, we consider the results from the
50 µm-thick sample shown in Fig. 3. Fig. 4 shows an
example of (1) a recorded reflected THz IR from the
surface of this sample and (2) the corresponding
reference IR.
We extracted several parameters both from the IR
recorded directly in the TD and from the FR
computed in the frequency-domain (FD). These
parameters are described later.
For each TD (respectively FD) parameter, we
assigned the parameter value at each measurement
point to a pixel in an image in order to create a THz
TD (respectively FD) image of this parameter.
We obtained the preliminary THz images by
assigning the following TD and FD parameters to each
pixel (corresponding to a measurement point):
• The normalized amplitude of the sample IR at a
given optical delay 𝑡
, i.e.,
𝐸
𝑡
max
|𝐸
𝑡
, (1)
where
𝐸
𝑡
is the amplitude of the IR (at the
measurement point of interest (Fig. 4)).
Computer
THz receiver
THz emitter
Sample
Optical delay line
Femtosecond
pulsed laser
Terahertz Reflection Imaging of Paraffin-embedded Human Breast Cancer Samples: Some First Results
201
• The normalized peak-to-peak amplitude of the
sample IR (Fig. 4), i.e.,
𝐸
−𝐸
max
|𝐸
−𝐸
.
(2)
• The normalized magnitude of the sample FR at a
given frequency 𝑓, i.e.,
𝐴
𝑝𝑖𝑥𝑒𝑙
𝑓
max
|𝐴
𝑝𝑖𝑥𝑒𝑙
𝑓
|
,
(3)
where
𝐴
𝑓
is the magnitude of the sample FR (at
a given measurement point of interest).
• The absorbance of the sample at a given
frequency 𝑓, is calculated using the Beer-
Lambert relation, i.e.,
−log
𝐴
𝑝𝑖𝑥𝑒𝑙
𝑓
𝐴
𝑟𝑒𝑓
𝑝𝑖𝑥𝑒𝑙
𝑓
,
(4)
where 𝐴
𝑓
is the magnitude of the reference FR
(obtained from the reference IR).
3 RESULTS & DISCUSSION
Figures 5-8 depict preliminary THz reflection images
of the aforementioned TD and FD parameters for the
50 µm-thick PE sample. These parameters are given
in arbitrary units ([a.u.]) or without units in the case
of the absorbance ([-]).
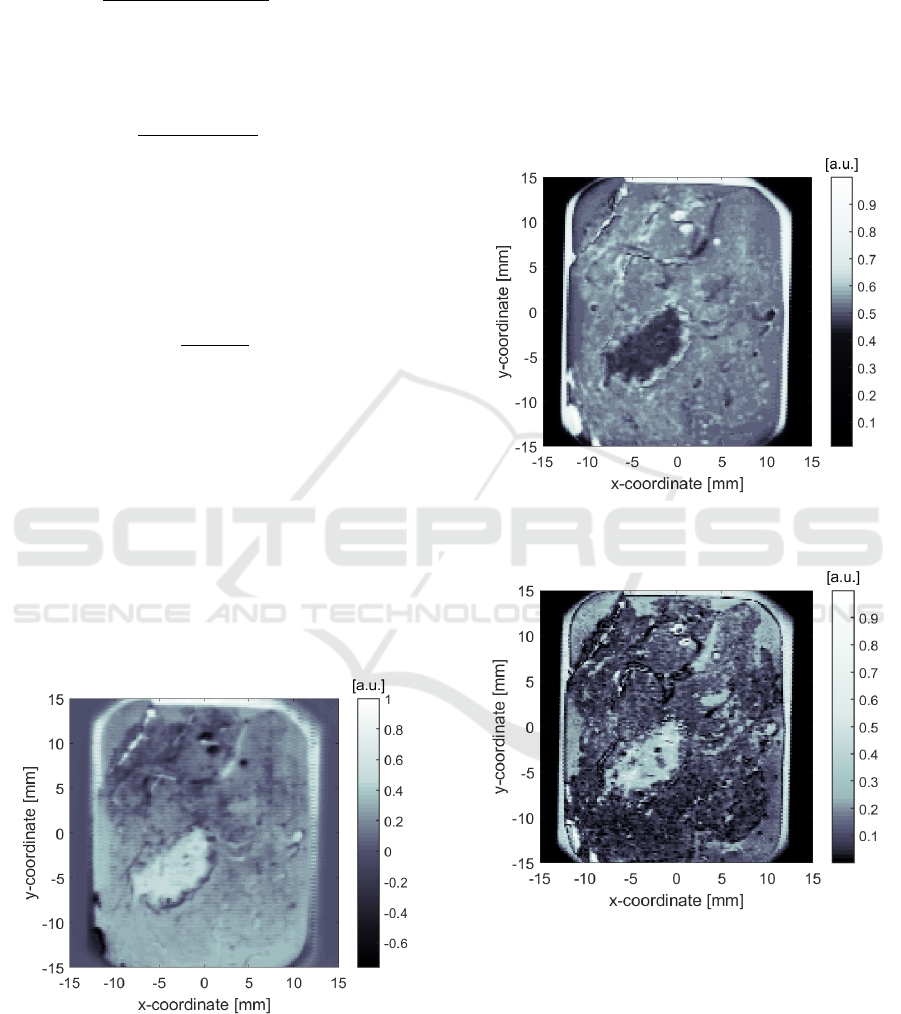
Figure 5: THz TD image obtained using the normalized
amplitude of the IR at optical delay 𝑡
of 9 ps, as defined
by Eq. (1).
Contrasted regions in the images allow one to
distinguish (1) areas of the glass slide with and
without a sample, (2) paraffin alone versus excised
PE tissue areas, and (3) some defects associated with
the sample (such as cracks and regions where the
paraffin had detached from the glass slide).
In addition, one can observe, in the images,
interesting contrasted regions that may correlate with
different types of tissue inside the excised tissue area.
A rigorous comparison with a histopathological
analysis is required before drawing any conclusion on
the potential meaning of these contrasted regions.
Figure 6: THz TD image obtained using the normalized
peak-to-peak amplitude of the IR, as defined by Eq. (2).
Figure 7: THz FD image obtained using the normalized
magnitude of the FR at 2.5 THz, as defined by Eq. (3).
BIOIMAGING 2020 - 7th International Conference on Bioimaging
202
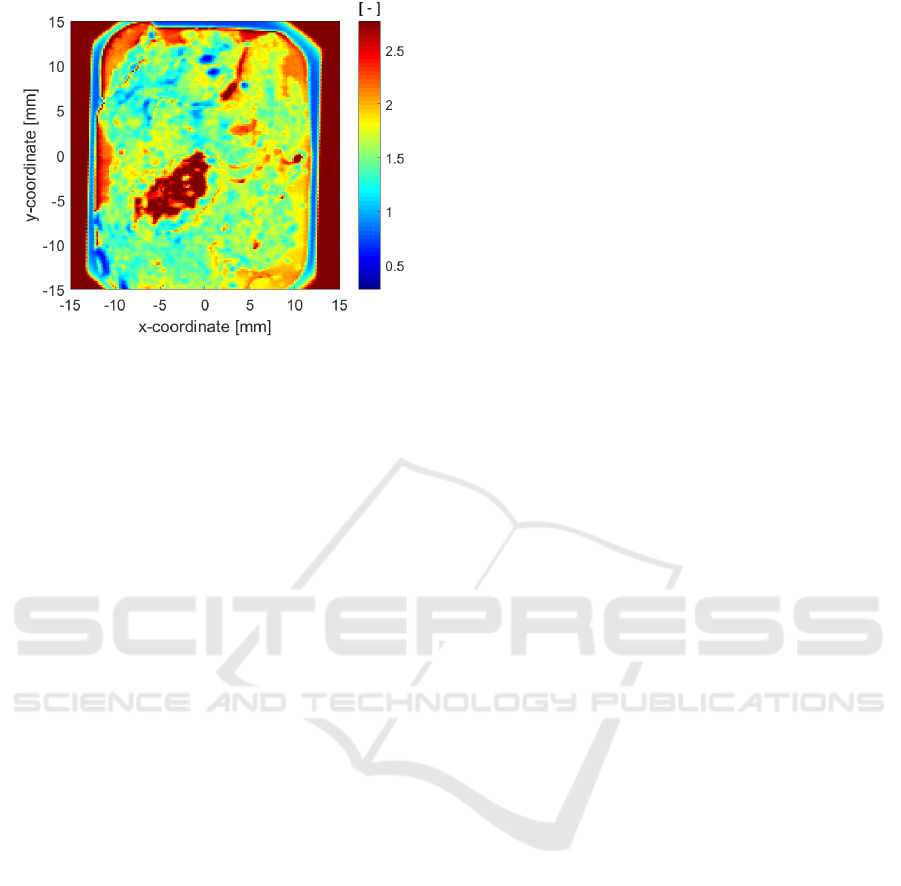
Figure 8: THz FD image of absorbance at 1 THz, as defined
by Eq. (4).
4 CONCLUSION & FUTURE
WORK
This paper shows preliminary THz images generated
from the THz reflection IR of excised PE human
breast cancer tissue samples on glass slides,
experimentally measured in open air using a newly
acquired THz TD spectrometer. Although contrasted
regions were identified, one would need to further
interpret these images by comparing them to the
results of a histopathological analysis.
Future work includes (1) the use of the THz TD
spectrometer with water-free (nitrogen-purged)
sample compartment for future measurements, (2) the
validation of contrasted regions by correlation with a
histopathological analysis, (3) the use of a different
sample slide material with low THz absorption
coefficient allowing TPI in transmission mode, (4)
TPI of fresh animal tissue and of fresh tissue
phantoms to characterize the optical properties of
these materials in the THz range before testing
valuable freshly-excised human breast cancer
samples, and (5) the development of signal-
processing algorithms dedicated to the assessment of
breast tumor margins.
ACKNOWLEDGEMENTS
This work was performed as part of the project
TERA4ALL which is funded by European Regional
Development Fund (ERDF) and Wallonia.
ABBREVIATIONS
The following abbreviations are used in this paper:
TPI Terahertz pulsed ima
g
in
g
.
THz Terahertz, 1 THz=10
12
Hz.
PE Paraffin-embedded.
TD Time-domain.
FD Frequenc
y
-domain.
IR Impulse response.
FR Frequenc
y
response.
REFERENCES
Ashworth P.C., Pickwell-MacPherson E., Provenzano E., et
al. (2009). Terahertz pulsed spectroscopy of freshly
excised human breast cancer. Optics Express, vol 17,
pp. 12444-12454.
Bowman T., Wu, Y., Gauch, J. et al. (2017). Terahertz
imaging of three-dimensional dehydrated breast cancer
tumors. Journal of Infrared, Millimeter, and Terahertz
Waves, vol. 38, pp. 766-786.
Biothèque Hospitalo-Universitaire de Liège - University
Hospital of Liège, Belgium.
Fitzgerald A.J., Wallace V.P., Pye R., et al. (2004).
Terahertz Imaging of Breast Cancer, a Feasibility
Study. In Conference Digest of the 2004 Joint 29
th
International Conference on Infrared and Millimeter
Waves and 12
th
International Conference on Terahertz
Electronics, pp. 823-824.
Hassan A.M., Hufnagle D.C., El-Shenawee M., et al.
(2012). Terahertz imaging for margin assessment of
breast cancer tumors. Microwave Symposium Digest,
IEEE MTT-S International, pp. 1-3.
Jacobs L., (2008). Positive margins: the challenge continues
for breast surgeons. Annals of Surgical Oncology, vol.
15, no. 5, pp. 1271-1272.
Yu C., Fan S., Sun Y., et al. (2012). The potential of
terahertz imaging for cancer diagnosis: a review of
investigations to date. Quantitative Imaging in
Medicine and Surgery, vol. 2, pp. 33-45.
Terahertz Reflection Imaging of Paraffin-embedded Human Breast Cancer Samples: Some First Results
203
