
The Myth of 10,000 Steps: A New Approach to Smartphone-based
Health Apps for Supporting Physical Activity
Tom Ulmer, Edith Maier and Ulrich Reimer
Institute for Information & Process Management, University of Applied Sciences St. Gallen,
Rosenbergstrasse 59, St. Gallen, Switzerland
Keywords: Pedometer, Physical Activity, Physical Activity Goal, Mobile Health, Behaviour Change Support System.
Abstract: This paper introduces an alternative approach to conventional pedometer apps which measure the wide-spread
goal of 10,000 steps a day. Instead we focus on the intensity of physical activity, which is in line with recent
recommendations of renowned health institutions such as the WHO. These promote a minimum of moderate
to vigorous physically active time per week to achieve the desired health benefits. The paper discusses how
the guidelines have been implemented. It also outlines how we help maintain user motivation over time (e.g.
by integrating and personalising "nudges") and how we intend to solve the challenges posed by different
fitness levels and personal lifestyles.
1 INTRODUCTION
The importance and the positive effects of regular
physical activity (PA) are well known and have been
confirmed in many studies (e.g. Warburton et al.,
2006, Piercy et al., 2018). In developed countries,
around 1% to 3% of the total health care costs can be
attributed directly to physical inactivity. The indirect
costs are likely to be more than double of the direct
costs (Pratt et al., 2014). Encouraging people to
engage in more PA is a global priority to reduce the
burden of noncommunicable disease (World Health
Organization, 2015).
PA can take on many different forms, e.g.
walking, running, hiking, cycling, swimming, yoga,
resistance training etc. The more complex the
movement, the more difficult it is to track and
monitor. For walking and running, a smartphone with
an accelerometer is sufficient. For more complex
activities a combination of several sensors worn on
the body or placed in the environment are necessary
(Dernbach et al., 2012).
Pedometer apps (pure step counters) and running
apps are wide-spread. The Runtastic app, for
example, has over 300 million downloads (Adidas
Runtastic. 2019), the app “Pedometer – Step Counter”
has over 30 million downloads (Pedometer - Step
Counter - Apps on Google Play, n.d.). Moreover,
brisk walking, jogging and running are among the
most popular sports in the world and have a
significant impact on health and longevity (Lee et al.,
2017).
People who use such apps tend to be much more
active than non-users and have a lower body mass
index (BMI) (Litman et al, 2015). App-based
interventions aimed at encouraging PA have shown
significant health improvements for children and
adults (Schoeppe et al, 2016). The evidence to
support the health benefits of regular physical activity
has become increasingly compelling (see e.g.
Department of Health and Social Care, 2019).
However, most PA apps that are currently
available, have some severe deficits, especially those
which promote activities such as running or walking.
These are regarded as the most basic activities to
achieve an active lifestyle and are therefore also
recommended by international health organisations.
On the whole, current apps tend to rely on the wide-
spread goal of completing 10,000 steps per day. Such
a goal may be easy to implement in technical terms,
but rather hard to incorporate into an average user’s
everyday life. Moreover, this activity goal is quite
controversial among experts who doubt that counting
steps is the best approach towards an active lifestyle
(Wattanapisit & Thanamee, 2017).
This paper describes an alternative approach to
supporting an active lifestyle which is not based on
the numbers of steps per day. Our approach is based
on the most recent recommendations, for example the
Department of Health and Social Care (2019). These
Ulmer, T., Maier, E. and Reimer, U.
The Myth of 10,000 Steps: A New Approach to Smartphone-based Health Apps for Supporting Physical Activity.
DOI: 10.5220/0009142106410647
In Proceedings of the 13th International Joint Conference on Biomedical Engineering Systems and Technologies (BIOSTEC 2020) - Volume 5: HEALTHINF, pages 641-647
ISBN: 978-989-758-398-8; ISSN: 2184-4305
Copyright
c
2022 by SCITEPRESS – Science and Technology Publications, Lda. All rights reserved
641
guidelines recommend moderate aerobic exercise for
150 minutes a week or vigorous aerobic exercise for
at least 75 minutes a week. Section 2 describes the
shortcomings of the currently available apps which
are mostly based on the 10,000 steps per day. In
Section 3 we present our alternative approach which
aims at overcoming these shortcomings and which
also tackles the problem related to incorporating
regular PA into a user’s everyday life. Section 4
discusses how we are evaluating the app and see how
its impact differs from apps with conventional
features. Section 5 outlines some challenges to target
in future work and possible solutions.
2 SHORTCOMINGS OF
EXISTING APPS SUPPORTING
PHYSICAL ACTIVITY
Most of the currently available apps for tracking
activity including smartwatches and electronic
pedometers promote the widespread and well-known
goal of 10,000 steps per day. The origin of this marker
goes back to a Japanese pedometer nicknamed
“Manpo-kei” which can be translated as “10,000
steps meter” (Tudor-Locke & Bassett, 2004). There is
some scientific evidence that 10,000 steps/day may
have health benefits (Kang et al., 2009). However, to
integrate that step goal into one’s everday life is
challenging. Moreover, counting steps does not
represent an exact and scientific way to measure
energy expenditure. Neither is it in line with widely
approved international health recommendations
which focus on accumulated time of moderate to
vigorous physical activity (MVPA) in the course of a
week.
Walking 10,000 steps per day does not guarantee
that past nor current PA recommendations have been
met (Le-Masurier, 2003). Several approaches have
been tried in a variety of projects to achieve the daily
10,000 steps’ goal, largely without success. Most
people fail to reach that goal, missing on average
approximately 4000 steps (Choi et al., 2007). An
additional six hours and forty minutes of walking
would be necessary per week to reach the 10,000
steps’ goal (70 steps/min).
This corresponds to the factor of 2.5 of the
metabolic equivalent of task (MET), an objective
measure of energy expenditure. One MET is the
equivalent of the energy cost of sitting quietly. Based
on a cadence of 100 steps per minute to reach a
moderate intensity level, i.e. MET level 3.5, it would
be enough to do 3000 steps in 30 minutes on five days
a week instead (Tudor-Locke et al., 2018; Hendelman
et al., 2000). The threshold for vigorous PA is about
130 steps per minute, which is the equivalent of 6
MET (Tudor-Locke et al., 2018).
Instead of aiming for 10,000 steps a day with
questionable impact on one’s health it would be
possible to reach the recommended health goals based
on intensity with an equivalent of about 3000 steps
within 30 minutes on five days per week. Other
studies found that 6500 to 8500 steps per day would
suffice to achieve the recommended amount of PA
energy expenditure (Ayabe et al., 2008), which
however does not consider intensity.
All quantitative goals, be it just counting 10,000
steps per day or simply adapting the goal posts in line
with the number of steps already performed – a
common practice in many apps -, fall short of the
current health recommendations. This is due to the
fact that they fail to take into account the intensity and
thus the quality of the PA.
Although gamification elements and social
support, e.g. the interaction with peers, can contribute
to maintain people’s motivation to use a PA app, this
tends to decline considerably over time and adherence
is marked by high variability (Marin et al., 2019;
Ryan et al., 2017). The effects of step counting apps
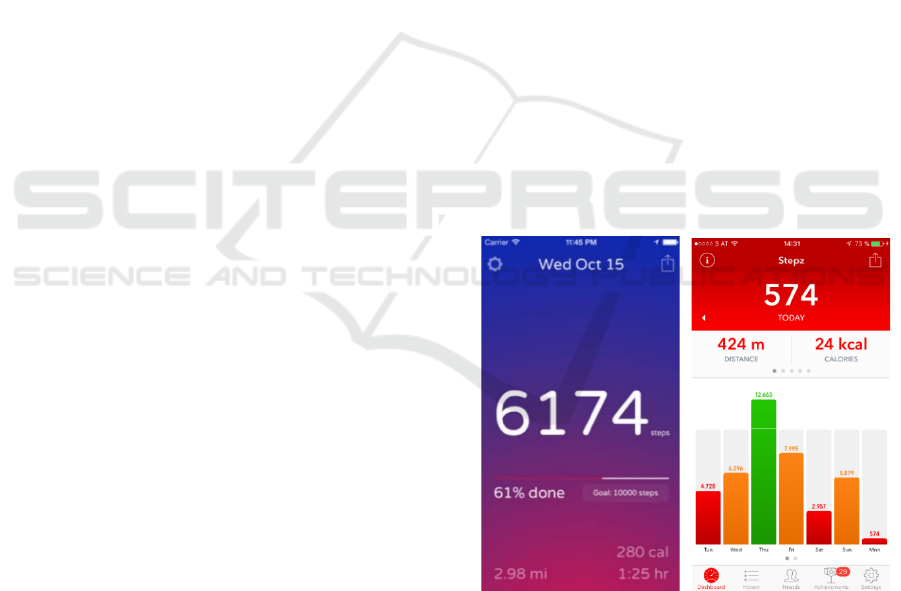
such as those shown in Figure 1 are modest at best
(Bort-Roig et al, 2014, Coughlin et al., 2016).
Figure 1: Two typical pedometer apps with 10,000 steps
goal (Steps, Stepz).
3 ALTERNATIVE APPROACH TO
APPS SUPPORTING PHYSICAL
ACTIVITY
We intend to overcome the shortcomings of typical
HEALTHINF 2020 - 13th International Conference on Health Informatics
642
apps promoting physical activity by designing and
implementing a new approach.
3.1 Design Principles
As already said, pedometer apps which just count
steps are available in huge numbers. To our
knowledge, however, there are no apps which focus
on the intensities recommended for physical activity.
Whilst counting steps is rather trivial, incorporating
measurements and goals based on intensities is far
more challenging. This is especially true if no
physiological parameters like heart rate (HR) or heart
rate variability (HRV) are available.
These days, smartphone cameras are able to
measure HR and HRV based on changes in blood
volume in the fingers (photoplethysmography, PPG)
(Peng et al 2015). However, such measurements may
be difficult to carry out whilst running or jogging.
Other methods would require additional devices like
chest straps, smartwatches or other body sensors.
We propose to drop daily goals altogether and
integrate weekly goals as promoted in current health
recommendations from WHO and others. From a
health perspective, it makes more sense to adopt open
and continuous time windows instead of focusing on
single days or a 7-day calendar week pattern.
One advantage of longer timeframes is that the
user has more freedom to incorporate activities into
his or her routines without the need to perform an
activity every day. The downside could be that users
are tempted to postpone activities from one day to the
next. This could result in having to perform all the
activities required to achieve the weekly goal within
one or two days, for example on the weekend.
Although it would be better to engage in regular
physical activity, it is still better to be active only on
one or two days instead of not at all.
We have developed an approach that anticipates
the tendency to procrastinate and highlights the
consequences of postponing activity to later. Every
day without activity increases the amount of activity
needed to reach the goal.
3.2 Implementation
The above-mentioned design principles were
translated into a prototype by a team of researchers
with expertise in user experience and behavioural
economics.
For example, to counteract people’s tendency to
postpone activity till later, the consequences of such
behaviour are visualized by a specifically designed
bar chart which has been integrated into the graphical
user interface (GUI), see Figure 4.
The aim of the bar chart is to encourage people to
engage in regular physical activity instead of just
going for a run or brisk walk at the weekend. We do
not rely on the calendar week for visualising the PA
delta but have opted for a continuous floating 7-day
activity goal. Users can shift the visualized period
forth and back to see how the activities of different
intensities influence the PA necessary to achieve the
desired health benefits. The app calculates the effort
still required to reach the goal depending on the past
activities. The more days are taken into account from
the past, the fewer days are left for future activities to
reach the goal and vice versa. In line with the above-
mentioned health recommendations, the total period
to reach the activity goal is always 7 days (Figures 2
and 3). This helps the user to learn the benefits and
advantages related to frequent and regular rather than
extended isolated activities. This is illustrated in
Figure 3, which shows what happens if an extended
single activity drops out of the visualization period.
As a result, the effort to reach the 7-day goal goes up
to the maximum.
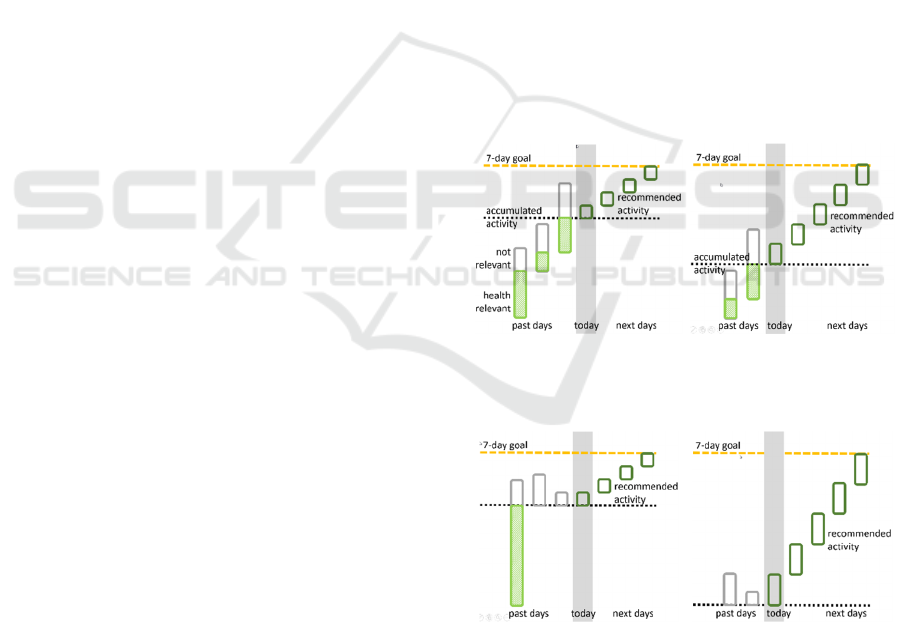
Figure 2: More frequent activities have a smaller effect on
the activity recommended to achieve the goal if the
observation window is moved by one day.
Figure 3: Single active days have a big effect on the effort
required to achieve the goal if they drop out of the
observation window.
As shown in Figure 2, the user has accumulated a
total of 90 minutes of physical activity at moderate
intensity over a period of three days, which means
that there are still 15 minutes to go on each of the
The Myth of 10,000 Steps: A New Approach to Smartphone-based Health Apps for Supporting Physical Activity
643
following four days. If the window is shifted forward
one day, the total activity amounts to 60 minutes and
18 minutes to go for each of the following five days.
The impact of moving the observation window
therefore is low.
In Figure 3, the user also has accumulated 90
minutes of physical activity at moderate intensity, but
in a single day with 15 minutes to go on each of the
following four days. If the observation window is
shifted forward by one day, the activity count drops
to zero, and 30 minutes of moderately intense PA is
recommended for each of the following five days. In
addition to intensity derived from walking cadence
our app considers the height profile of a track, which
is a critical factor for intensity as well. Our algorithm
is based on the formula of Naismith, which implies
that 1m of ascent is equivalent to 8m of horizontal
travel (Scarf, 2007).
The app brings together all the relevant
information in one single screen. There is no need to
go through a series of menus to collect relevant
information with goal achievement being the most
important. The default view shows the current day in
the centre of the 7-day window. It also shows the
activity over the last three days and the average
activity required to reach the goal within the next four
days including the current day. The area of
visualization can be shifted via touchscreen.
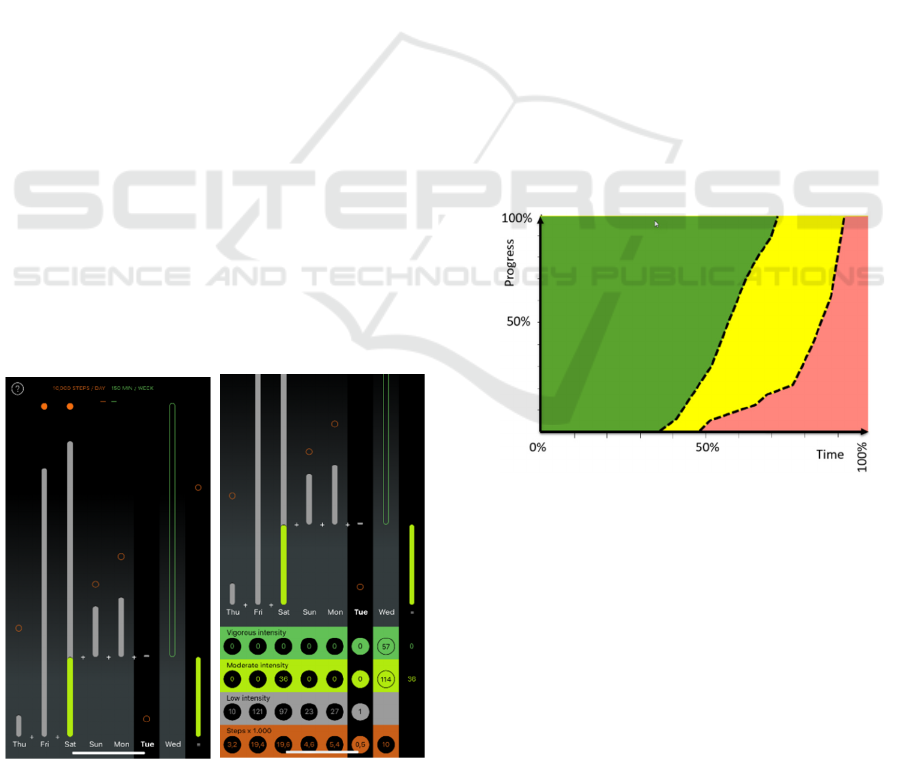
Moderate physical activity is visualized in light
green, vigorous activity in dark green and light
activity is grey. Only green activity is relevant for
achieving the goal and therefore stacked to fill the
accumulated bar on the right-hand side of the screen
(Figure 4, both left and right example).
Figure 4: App interface of the prototype.
To highlight the difference between quantifying
steps and MVPA, the total of steps per day is shown
as an orange circle for the current and past days. A
filled circle means the threshold of 10,000 steps has
been reached. However, it does not mean that any
MVPA has been achieved (see Figure 4, day Friday)
This is an important message conveyed by the app
and the interface.
The interface can be swiped up to get more insight
into the data. Active time in MVPA is shown for
every past day. It also shows the time with low
intensity (e.g. from slow walking) and the total steps
per day. The columns to the right of the current day
show how much MVPA is needed to reach the goal.
The column on the right shows the total active time in
each intensity zone (Figure 4).
3.3 Maintaining Motivation
As mentioned above, a major challenge is to maintain
user motivation over time (Nagler et al., 2013). Our
approach incorporates features based on insights from
behavioural economics which have been translated
into brief persuasive interventions, often described as
“nudges”. These may take on the form of alerts or
reminders as well as regular and possibly immediate
feedback on a user’s behaviour (Reimer et al., 2016).
Figure 5: Adaptive goal-achievement graph for triggering
situation-specific nudges.
Besides, we use a self-learning framework to
generate personalized and situation-specific
interventions because it has been shown that the “one-
size-fits-all” approach which disregards individual
preferences and contextual aspects fails to maintain
motivation (Reimer et al., 2016). The core element for
generating notifications is an adaptive goal-
achievement graph (see Figure 5). The graph triggers
different types of nudges depending on the time and
the progress towards the floating 7-day goal. A
learning algorithm adapts the segments to the
reactions of the user and thus continually improves
HEALTHINF 2020 - 13th International Conference on Health Informatics
644

the chances to trigger the right type of nudge at the
most appropriate time.
4 EVALUATION
The prototype has been pre-tested with a small group
of users (n=12) in an iterative process. Seven
participants were recruited from a school class (age =
14), five from the authors’ work environment (age 25
– 67). For the pre-test we used both interviews and
questionnaires (in the case of the pupils) which
addressed the following aspects: motivation for app
usage, goals related to physical activity, joy of use,
ease of use, other usability aspects such as error
tolerance and questions about the nudging approach.
The test users identified several shortcomings
related to the interface and interaction design, the
algorithm to trigger the appropriate nudges and some
technical issues (e.g. high energy consumption). As a
result of their feedback we have made minor changes
to the interaction design and the GUI, e.g. the colour
scheme. Currently, we are working on the onboarding
process which explains the main elements and the
benefits of the app after installation.
For the main evaluation we shall publish the app
via the Apple AppStore to reach larger numbers of
potential users. We expect to reach at least 150 to 200
users in the initial phase. To counteract the drop-off
effect, the evaluation process can be extended and
supported by online marketing activities if necessary.
Once it has been downloaded and installed, the app
will randomly activate one of two different
approaches for user motivation. The static version
uses the traditional approach known from most of the
common PA-promoting apps and makes use of a
reduced and hard-wired set of nudges. The dynamic
version includes the goal-achievement graph which
adapts over time in line with a user’s individual
performance. The graph should then trigger nudges at
promising times of the day and select nudge types that
are adapted to the individual user. The users will not
know which version they get to prevent bias.
The evaluation will examine the differences in
terms of PA between the two interventions groups.
PA can be measured by counting the number of steps
per single session of PA, steps per day, or per week
or to which extent the PA recommendations have
been reached. Additional parameters are number of
floors climbed and changes in walking cadence. We
also compare PA before the installation of the app
with the period from the installation and start of the
app usage. This can be done via access to the history
of PA data stored in the health applications of the
operating systems (e.g. HealthKit from iOS).
An important aspect besides the motivation to be
physical active is the motivation to use the app. Both
aspects shall be evaluated. Parameters for app usage
are number of times the app is opened, interactions
within the app and the time per session. We also differ
between nudge triggered and arbitrarily triggered user
interactions.
Additional outcome parameters are the users’
reactions to specific nudge types and their
engagement over time. The evaluation will
investigate both short-term (4 to 6 weeks) and long-
term effects (several months). Apart from the data
collected from the app we also plan to use a
questionnaire to obtain basic socio-demographic
information about the users (age, gender) and gain
further insights about usability, acceptance, and
motivation.
5 OUTLOOK & FUTURE WORK
One unsolved challenge is the problem of not
knowing if someone is within his or her individual
range of moderate or vigorous intensity. Currently we
rely on correlations between step frequency and
average intensity. The threshold for moderate
intensity is around 100 steps/min or 3.5 METs, for
vigorous intensity the threshold is around 130
steps/min or 6 METs (Tudor-Locke et al., 2018). We
are exploring different ways to optimize the
measurement of individual effort during exercise or
PA.
For example, we may calibrate the individual
intensity thresholds based on measuring the breathing
frequency whilst talking. The test can be used when
calibrating for the first time to define the individual
threshold and can be repeated to measure if the user
is in good or bad shape.
In the future, we also want to include optional
tracking of the heart rate to get a better feedback for
PA apart from walking and running. The idea is to let
the user select specific types of PA like cycling, yoga
or swimming and to derive the intensity based on
movement and heart rate. Using the METs as
suggested by Ainsworth et al. (2000), these activities
could then be added to the physically active time
shown by the app.
Another possibility to improve the app could
consist in combining the two approaches with
information from additional sensor data (GPS sensor,
accelerometer, barometer, gyro sensor, compass,
ambient sensor, ambient light sensor etc.). The data
The Myth of 10,000 Steps: A New Approach to Smartphone-based Health Apps for Supporting Physical Activity
645

could be used to learn how to identify situations of
higher physical intensity. This method would
incorporate machine learning so as to be able to
recognize patterns in the sensor data gathered from
wearables, for instance, and as a result learn how to
identify high intensity activity based on data patterns.
Finally, we have to be aware of the fact that it
might be difficult for sedentary adults or older adults
to meet the recommended PA goals. We should
therefore consider adapting the MPVA thresholds
given in the guidelines to the individual fitness level
which could then be raised over time if a person’s
fitness improves. The positive effects of even low-
dose activity for older adults have already been
confirmed in various studies (e.g. Sparling et al. 2015,
Hupin et al. 2015). Besides, there is evidence for a
dose–response relationship between physical activity
and premature mortality (Warburton et al., 2017).
Inspired by these findings, we intend to further
develop our approach.
REFERENCES
Adidas Runtastic (2019). Facts & Figures. Retrieved
November 3, 2019, from https://www.runtastic.com/
career/facts-about-runtastic/
Ainsworth, B. E., Haskell, W. L., Whitt, M. C., Irwin, M.
L., Swartz, A. M., Strath, S. J., ... & Jacobs, D. R.
(2000). Compendium of physical activities: an update
of activity codes and MET intensities. Medicine and
science in sports and exercise, 32(9; SUPP/1), S498-
S504.
Bort-Roig, J., Gilson, N. D., Puig-Ribera, A., Contreras, R.
S., & Trost, S. G. (2014). Measuring and influencing
physical activity with smartphone technology: a
systematic review. Sports medicine, 44(5), 671-686.
Campbell, M. J., Dennison, P. E., Butler, B. W., & Page,
W. G. (2019). Using crowdsourced fitness tracker data
to model the relationship between slope and travel rates.
Applied Geography, 106, 93-107.
Coughlin, S. S., Whitehead, M., Sheats, J. Q.,
Mastromonico, J., & Smith, S. (2016). A review of
smartphone applications for promoting physical
activity. Jacobs journal of community medicine, 2(1).
Department of Health and Social Care. (2019, September
19). UK Chief Medical Officers’ physical activity
guidelines. Retrieved November 3, 2019, from
https://www.gov.uk/government/publications/physical
-activity-guidelines-ukchief-medical-officers-report
Dernbach, S., Das, B., Krishnan, N. C., Thomas, B. L., &
Cook, D. J. (2012, June). Simple and complex activity
recognition through smart phones. In 2012 Eighth
International Conference on Intelligent Environments
(pp. 214-221). IEEE.
Hendelman, D., Miller, K., Baggett, C., Debold, E., &
Freedson, P. (2000). Validity of accelerometry for the
assessment of moderate intensity physical activity in
the field. Medicine & Science in Sports & Exercise,
32(9), S442-S449.
Hupin, D., Roche, F., Gremeaux, V., Chatard, J. C., Oriol,
M., Gaspoz, J. M., ... & Edouard, P. (2015). Even a low-
dose of moderate-to-vigorous physical activity reduces
mortality by 22% in adults aged≥ 60 years: a systematic
review and meta-analysis. Br J Sports Med, 49(19),
1262-1267.
Kang, M., Marshall, S. J., Barreira, T. V., & Lee, J. O.
(2009). Effect of pedometer-based physical activity
interventions: a meta-analysis. Research quarterly for
exercise and sport, 80(3), 648-655.
Lee, D. C., Brellenthin, A. G., Thompson, P. D., Sui, X.,
Lee, I. M., & Lavie, C. J. (2017). Running as a key
lifestyle medicine for longevity. Progress in
cardiovascular diseases, 60(1), 45-55.
Litman, L., Rosen, Z., Spierer, D., Weinberger-Litman, S.,
Goldschein, A., & Robinson, J. (2015). Mobile exercise
apps and increased leisure time exercise activity: A
moderated mediation analysis of the role of self-
efficacy and barriers. Journal of medical Internet
research, 17(8), e195.
Marin, T. S., Kourbelis, C., Foote, J., Newman, P., Brown,
A., Daniel, M., ... & Beks, H. (2019). Examining
adherence to activity monitoring devices to improve
physical activity in adults with cardiovascular disease:
A systematic review. European journal of preventive
cardiology, 26(4), 382-397.
Nagler, R. H., Ramanadhan, S., Minsky, S., & Viswanath,
K. (2013). Recruitment and retention for community-
based eHealth interventions with populations of low
socioeconomic position: strategies and challenges.
Journal of Communication, 63(1), 201-220.
Pedometer - Step Counter - Apps on Google Play. (n.d.).
Retrieved November 3, 2019, from
https://play.google.com/store/apps/details?id=com.tay
u.tau.pedometer
Peng, R. C., Zhou, X. L., Lin, W. H., & Zhang, Y. T. (2015).
Extraction of heart rate variability from smartphone
photoplethysmograms. Computational and
mathematical methods in medicine, 2015.
Piercy, K. L., Troiano, R. P., Ballard, R. M., Carlson, S. A.,
Fulton, J. E., Galuska, D. A., ... & Olson, R. D. (2018).
The physical activity guidelines for Americans. Jama,
320(19), 2020-2028.
Pitman, A., Zanker, M., Gamper, J., & Andritsos, P. (2012,
September). Individualized hiking time estimation. In
2012 23rd International Workshop on Database and
Expert Systems Applications (pp. 101-105). IEEE.
Pratt, M., Norris, J., Lobelo, F., Roux, L., & Wang, G.
(2014). The cost of physical inactivity: moving into the
21st century. Br J Sports Med, 48(3), 171-173.
Reimer, U., Maier, E., & Ulmer, T. (2016). A Self-learning
Application Framework for Behavioural Change
Support. In International Conference on Information
and Communication Technologies for Ageing Well and
e-Health (pp. 119-139). Springer, Cham.
Ryan, J., Edney, S., & Maher, C. (2017). Engagement,
compliance and retention with a gamified online social
HEALTHINF 2020 - 13th International Conference on Health Informatics
646

networking physical activity intervention.
Translational behavioural medicine, 7(4), 702-708.
Scarf, P. (2007). Route choice in mountain navigation,
Naismith's rule, and the equivalence of distance and
climb. Journal of Sports Sciences, 25(6), 719-726.
Schoeppe, S., Alley, S., Van Lippevelde, W., Bray, N. A.,
Williams, S. L., Duncan, M. J., & Vandelanotte, C.
(2016). Efficacy of interventions that use apps to
improve diet, physical activity and sedentary
behaviour: a systematic review. International Journal
of Behavioural Nutrition and Physical Activity, 13(1),
127.
Sparling, P. B., Howard, B. J., Dunstan, D. W., & Owen, N.
(2015). Recommendations for physical activity in older
adults. Bmj, 350, h100.
Tudor-Locke, C., & Bassett, D. R. (2004). How many
steps/day are enough? Sports medicine, 34(1), 1-8.
Tudor-Locke, C., Han, H., Aguiar, E. J., Barreira, T. V.,
Schuna Jr, J. M., Kang, M., & Rowe, D. A. (2018). How
fast is fast enough? Walking cadence (steps/min) as a
practical estimate of intensity in adults: a narrative
review. Br J Sports Med, 52(12), 776-788.
US Dept of Health and Human Services. (2008). 2008
physical activity guidelines for Americans.
Warburton, D. E., & Bredin, S. S. (2017). Health benefits
of physical activity: a systematic review of current
systematic reviews. Current opinion in cardiology,
32(5), 541-556.
Warburton, D. E., Nicol, C. W., & Bredin, S. S. (2006).
Health benefits of physical activity: the evidence. Cmaj,
174(6), 801-809.
Wattanapisit, A., & Thanamee, S. (2017). Evidence behind
10,000 steps walking. Journal of Health Research,
31(3), 241-248.
World Health Organization. (2015, October 5). Global
Action Plan for the Prevention and Control of NCDs
2013-2020. Retrieved November 11, 2019, from
https://www.who.int/nmh/events/ncd_action_plan/en
The Myth of 10,000 Steps: A New Approach to Smartphone-based Health Apps for Supporting Physical Activity
647
