
Irosashi: Visualization of the Colors of a Building Which Leave an
Impression to Identify Characteristics of an Urban Environment
Yota Kikuchi
1
and Makoto Okamoto
2
1
Area of Media Design, Graduate School of Future University Hakodate, Hakodate City, Hokkaido, Japan
2
Department of Information Architecture, Future University Hakodate, Hakodate City, Hokkaido, Japan
Keywords: Urban Environment, Impression Formation, Color Diagram, Data Visualization, Interaction.
Abstract: The purpose of this research is to propose a GUI for visualizing data showing the characteristics of the city
and evaluate its effect. The author was interested in visual impressions of the urban environment and wanted
to share these impressions with others. First, I made a prototype of "Irosashi Treemap", which plots all colors
used for buildings in the western part of Hakodate city. However, the colors displayed by the Irosashi Treemap
differed from the impressions of the subjects who knew the western area due to the many achromatic colors.
Therefore, I collected color from the triangular roof and walls on the first floor of the building I felt frequent.
In addition, it was suggested that the "Irosashi Treemap" plotted all colors, making it difficult to understand
the characteristics of the colors. Therefore, a prototype of "Irosashi Impression", which plots representative
colors, was produced. In evaluation experiment, three subjects answered that the impression of the city was
close to the impression of the color taken from the triangular roof and walls. In the future, we will ask many
people to collect impressive colors of the city. And evaluate the effect of "Irosashi Impression".
1 INTRODUCTION
This is a study on GUI (Graphical User Interface) for
Data Visualization that displays the color
characteristics of urban environment. In order to
show the characteristics of the city, the author
collected data on the colors of buildings which left an
impression (on the viewer) and used the data to
represent the characteristics of the urban
environment. Next, Data Visualization, which can
interactively identify the characteristics of an urban
environment by mapping the color of the building by
a computer was proposed, and its effects were
evaluated.
This study was carried out because the author was
interested in the difference in the visual impressions
of urban environments and wanted to share these
impressions with others. The author hoped to share
with his family and friends the differences in the
impression between his hometown and his current
residence in the city. However, reasons for the
difference in impressions were not clear, and as a
result, expressing those impressions in words was
difficult. Using the city photos, I was able to share the
whole picture of the city with others. However, the
impression I wanted to convey was not the whole
picture of the city, but the representative part of the
city. Therefore, I wanted to consider a method for
communicating the impression that we felt as a
representative part of the city to others.
First, how people form an impression of a city was
considered. According to Miura et al. impressions are
unconsciously formed. Miura et al. defined kansei
(feeling) as a function that intuitively processes vague
information (Miura, 2000). The terms “vague” and
“intuition” mean that people unconsciously extract
and integrate information from the environment to
form an impression (Miura, 2003). Miura et al. further
stated that impressions were difficult to put into
words and exceeded logic, and are related to
knowledge (Miura, 2003). If this is applied to a city,
it can be said that a person unconsciously integrates
the objects and knowledge that comprise the city in
order to form an impression (of the city).
Next, regarding factors which influence people in
the formation of an impression of the city. Kawabata
et al. stated that the color of an object affects visual
perception. In addition, the city consists of many
buildings. Inoue et al. considered that the color of
building is important in understanding a city (Inoue,
2014). Similarly, it can be said that the color of the
building represents the impression of a city.
252
Kikuchi, Y. and Okamoto, M.
Irosashi: Visualization of the Colors of a Building Which Leave an Impression to Identify Characteristics of an Urban Environment.
DOI: 10.5220/0009091602520259
In Proceedings of the 15th International Joint Conference on Computer Vision, Imaging and Computer Graphics Theory and Applications (VISIGRAPP 2020) - Volume 3: IVAPP, pages
252-259
ISBN: 978-989-758-402-2; ISSN: 2184-4321
Copyright
c
2022 by SCITEPRESS – Science and Technology Publications, Lda. All rights reserved

Therefore, a collection method of the colors of
buildings that can accurately represent the impression
of the city was considered.
It is difficult to convey the impression of a color
in words to others. Therefore, symbols in a diagram
which can convey the impression of a color to others
were considered. The diagram shows vague
information and can be shared with others. A map
shows the characteristics of the world and is a
representative example of how a diagram shares
information with others. Nakamura considered that a
map is based on the world structure in a person’s mind
(Nakamura, 1993). A world view can be interpreted
by a map and shared with others. From this, it was
considered possible to interpret the vague impression
of the city by mapping the color of an urban building,
and could be shared with others.
Data Visualization was considered as a method to
represent the colors of a building as diagrams. Data
Visualization is a method that allows users to
interactively understand the meaning of data using a
computer GUI (Graphical User Interface). In addition,
by representing the color of a building with a
computer, the user can compare the colors of different
cities and understand the characteristics of each one.
In some cases, GUI for visualizing color features
use color variables (RGB, CMYK, HSV, etc.) to plot
all colors. However, I thought it was difficult to
understand the features from the large number of
displayed colors. Therefore, in order to convey color
characteristics in an easy-to-understand manner, we
proposed a GUI that plots representative colors.
The purpose of this study is to propose Data
Visualization which can show the characteristics of a
city and evaluate their effects. In order to show the
characteristics of the city, the colors of buildings
which left an impression were collected. Next, Data
Visualization, which can show the characteristics of
an urban environment interactively by mapping the
colors of the buildings with a computer, was proposed
and their effect was evaluated.
2 RELATED WORKS
2.1 Color Characteristics Analysis in
an Urban Environment
The Seibu Area in Hakodate City, Japan, is lined with
building painted various colors. Morishita et al.
collected previous paint colors by shaving the paint
off a building and displayed the color characteristics
in a table (Morishita, 2004). The colors of a building
are classified into 13 main colors, and a table
summarizes the number of appearances of each color.
In the table, colors characteristics are supplemented
with text. Conte et al. analyzed the color of buildings
focusing on light, time, vegetation and nature The
color characteristics of the Italian city of Matera are
shown (Conte, 2018). Conte et al. filmed the city of
Matera from 15 directions and compared the color
characteristics of each direction. The studies by
Morishita et al. and Conte et al. are interesting in that
the colors of buildings were collected in order to show
the characteristics of the city.
2.2 Color Characteristics Analysis in
Image Engineering
Muroya et al. analyzed the change in color in the
vertical and horizontal directions of a painting and
showed the characteristics of the painting (Muroya,
2017). Muroya et al. divided the painting into equal
sections and analyzed the colors. Also, Takahashi et
al. considered a method to extract representative
colors from images composed of complex colors in
reference to human visual perception (Takahashi,
2016). Takahashi et al. collected colors from all the
objects in the image, and then colors which persons
felt were the same were grouped together.
2.3 Data Visualization Representing
the Visual Characteristics of Urban
Dudek et al. proposed Data Visualization that
combined ratiograms and diachrograms in order to
represent historical change of a city (Dudek, 2010). A
ratiogram represents the form, structure, and function
of building, while a diachrogram represents its life
cycle such as building construction and repair. Dudek
et al. showed the characteristics of a city by focusing
on the structure and history of a building.
2.4 Data Visualization Representing
Color Characteristics
PixelChart is Data Visualization that analyzes the
colors in images uploaded by users and distributes the
colors to CMYK values (Andrei, 2018). In addition,
PHOTOTRAILS analyzes the colors of photos
uploaded to SNS by city. This Data Visualization
divides photos into hue values (Nadav, 2013).
PixelChart and PHOTOTRAILS show all collected
colors using color variables such as hue and CMYK.
PixelChart and PHOTOTRAILS are diagrams that
target and represent a single image.
Irosashi: Visualization of the Colors of a Building Which Leave an Impression to Identify Characteristics of an Urban Environment
253
2.5 Research Concept
In this study, how to collect the colors of a building
that give an impression and use of a diagram to easily
convey the characteristics of colors are evaluated.
Consequently, how to collect the colors of a building
in a way that accurately shows the impression of the
city was considered. In addition, colors that leave an
impression, rather than all the colors painted on the
building, were collected.
In order to easily convey color characteristics,
representative colors were plotted. In this way, it was
hypothesized that users could easily understand the
characteristics of the city. In addition, an interactive
diagram (color representation) to compare colors was
also prepared. By comparing different cities
interactively, it was assumed that users could
understand the characteristics of a city well.
3 RESEARCH PROCESS
The author prototyped a GUI prototype that plots the
colors of the building. And I cognitively analyzed the
effect of the GUI. In addition, we considered the
results of analyzing the prototype and prototyped a
new prototype.
First, an “Irosashi Treemap” that collects and
plots all the colors used in the building was created.
From the results of the evaluation experiment,
collecting colors that could express the impressions
of the viewer were thought to be needed in order to
demonstrate the characteristics of the city. Therefore,
colors from buildings that left an impression were
collected and “Irosashi Impression” was created.
4 PROTOTYPE1: Irosashi Treemap
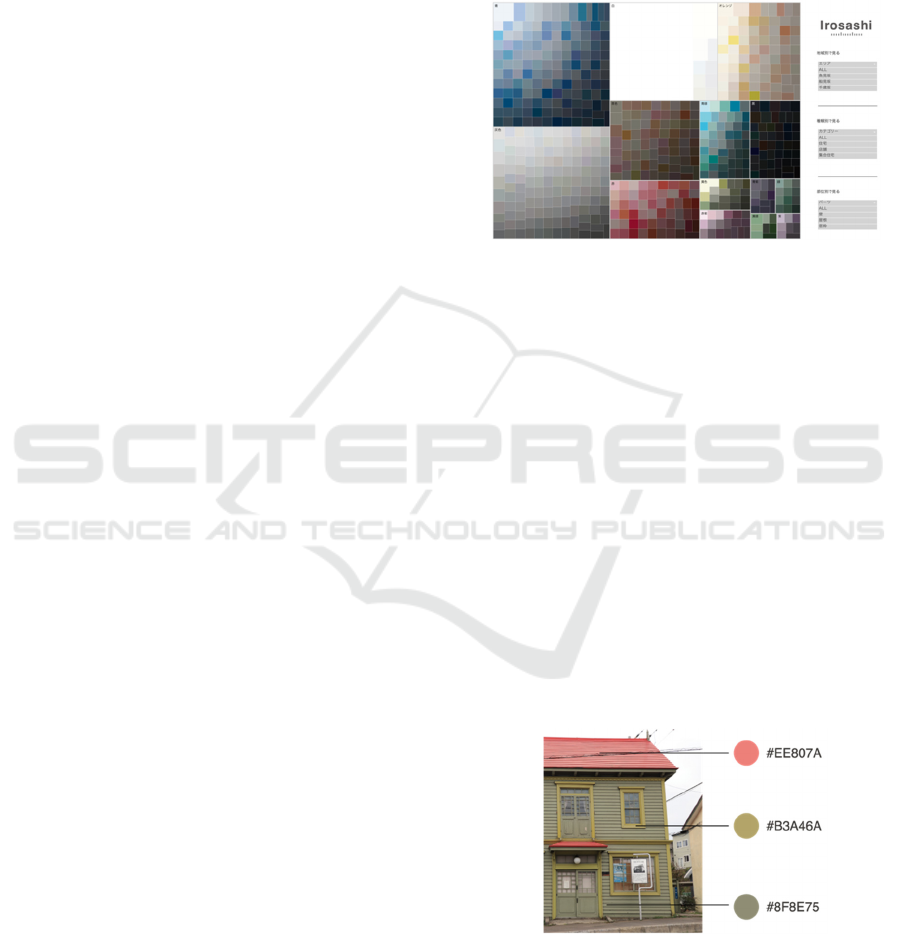
The prototype, “Irosashi Treemap” (Figure 1) shows
the characteristics of the city by plotting all the colors
used in a building using the Treemap method
(Johnson, 1991). Users can freely generate diagrams
by selecting specific items (Area, Building Type,
Building Part).
4.1 Irosashi Treemap Structure
“Irosashi Treemap” plots colors within a certain range
using the Treemap method. Consequently, even if the
number of displayed colors changes depending on the
item selected by the user (Area, Building Type,
Building Part), the diagram is always the same size,
allowing users to compare different cities. Colors are
classified into 14 hues. Each hue, the parent data, is
displayed in descending order of frequency ratio for
all colors starting from the top left of the screen.
Colors that are child data are displayed in order of
brightness from the upper left. The size of each node
increases according to the number of collected colors.
Figure 1: Irosashi Treemap Basic Screen.
4.2 Collecting Colors Represented by
Irosashi Treemap
Colors of the buildings in the Seibu Area of Hakodate
City were collected. Buildings in the Seibu Area have
characteristic colors for the roof and walls.
Furthermore, window frames also feature distinctive
colors. The colors of the buildings in the district are
mainly divided into three parts: roof, wall, and
window frame. Therefore, colors were collected from
these parts. Seibu is a hilly area, so colors were
collected by individual slope.
Colors were collected from eight slopes in the
Seibu Area (Nizyukken Slope, Daisan Slope,
Hachiman Slope, Motoi Slope, Saiwai Slope, Chitose
Slope, Funami Slope, Uomi Slope). Colors were then
extracted from a photograph of the building using the
eyedropper function of “Adobe Illustrator” (Figure 2).
Figure 2: Colors Collected from Pixels on Roofs, Walls,
and Window Frames in Building Photos.
A csv file with four elements: “Building Type”,
“Building Part”, “Color Code (Hexadecimal)”, and
“Collected Slope” was created. Users can freely
IVAPP 2020 - 11th International Conference on Information Visualization Theory and Applications
254
generate diagrams by selecting 8 slopes, 23 types of
buildings (Houses, Stores, etc.) and 3 building parts
(Roof, Wall, or Window Frame) (Figure 3).
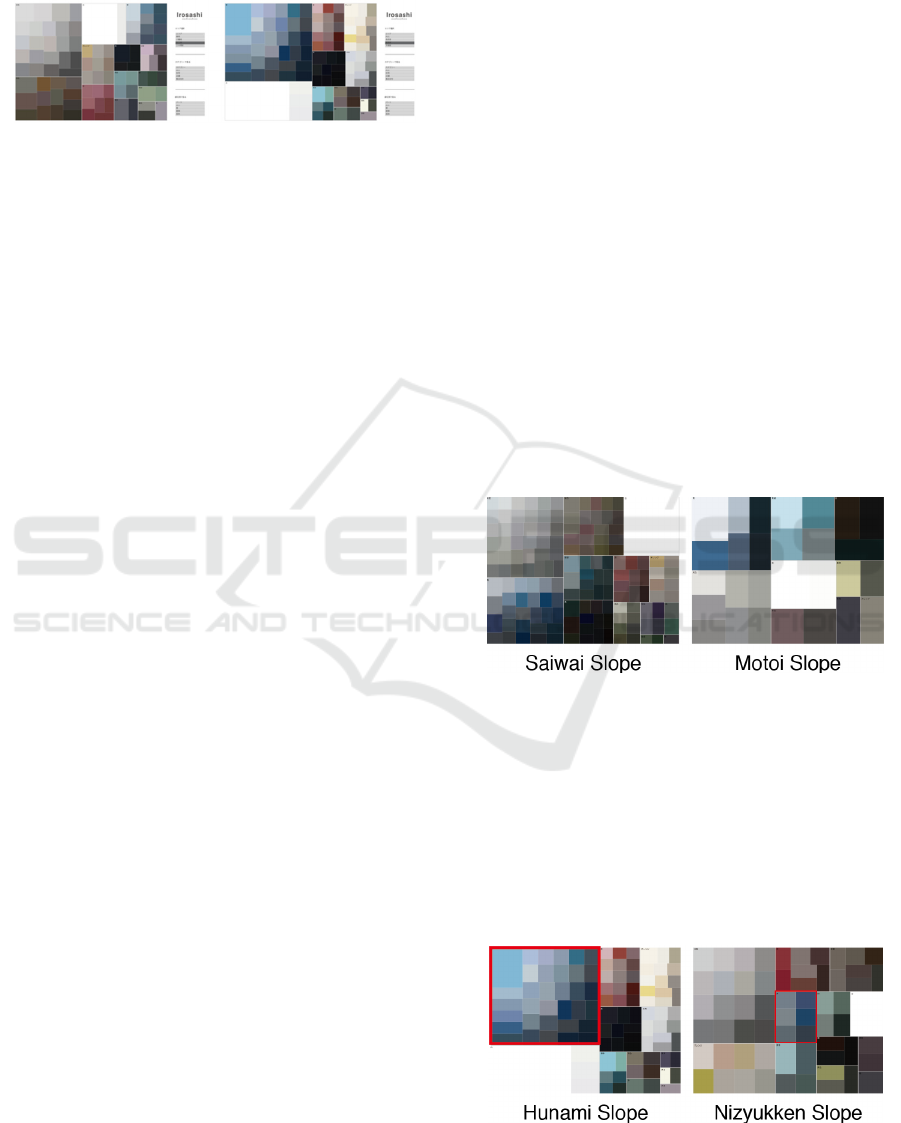
Figure 3: The Colors of the Buildings at Hachiman Slope
(Left) and Funami Slope (Right).
4.3 Irosashi Treemap Evaluation
Experiment
Purpose. The purpose of this experiment was to
evaluate whether “Irosashi Treemap” could represent
the color characteristics of the city.
Subjects. 5 university students, 9 non-students.
Procedure. Subjects answered a questionnaire
describing the color characteristics of buildings in the
Seibu Area and were instructed on the use of the
“Irosashi Treemap”. There was no time limit and the
subject could work at his own pace. When the subject
was finished, a questionnaire on understanding the
color characteristics of the buildings in the Seibu
Area and an interview on the use of “Irosashi
Treemap” were carried out.
4.4 Experimental Results and
Discussion
In this section, collection method of building colors
and easy-to-understand color diagrams based on the
experimental results are considered.
4.4.1 Color Characteristics Differ According
to the Subject’s Impression
Each subject had visited the Seibu Area before and
had an impression of the colors of the buildings. Nine
of the 14 subjects described a large number of
achromatic colors as colors different from
characteristic colors which left an impression. Three
subjects answered that the colors of different slopes
looked the same. From the above results, due so many
achromatic colors, the colors of “Irosashi Treemap”
were considered to differ depending on the
impression by the subject. One reason for the
collection of so many achromatic colors is that all the
colors which do not leave a strong impression and are
overlooked by people were collected. Hence,
consideration of a collection method that can collect
colors which leave an impression is needed.
4.4.2 Examination of Easy-to-Understand
Colors
In order to represent the color characteristics of the
city, it is necessary to express the characteristic colors
of a building in an easy-to-understand manner.
However, average score to the question “Could you
understand the characteristic colors?” (answered after
the subject used “Irosashi Treemap”) was 3.78 on a
scale of 1-5. Consequently using a diagram to express
the colors in an easy-to-understand manner is
considered needed.
4.4.3 Compare Colors of Different City
Four subjects answered that the color characteristics
were difficult to understand. Subjects answered that
the color characteristics were difficult to understand
because the colors could not be compared for
individual slopes. In addition, three examinees
answered that the number of displayed colors differed
by slope. The number of colors displayed on “Irosashi
Treemap” varied depending on the number of
buildings adjacent to the slope (Figure 4). Therefore,
comparing colors is considered difficult.
Figure 4: The Number of Different Building Colors
Displayed for Each Slope.
One subject answered that the position where the
colors were displayed differed for each slope (Figure
5). It was difficult to keep track of the color he wanted
to compare each time he selected a slope and
generated a diagram. In response to the above, the
reason why color characteristics cannot be displayed
is that the number of display colors and the display
position differ by slope.
Figure 5: The Hue is Displayed at a Different Position for
Each Slope.
Irosashi: Visualization of the Colors of a Building Which Leave an Impression to Identify Characteristics of an Urban Environment
255
4.4.4 Problems of Irosashi Treemap
According to the results of the evaluation experiment,
the following four issues were observed for “Irosashi
Treemap”.
・ Collection method of building colors which can
leave an impression with the viewer.
・Creation of diagrams that can display colors in an
easy-to-understand manner.
・ Creation of diagrams that have the same number
of displayed colors and which can compare the colors
from different cities.
・ Creation of diagrams that can display colors in a
predetermined position and compare the colors from
different cities.
Based on these issues, a preliminary survey and
prototype production were conducted to reexamine
the color collection method.
5 PROTOTYPE2: Irosashi
Impression
“Irosashi Impression” shows representative colors
collected from buildings that leave an impression.
The user can select the city and the number of
displayed colors (1 to 10 colors) and freely generate
diagram. The user can switch between “Color View
Mode” (Figure 6) and “Box Plot Mode” (Figure 7)
that distributes colors according to hue values. The
colors are displayed in a uniform size depending on
the number of colors selected by the user.
“Irosashi Impression” displays a certain number
of representative colors at predetermined positions
according to the hue value. This diagram allows users
to compare the colors of different cities and
understand the color characteristics of each city.
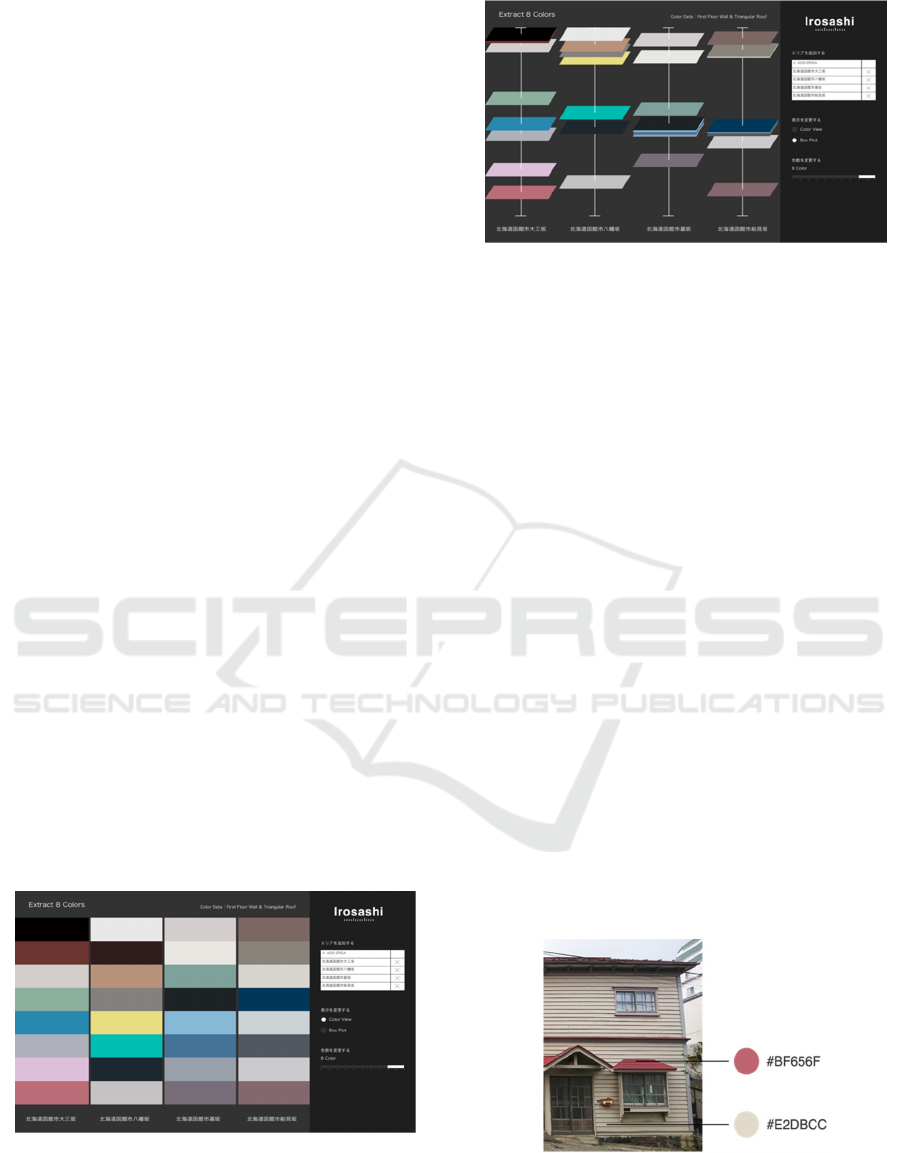
Figure 6: Color View Mode of Irosashi Impression.
Figure 7: Box Plot Mode of Irosashi Impression.
5.1 Irosashi Impression Structure
“Irosashi Impression” plots representative colors
using the kmeans ++ method (Arthur, 2007). A
representative color is the average value of each
cluster and the Euclidean distance closest to each
other(Lab color space). The kmeans ++ method was
used instead of the kmeans method (Macqueen, 1967)
in order to prevent the representative color from
changing every time the user selects the number of
displayed colors.
5.2 Collecting Colors That Represent
an Impression
A method to collect colors that leave an impression
with the viewer was considered by sketching common
color points in buildings that left an impression with
the viewer as he walked through the slopes in the
Seibu Area. As a result of the examination, colors
were collected from the triangular roof and walls on
the first floor of the buildings which left an
impression with the viewer (Figure 8). The triangular
roof and walls of the building were frequently seen in
walking. Colors were extracted from four slopes in
the Seibu Area, Hakodate City (Daisan Slope,
Hachiman Slope, Motoi Slope, Funami Slope).
Figure 8: Colors Collected from Pixels on Triangular Roof
and Wall of the First Floor in Building Photos.
IVAPP 2020 - 11th International Conference on Information Visualization Theory and Applications
256
5.3 Irosashi Impression Evaluation
Experiment
The Purpose. The purpose of using Irosashi
Impression was to evaluate whether the colors
collected from the triangular roof and walls on the
first floor of the building closely matched the
impression of the viewer.
Subjects. 3 university students and 7 graduate
students.
Procedure. The subjects walked through two
slopes (Daisan Slope, Hachiman Slope) in the Seibu
Area, and the impression left by the colors of the
building was written on the questionnaire. After
walking through each slope, the subjects were shown
with a screen of 5 representative colors of roof, wall,
and window frame (Pattern 1) and a screen of 5
representative colors of triangular roof and wall color
on the first floor (Pattern 2) (Figures 9 and 10), and
the impression of the color was written in the
questionnaire. Next, the subjects were asked how the
impression of the color of the building when walking
through the slope matched the impression of the
colors in Pattern 1 and Pattern 2, respectively, on a
scale of 1-5.
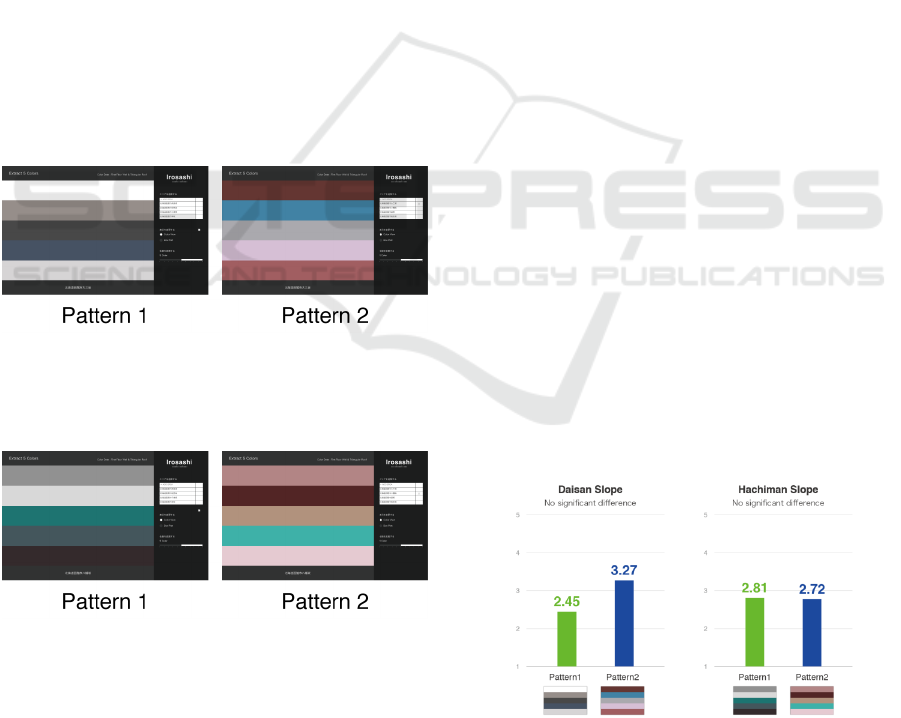
Figure 9: All the Building Colors (Pattern 1) and the
Triangular Roof and Wall Colors of the Building (Pattern
2) Collected on the Daisan Slope Displayed Using Irosashi
Impression.
Figure 10: All the Building Colors (Pattern 1) and the
Triangular Roof and Wall Colors of the Building (Pattern
2) Collected on the Hachiman Slope Displayed Using
Irosashi Impression.
5.4 Evaluation Experiment Results and
Discussion
In this section, we show the experimental results of
evaluating the color impression displayed by
"Irosashi Impression". In addition, we describe how
to collect the colors of the building that left an
impression from the experimental results, and how to
create a diagram showing the color characteristics.
5.4.1 Collecting Colors of a Building That
Leave an Impression
Figure 11 shows the average value of how well the
impression formed from the colors of the building on
a slope matched the impression from the color of
“Irosashi Impression”. For Daisan Slope, the average
value for Pattern 2 was high. For Hachiman Slope,
there was no difference between the average values
of Pattern 1 and Pattern 2. In addition, normality
could not be confirmed in the evaluation of Pattern 2
of Daisan Slope and Hachiman Slope. Wilcoxon's
rank sum test was used to determine significant
difference in the evaluation of Patterns 1 and 2 for
Daisan Slope and Hachiman Slope. However, no
significant difference between Daisan Slope (p = 0.37
> 0.05) and Hachiman Slope (p = 0.85 > 0.05) was
observed. From these results, further room for
consideration in the collection method of colors that
leave an impression is suggested. Although, three
subjects replied that the color of Daisan Slope Pattern
2 was close to the color impression they felt when
going down the slope. Although there was no
significant difference, Daisan Slope may have been
more effective in color correction method for
expressing people's impressions. In the future, we
will reexamine the method of collecting colors so that
multiple people can collect impressive colors and
share urban impressions.
Figure 11: Degree the Impression from the Color of the
Building on the Slope matched the Colors of Pattern 1 and
Pattern 2.
Irosashi: Visualization of the Colors of a Building Which Leave an Impression to Identify Characteristics of an Urban Environment
257

5.4.2 Diagram Representation of Color
Characteristics
In this experiment, five colors were plotted from the
colors collected using “Irosashi Impression”.
However, impressions may change depending on the
number of displayed colors. In the future, allowing
the subject to freely select the number of colors to be
displayed and then evaluating the impression of the
colors is planned. Furthermore, in this experiment,
the color size was displayed evenly. However, the
impression may change depending on the size of the
color display. In the future, we will consider a method
of displaying colors in a size corresponding to the
area of the sampling part.
6 FUTURE WORK
The color correction method proposed to express
people's impressions proposed in this study focused
on external factors such as building parts. However,
the impression of the viewer may also be influenced
by internal factors such as interest. Therefore, it is
possible that not only buildings but all objects affect
people's impressions. In the future, analysis of the
factors that affect the viewer’s impression will be
carried out by having multiple subjects collect the
colors which left an impression with them, and then
reexamine the color collection method. The collected
colors will then be plotted using “Irosashi
Impression”, and whether the characteristics of the
city could be shown in the results will be evaluated.
7 CONCLUSIONS
The purpose of this study is to propose data
visualization that can show the characteristics of a
city and evaluate its effect. In order to show the
characteristics of the city, the colors of buildings that
left an impression with the viewer were collected. In
addition, the color of the building was visualized with
a computer, a Data Visualization that interactively
displayed the characteristics of the city was proposed
and its effect evaluated. From the experimental
results of “Irosashi Impression”, the impression
viewers formed of a city was influenced not only by
external factors such as building parts, but also by
internal factors such as interest. In the future, a
method to collect the colors of a building that can
show the impression of a city will be reconsidered,
and the effect of “Irosashi Impression” will be
reevaluated.
REFERENCES
Miura, K. et al., (2000). The psychology of intellect and
sensitivity- Introduction to cognitive psychology.
Tokyo: Fukumura Publishers.
Miura, K., (2003). Perceptual and cognitive factors of
Kansei impression, Vision, 15(3), 143-149.
Kawabata, Y. et al., (2011). Color and Cognitive Science
—The Effects of Color in High level Vision and
Cognition—. Journal of the Imaging Society of Japan,
50(6), 522-528.
Inoue, R., Nakano, S., (2014). A Study on landscape of
historical street -Case study of Matsue urban traditional
preservation area, townscape formation area and
neighborhood area-. Journal of architecture and
building science, 20(44), 311-316.
Nakamura, T., Okamoto, K., (1993). Introduction to mental
map, Tokyo: Kokon Publishers.
Morishita, M. et al., (2004). Transition of townscape
through paint colors at the west historic quarter in
Hakodate -Analysis of “temporal color ring” paint
layers of western style houses with wood siding-,
Transactions of AIJ. Journal of architecture and
planning, 579, 81-88.
Conte, A. et al., (2018). Variations of Identity: Tuff as
Matter of Architecture. Shades of Light, Time and
Colour, INTBAU2017. Lecture Notes in Civil
Engineering, 3, 1329-1339.
Muroya, T., The Naional Art Center Tokyo., (2017). A
spatial wavelength analysis of color variations in
painting arts based on a step-function system with
arbitrary wavelength, Journal of the Color Science
Association of Japan, 41(6), 15-18.
Takahashi, N. et al., (2016). Visualization of Brand Images
Extracted from Home-Interior Commercial Websites
Using Color Features. Lecture Notes in Computer
Science, 9374, 179-190.
Dudek, I., Blaiseet, J. Y., (2010). UNDERSTANDING
CHANGES IN HERITAGE ARCHITECTURE-Can
We Provide Tools & Methods for Visual Reasoning?
IIMAGAPP 2010 - Proceedings of the International
Conference on Imaging Theory and Applications and
IVAPP 2010 - Proceedings of the International
Conference on Information Visualization Theory and
Applications, 1, 91-100.
Andrei, K., (2018). PixelChart[Web log]. Retrieved from
https://anvaka.github.io/pixchart/?d=4
Nadav, H. et al., (2013). PHOTOTRAILS[Web log].
Retrieved from http://phototrails. net/instagram-cities/
Johnson, B., Shneiderman, B., (1991). Tree-maps: A
Spacelling Approach to the Visualization of
Hierarchical Information Structures. Published in
Proceeding Visualization, 91, 284-291.
Arthur, D., Vassilvitskii, S., (2007). k-means++: the
advantages of careful seeding. In Proceedings of the
IVAPP 2020 - 11th International Conference on Information Visualization Theory and Applications
258

18th Annual ACM-SIAM Symposium on Discrete
Algorithms, 1027-1035.
MacQueen, J., (1967). Some Methods for classification and
Analysis of Multivariate Observations. Proceedings of
the Fifth Berkeley Symposium on Mathematical
Statistics and Probability, 1, 281-297.
Irosashi: Visualization of the Colors of a Building Which Leave an Impression to Identify Characteristics of an Urban Environment
259
