
Classification of Respiratory Sounds with Convolutional Neural Network
A. A. Saraiva
3,7 a
, D. B. S. Santos
2 b
, A. A. Francisco
2 c
, Jose Vigno Moura Sousa
1,2 d
,
N. M. Fonseca Ferreira
4,5 e
, Salviano Soares
3 f
and Antonio Valente
3,6 g
1
University Brazil, Sao Paulo, Brazil
2
UESPI-University of State Piaui, Piripiri, Brazil
3
University of Tr
´
as-os-Montes and Alto Douro,Vila Real, Portugal
4
Coimbra Polytechnic - ISEC, Coimbra, Portugal
5
Knowledge Engineering and Decision-Support Research Center (GECAD) of the Institute of Engineering,
Polytechnic Institute of Porto, Porto, Portugal
6
INESC-TEC Technology and Science, Porto, Portugal
7
University of Sao Paulo, Sao Carlos, Brazil
Keywords:
CNN, Sounds, Breath, MFCC.
Abstract:
Noting recent advances in the field of image classification, where convolutional neural networks (CNNs) are
used to classify images with high precision. This paper proposes a method of classifying breathing sounds
using CNN, where it is trained and tested. To do this, a visual representation of each audio sample was made
that allows identifying resources for classification, using the same techniques used to classify images with high
precision.For this we used the technique known as Mel Frequency Cepstral Coefficients (MFCCs). For each
audio file in the dataset, we extracted resources with MFCC which means we have an image representation
for each audio sample. The method proposed in this article obtained results above 74%, in the classification of
respiratory sounds used in the four classes available in the database used (Normal, crackles, wheezes, Both).
1 INTRODUCTION
Automatic analysis of respiratory sounds has been a
field of great research interest in recent decades. Au-
tomated classification of respiratory sounds has the
potential to detect abnormalities in the early stages of
respiratory dysfunction and thus increase the effec-
tiveness of decision making Pasterkamp et al. (1997);
Morillo et al. (2013).
Respiratory sounds are important indicators of
respiratory health and respiratory disorders. The
sound emitted when a person breathes is directly re-
lated to air movement, changes in lung tissue and
position of lung secretions. A wheezing, for exam-
a
https://orcid.org/0000-0002-3960-697X
b
https://orcid.org/0000-0003-4018-242X
c
https://orcid.org/0000-0002-0714-3333
d
https://orcid.org/0000-0002-5164-360X
e
https://orcid.org/0000-0002-2204-6339
f
https://orcid.org/0000-0001-5862-5706
g
https://orcid.org/0000-0002-5798-1298
ple, is a common sign that a patient has an obstruc-
tive airway disease such as asthma or chronic ob-
structive pulmonary disease Moussavi (2006). These
sounds can be recorded using digital stethoscopes and
other recording techniques. This digital data opens
the possibility of using machine learning to automat-
ically diagnose respiratory disorders such as asthma,
pneumonia and bronchiolitis, among others Nayden-
ova (2018).
When performed by advanced computational
methods, in-depth analysis of these sounds may be
of great support to the physician, which may result
in improved detection of respiratory diseases. In
this context, machine learning techniques have been
shown to provide an invaluable computational tool for
detecting disease-related anomalies in the early stages
of respiratory dysfunction Perna and Tagarelli (2019).
Based on this information, this article describes a
method capable of classifying four types of breath-
ing sounds (Normal, crackles, wheezes, both), the
ICBHI 2017 Challenge dataset was used Rocha et al.
(2018a). The method chosen and implemented con-
138
Saraiva, A., Santos, D., Francisco, A., Sousa, J., Ferreira, N., Soares, S. and Valente, A.
Classification of Respiratory Sounds with Convolutional Neural Network.
DOI: 10.5220/0008965101380144
In Proceedings of the 13th International Joint Conference on Biomedical Engineering Systems and Technologies (BIOSTEC 2020) - Volume 3: BIOINFORMATICS, pages 138-144
ISBN: 978-989-758-398-8; ISSN: 2184-4305
Copyright
c
2022 by SCITEPRESS – Science and Technology Publications, Lda. All rights reserved

sists of the construction of a CNN, but a feature ex-
traction method of breath sounds that was used for the
classification task is also implemented. The article is
divided into 6 sections, where 2 is related work, 3 is
the dataset description, while section 4 is the method-
ology used, section 5 presents the results and discus-
sions, while section 6 consists of in conclusion.
2 RELATED WORKS
Respiratory diseases are currently among the most
common causes of serious illness and death world-
wide. Prevention and early diagnosis are essential in
all diseases to limit or even reverse the tendency that
characterizes the spread of such diseases.The devel-
opment of advanced computational tools for the anal-
ysis of respiratory auscultation sounds can become
a watershed in detecting disease or disease-related
anomalies Perna and Tagarelli (2019).
For the diagnosis of respiratory diseases, it is ex-
tremely important to hear the sounds generated during
the patient’s breathing, which is usually heard by a
specialist with the help of a stethoscope Kandaswamy
et al. (2004). These include Asthma, Pneumonia,
COPD, among others, which are anomalies and may
cause unusual sounds. From this, several researches
are done in order to automate the detection and clas-
sification of respiratory sounds for the diagnosis of
diseases according to Pramono et al. (2017).
Automated classification of respiratory sounds has
been studied by several researchers in recent years,
automated respiratory analysis has the potential to de-
tect patient breathing anomalies and thereby signifi-
cantly increases the effectiveness of decision making
Rocha et al. (2018b, 2019).
Convolutional neural networks (CNNs) show that
in addition to being very effective in image classifica-
tion, it can also be used to classify soundtracks using
various CNN architectures as used by Hershey et al.
(2017).
3 DATASET DESCRIPTION
In this paper, we used the data set of Challenge
ICBHI 2017 Rocha et al. (2018a), This database of
breathing sounds was originally compiled to support
the scientific challenge organized by, in Informatics
in Biomedical Health ICBHI 2017. The database
was created by two research teams in Portugal and
Greece and includes 920 recordings acquired from
126 individuals with a total duration of 5.5 hours of
recordings. A total of 6898 respiratory cycles were
recorded, of which 3642 do not have an anomaly,
1864 contain crackles, 886 contain wheezing and 506
contain both crackles and wheezing.
Recordings were collected on heterogeneous
equipment and their duration ranged from 10 to 90
seconds. Also provided were the locations from
which the recordings were purchased. Data include
clean breathing sounds and noisy recordings that
simulate real-life conditions, collecting sounds from
seven chest locations. Patients with lower respiratory
tract infections, respiratory tract infections, COPD,
asthma and bronchiectasis were included. Sounds
were collected in clinical and non-clinical environ-
ments (patients’ residence). Patients cover all age
groups, children, adults and the elderly.
The respiratory sound characteristics of the
database were recorded by three experienced physi-
cians, two specialized pulmonologists and one cardi-
ologist Rocha et al. (2018b, 2019).
4 MATERIALS AND METHODS
In this section we present the methods used in this ar-
ticle, we also describe the metrics used to evaluate the
performance of the implemented neural network. The
diagram illustrated in Figure 1 shows the main con-
stituent parts of the method. It is composed of three
main modules: data pre-processing, training and test-
ing of CNN, and lastly it is analyzed its performance
with the metrics chosen by the present work.
Figure 1: Structure of the system.
4.1 Data Pre-processing
During processing, the 5 second size audio clips are
windowed, ie the audios are cut into segments Tzane-
takis and Cook (2002), if necessary, segments are
filled with zero so that all segments are the same
size. With this method you can increase the amount
of samples from each class to do CNN training. Thus
the quantity of each class was as follows: crackles
with 6415 samples, wheezing contains 7488 samples,
while both (crackles, wheezing) class has 732, and fi-
nally the class that has no respiratory abnormalities
has 6850 samples.
Classification of Respiratory Sounds with Convolutional Neural Network
139
4.1.1 Extract Features
The next step is to extract the resources to train our
model. To do this, a visual representation of each au-
dio sample has been made to identify classification
features using the same techniques used to classify
images with high precision. Perna (2018). For this
we used the technique known as Mel Frequency Cep-
stral Coefficients (MFCCs) SHIRALI-SHAHREZA
(2010). For each audio file in the dataset, we extracted
resources with the MFCC which means we have an
image representation for each audio sample. This way
you can train the classifier with these images.
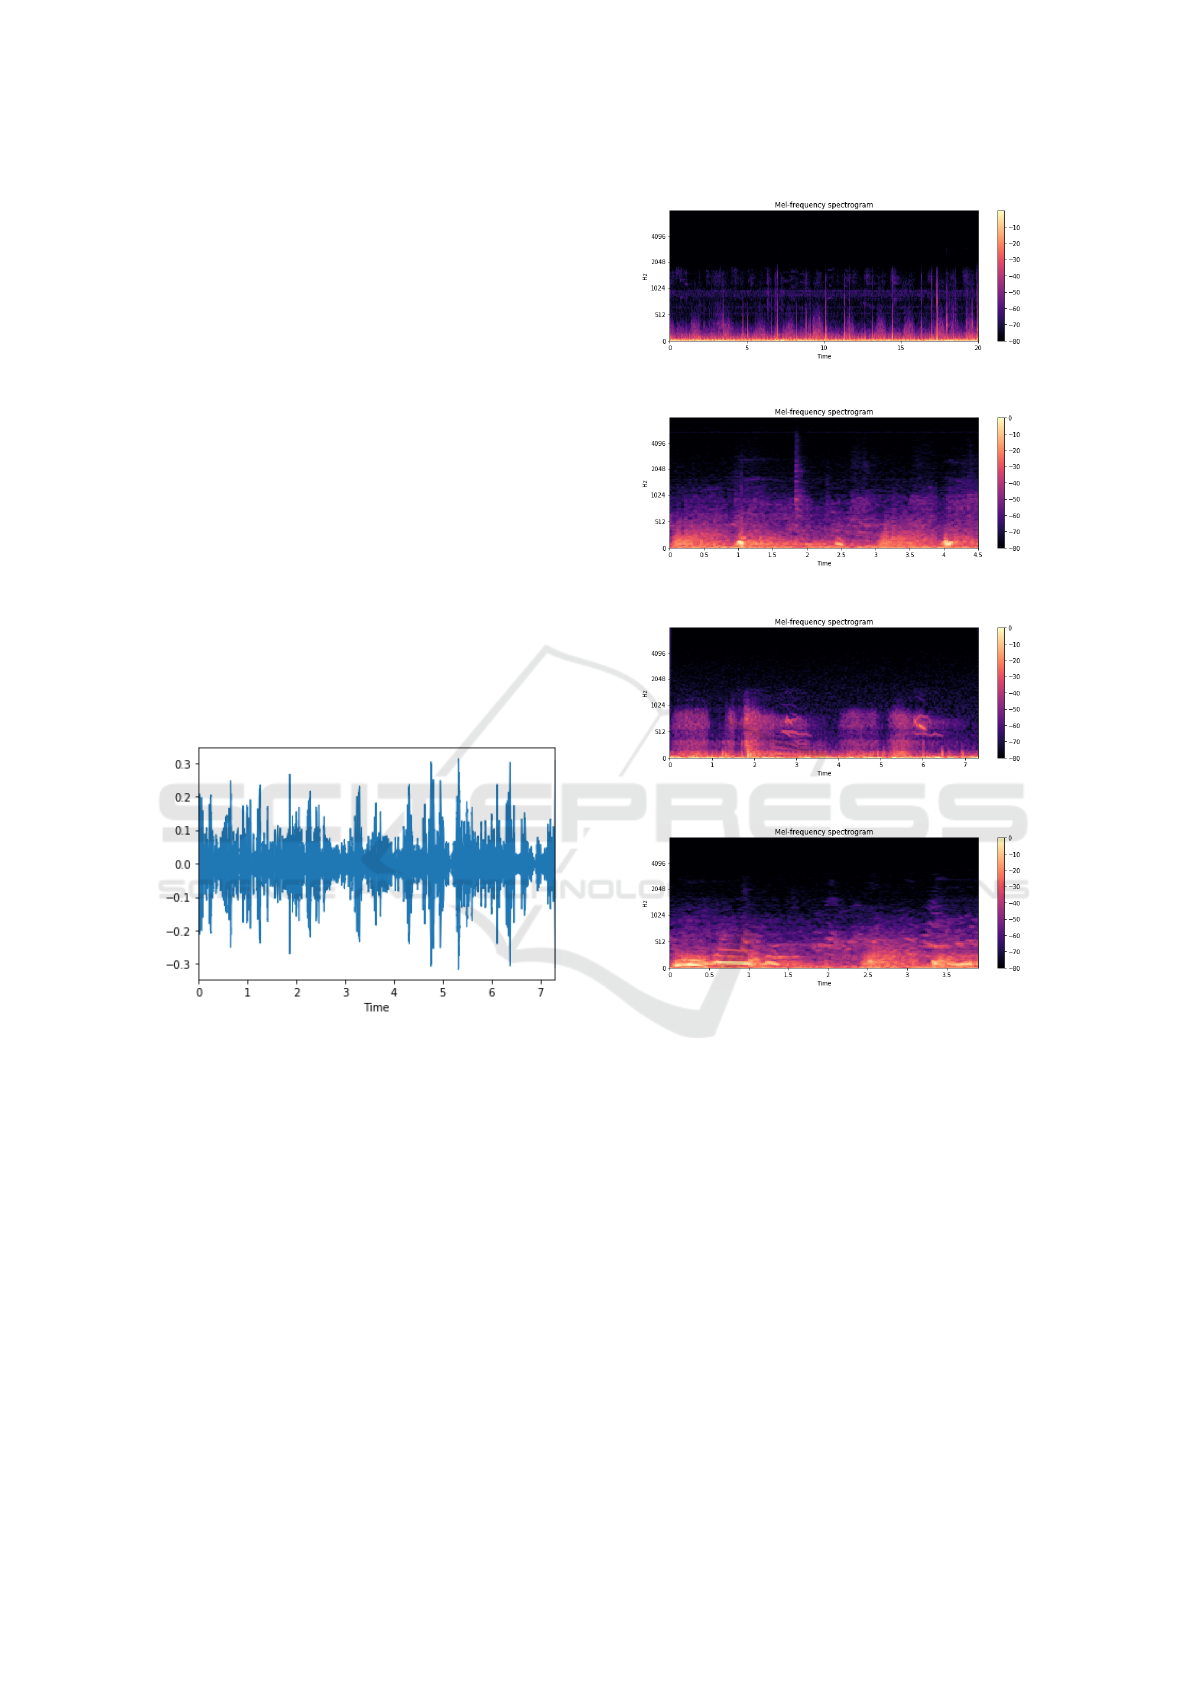
Spectrograms are a useful technique for visualiz-
ing the frequency spectrum of a sound and how they
vary over a very short period of time Jeffery et al.
(2018). The main difference is that a spectrogram
uses a spaced linear frequency scale (so that each fre-
quency compartment is spaced with an equal number
of Hertz), while an MFCC uses a quasi-logarithmic
spaced frequency scale, which is more similar to
the way how the human auditory system processes
sounds SHIRALI-SHAHREZA (2010).
Figure 2: Representation of a frequency domain sound sam-
ple (Class Wheezes).
The figure 2, It is possible to visualize one of the
dataset sound samples in its raw state, with its repre-
sentation in the time domain, comparing the ampli-
tude over time. Already the figures 3, 4 e 5, 6, these
are the audio samples with the technique used for fea-
ture extraction, which consists of the MFCC, similar
to a spectrogram, but with more distinct details, ac-
cording to the classification of the images, the size
used was 224x140, after the MFCC.
4.2 Metrics of the Evaluation
The final precision of the model is estimated by the
equation, where Ac
f
is the sum of the differences be-
tween the actual value y
i
and the expected value ˆy
i
Figure 3: MFCC None Class.
Figure 4: MFCC Crackles Class.
Figure 5: MFCC Wheezes Class.
Figure 6: MFCC Both Class.
with this it is possible to infer the generalization of
the network.
Ac
f
=
k
∑
i=1
(y
i
− ˆy
i
) (1)
As a statistical tool, we have the confusion matrix
that provides the basis for describing classification ac-
curacy and characterizing errors, helping to refine ac-
curacy. The confusion matrix is formed by a matrix
of squares of numbers arranged in rows and columns
that express the number of sample units of a given
category, inferred by a decision rule, compared to the
current category Saraiva et al. (2018).
The measurements derived from the confusion
matrix are: total accuracy, which was chosen by
the present work, individual class precision, producer
precision, user precision, Kappa index, among oth-
BIOINFORMATICS 2020 - 11th International Conference on Bioinformatics Models, Methods and Algorithms
140

Figure 7: Neural Network architecture.
ers.s.
Total accuracy is calculated by dividing the sum
of the main diagonal of the error matrix x
ii
, by the
total number of samples collected n, according to the
equation 3.
T =
∑
a
i
=
1
x
ii
n
(2)
As a statistical tool to evaluate model performance
is also used precision and recall, which are repre-
sented by the following equations 3, 4.
Precision =
T P
T P + FP
(3)
Recall =
T P
T P + FN
(4)
F1 Score is a simple metric that takes Precision
and Recall into account. This is simply the har-
monic medium of precision and recall Suominen et al.
(2008).
F1Score = 2 ∗
Precision ∗ Recall
Precision + Recall
(5)
4.3 Neural Network Training and
Architecture
According to Shahin et al. (2004), to train a machine
learning model, it is necessary to divide the data into
two sets (training and testing). The training dataset is
the data sample used to fit the model where the model
sees and learns from this data Krawczyk (2016). The
test data set, however, is the data sample used to pro-
vide an unbiased evaluation of the model in the train-
ing data set after adjusting the model hyperparameters
Krawczyk (2016).
To perform neural network training, the data set
was divided into training and testing, with 70% of
each class of data used for training and 30% used
for testing. Thus, the amount of training samples was
15.039 while for testing is 6.445 samples.
Figure 7 illustrates the proposed network architec-
ture for the sound classification task. All convolution
layers are applying 2D convolution and each has 32
kernels of size 5. Max pooling with size 5 and strides
2 are also used on all pooling layers. The predictor
network consists of 13 residual blocks followed by
four fully connected layers with 1024, 512, 256 and
4 neurons respectively and a softmax layer to predict
the output class Saraiva et al. (2019a), Saraiva et al.
(2019b).
For comparison purposes the neural network was
implemented in two ways, ie two tests with different
hyperparameters were performed Table 1. As a loss
function, cross entropy loss on the softmax output is
used. To train the model, the Adam Kingma and Ba
(2014) optimization method is used, with a learning
rate of 0.0001 for test 1 and 0.001 for test 2.
For the implementation of the neural network, the
computer library TensorFlow Abadi et al. (2016) is
used. Processing was performed using a Geforce
GTX 1060 graphics card with 1280 CUDA cores
(processors), 6 GB of dedicated memory, 12 GB of
RAM and a fourth generation Core i5 processor.
5 RESULTS AND DISCUSSIONS
This section discusses and presents the results ob-
tained at each stage of the development of this article.
A comparison between neural network implementa-
tion tests is provided in Table 1. A comparison is
also made with the works of SHIRALI-SHAHREZA
(2010), Ntalampiras (May). It is noteworthy that the
performance of the approached method using the met-
rics of section 4.2 is demonstrated
In SHIRALI-SHAHREZA (2010), a sound clas-
sification method is presented that uses the same
database used in this article, where a CNN archi-
tecture is implemented, but only binary classifica-
tion is made, which facilitates the performance of the
method, obtaining a average accuracy of 79%. Only
Classification of Respiratory Sounds with Convolutional Neural Network
141
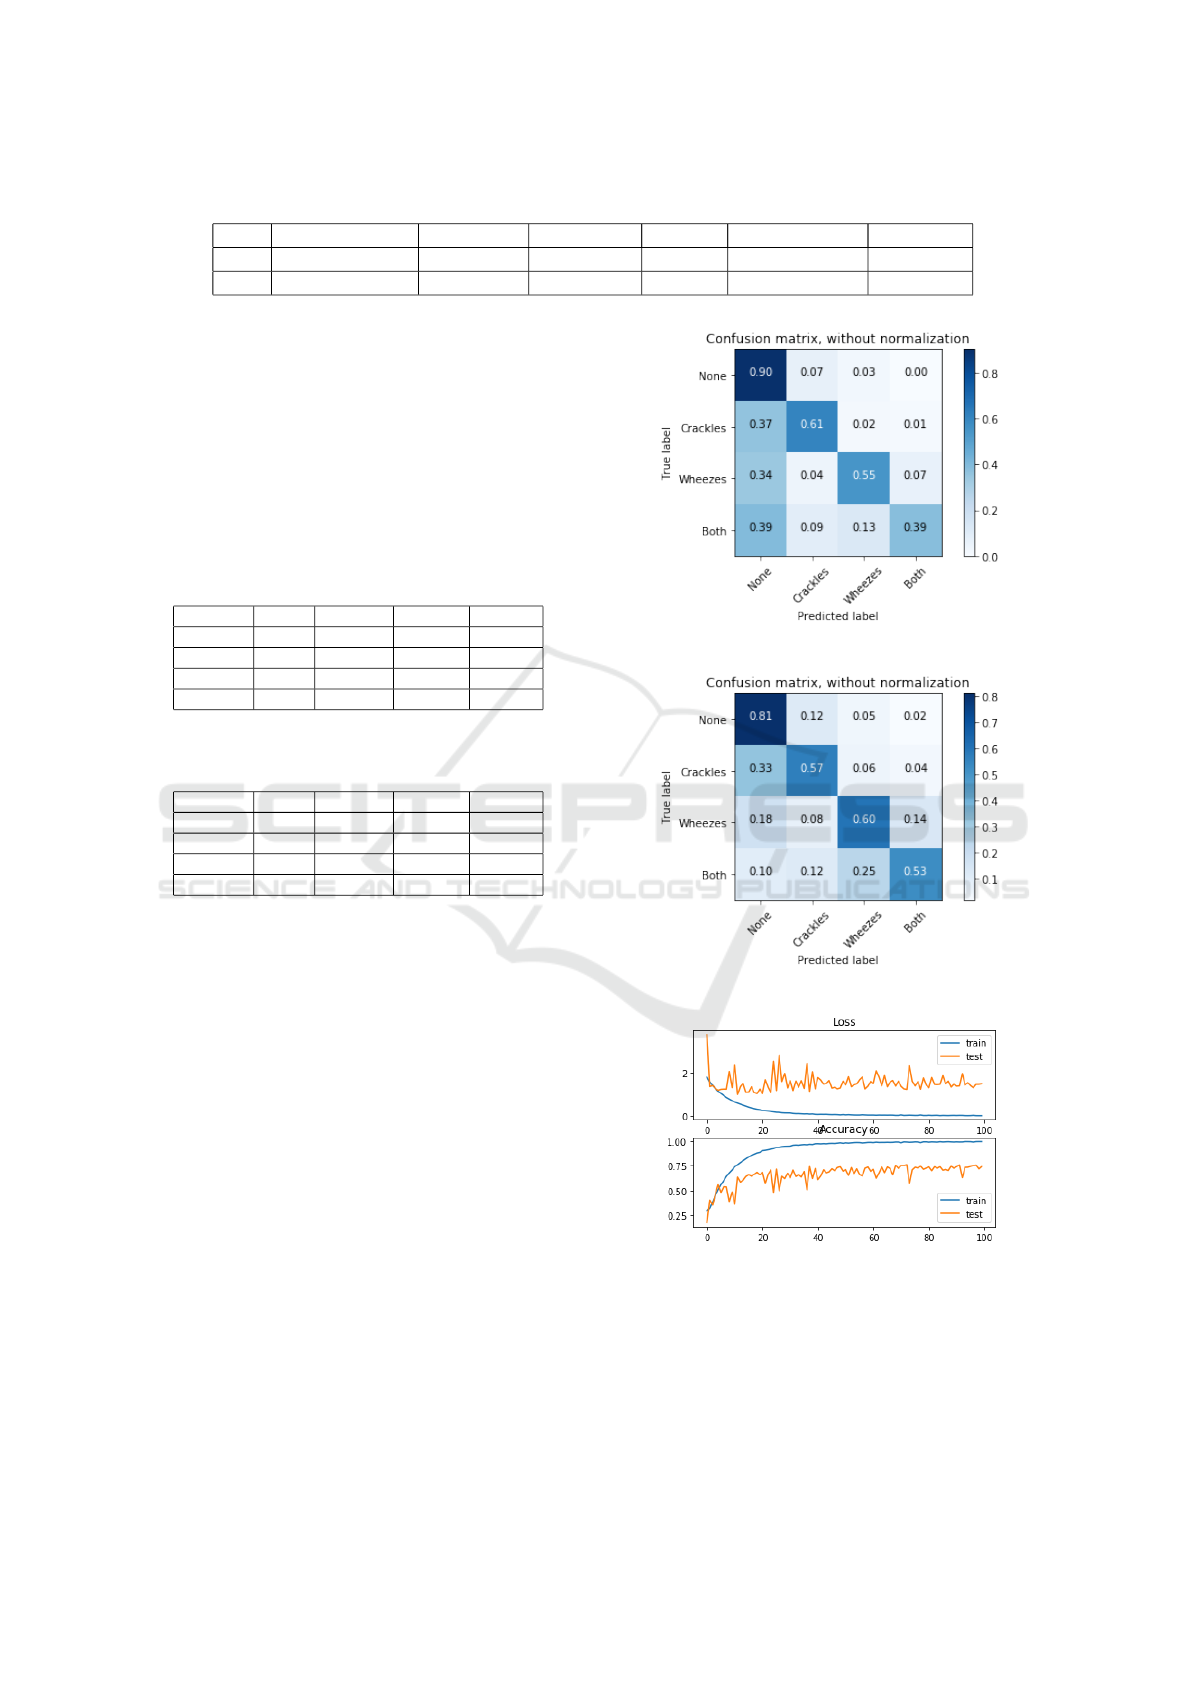
Table 1: Training hyperparameters Neural Network and Accuracy.
Test Learning Rate Optimiser Batch Size Epochs Training time Accuracy
1 0.0001 Adam 128 100 160 min 74.3%
2 0.001 Adam 200 200 330 min 72.0%
with binary sorting it is not possible to exploit all
database features. Already in Ntalampiras (May) is
developed a method of classification of sounds, this
method based on Hidden Markov models, was used
the same database, where was made classification of
the four types of sounds (Normal, crackles, wheez-
ing). , both crackles and wheezing) present in the
database, but the results were not satisfactory obtain-
ing on average only 64%.
Table 2: Results of the metrics used to evaluate the perfor-
mance of neural network test 1.
Class Recall Precision F1 Score Samples
None 90.0% 74.3% 81.1% 757
Crackles 61.2% 76.5% 67.6% 375
Wheezes 55.6% 71.7% 62.4% 184
Both 39.4% 72.2% 50.5% 109
Table 3: Results of the metrics used to evaluate the perfor-
mance of neural network test 2
Class Recall Precision F1 Score Samples
None 81.0% 78.1% 80.3% 757
Crackles 57.4% 64.3% 60.5% 375
Wheezes 60.3% 56.2% 58.7% 184
Both 53.7% 51.4% 52.8% 109
As mentioned in section 5.1, two implementation
tests were performed for neural network. The changes
of each test can be analyzed in Table 1. Already the
figures 8, 9, is demonstrate the confusion matrices of
each test. With this it is possible to identify which
implementation had the best performance for sound
classification, as well as analyze the training history
for tests 1 in the figure 10.
In Tables 2, 3, one can analyze the metric results
for each class, as one can see that the model per-
formed well, even with the unbalanced dataset. In Ta-
ble 1, one can analyze the accuracy values for testing,
with test 1 performing better with respect to this met-
ric used. As can be analyzed the results were satisfac-
tory compared to SHIRALI-SHAHREZA (2010) and
(Ntalampiras, May). The method proposed in this ar-
ticle obtained results above 74%, in the classification
of respiratory sounds used the four classes available
in the database used.
Figure 8: Confusion matrix test 1.
Figure 9: Confusion matrix test 2.
Figure 10: Training progression test 1.
6 CONCLUSION
Based on the methodology of this paper, a convo-
lutional neural network with a deep learning frame-
work was developed that originally integrates pre-
BIOINFORMATICS 2020 - 11th International Conference on Bioinformatics Models, Methods and Algorithms
142

processing based on 5-second windowed audio clips
for better classification of breathing sounds: normal,
wheezing, crackling and both (wheezing and crack-
ling)
The article was divided into three parts, we de-
scribe the network architecture as well as the crucial
phase of pre-processing and classification. The per-
formance results obtained suggest that CNNs are a
viable tool for detecting specific characteristics in res-
piratory data and are capable of accurately classifying
respiratory sounds inside and outside of laboratory
environments using CNN. This article is expected to
inspire and enable further research in the analysis of
respiratory sounds.
REFERENCES
Abadi, M., Barham, P., Chen, J., Chen, Z., Davis, A.,
Dean, J., Devin, M., Ghemawat, S., Irving, G., Isard,
M., et al. (2016). Tensorflow: A system for large-
scale machine learning. In 12th {USENIX} Sympo-
sium on Operating Systems Design and Implementa-
tion ({OSDI} 16), pages 265–283.
Hershey, S., Chaudhuri, S., Ellis, D. P. W., Gemmeke,
J. F., Jansen, A., Moore, R. C., Plakal, M., Platt, D.,
Saurous, R. A., Seybold, B., Slaney, M., Weiss, R. J.,
and Wilson, K. (2017). Cnn architectures for large-
scale audio classification. In 2017 IEEE International
Conference on Acoustics, Speech and Signal Process-
ing (ICASSP), pages 131–135.
Jeffery, T., Cunningham, S., and Whiteside, S. P. (2018).
Analyses of sustained vowels in down syndrome (ds):
a case study using spectrograms and perturbation data
to investigate voice quality in four adults with ds.
Journal of Voice, 32(5):644–e11.
Kandaswamy, A., Kumar, C. S., Ramanathan, R. P., Jayara-
man, S., and Malmurugan, N. (2004). Neural clas-
sification of lung sounds using wavelet coefficients.
Computers in biology and medicine, 34(6):523–537.
Kingma, D. P. and Ba, J. (2014). Adam: A
method for stochastic optimization. arXiv preprint
arXiv:1412.6980.
Krawczyk, B. (2016). Learning from imbalanced data: open
challenges and future directions. Progress in Artificial
Intelligence, 5(4):221–232.
Morillo, D. S., Moreno, S. A., Granero, M.
´
A. F., and
Jim
´
enez, A. L. (2013). Computerized analysis of res-
piratory sounds during copd exacerbations. Comput-
ers in biology and medicine, 43(7):914–921.
Moussavi, Z. (2006). Fundamentals of respiratory sounds
and analysis. Synthesis lectures on biomedical engi-
neering, 1(1):1–68.
Naydenova, E. (2018). Machine learning for childhood
pneumonia diagnosis. PhD thesis, University of Ox-
ford.
Ntalampiras, S., . P. I. (2019, May). Classification of sounds
indicative of respiratory diseases. pages 93–103.
Pasterkamp, H., Kraman, S. S., and Wodicka, G. R. (1997).
Respiratory sounds: advances beyond the stethoscope.
American journal of respiratory and critical care
medicine, 156(3):974–987.
Perna, D. (2018). Convolutional neural networks learn-
ing from respiratory data. In 2018 IEEE Interna-
tional Conference on Bioinformatics and Biomedicine
(BIBM), pages 2109–2113. IEEE.
Perna, D. and Tagarelli, A. (2019). Deep auscultation: Pre-
dicting respiratory anomalies and diseases via recur-
rent neural networks. In 2019 IEEE 32nd Interna-
tional Symposium on Computer-Based Medical Sys-
tems (CBMS), pages 50–55. IEEE.
Pramono, R. X. A., Bowyer, S., and Rodriguez-Villegas,
E. (2017). Automatic adventitious respiratory sound
analysis: A systematic review. PLOS ONE, 12(5):1–
43.
Rocha, B., Filos, D., Mendes, L., Vogiatzis, I., Peran-
toni, E., Kaimakamis, E., Natsiavas, P., Oliveira, A.,
J
´
acome, C., Marques, A., et al. (2018a). A res-
piratory sound database for the development of au-
tomated classification. In Precision Medicine Pow-
ered by pHealth and Connected Health, pages 33–37.
Springer.
Rocha, B. M., Filos, D., Mendes, L., Serbes, G., Ulukaya,
S., Kahya, Y. P., Jakovljevic, N., Turukalo, T. L., Vo-
giatzis, I. M., Perantoni, E., Kaimakamis, E., Nat-
siavas, P., Oliveira, A., J
´
acome, C., Marques, A.,
Maglaveras, N., Paiva, R. P., Chouvarda, I., and
de Carvalho, P. (2019). An open access database for
the evaluation of respiratory sound classification algo-
rithms. Physiological Measurement, 40(3):035001.
Rocha, B. M., Filos, D., Mendes, L., Vogiatzis, I., Peran-
toni, E., Kaimakamis, E., Natsiavas, P., Oliveira, A.,
J
´
acome, C., Marques, A., Paiva, R. P., Chouvarda, I.,
Carvalho, P., and Maglaveras, N. (2018b). α respira-
tory sound database for the development of automated
classification. pages 33–37.
Saraiva, A., Ferreira, N., Sousa, L., Carvalho da Costa, N.,
Sousa, J., Santos, D., and Soares, S. (2019a). Classi-
fication of images of childhood pneumonia using con-
volutional neural networks. In 6th International Con-
ference on Bioimaging, pages 112–119.
Saraiva, A., Melo, R., Filipe, V., Sousa, J., Ferreira, N. F.,
and Valente, A. (2018). Mobile multirobot manipula-
tion by image recognition.
Saraiva, A. A., Santos, D. B. S., Costa, N. J. C., Sousa, J.
V. M., Ferreira, N. M. F., Valente, A., and Soares, S.
F. S. P. (2019b). Models of learning to classify x-ray
images for the detection of pneumonia using neural
networks. In BIOIMAGING.
Shahin, M. A., Maier, H. R., and Jaksa, M. B. (2004).
Data division for developing neural networks applied
to geotechnical engineering. Journal of Computing in
Civil Engineering, 18(2):105–114.
SHIRALI-SHAHREZA, M. Hassan; SHIRALI-
SHAHREZA, S. (2010). Effect of mfcc normalization
on vector quantization based speaker identification. In
IEEE International Symposium on Signal Processing
and Information Technology, pages 250–253. IEEE.
Classification of Respiratory Sounds with Convolutional Neural Network
143

Suominen, H., Ginter, F., Pyysalo, S., Airola, A., Pahikkala,
T., Salanter, S., and Salakoski, T. (2008). Ma-
chine learning to automate the assignment of diag-
nosis codes to free-text radiology reports: a method
description. In Proceedings of the ICML/UAI/COLT
Workshop on Machine Learning for Health-Care Ap-
plications.
Tzanetakis, G. and Cook, P. (2002). Musical genre classifi-
cation of audio signals. IEEE Transactions on speech
and audio processing, 10(5):293–302.
BIOINFORMATICS 2020 - 11th International Conference on Bioinformatics Models, Methods and Algorithms
144
