Acquisition Evaluation on Outdoor Scanning for Archaeological Artifact
Digitalization
Aufaclav Zatu Kusuma Frisky
12 a
, Adieyatna Fajri
3
, Simon Brenner
1
and Robert Sablatnig
1 b
1
Computer Vision Lab, Institute of Visual Computing and Human-Centered Technology, Faculty of Informatics, TU Wien,
Wien, Austria
2
Department of Computer Science and Electronics, Universitas Gadjah Mada, Yogyakarta, Indonesia
3
Department of Archaeology, Universitas Gadjah Mada, Yogyakarta, Indonesia
Keywords:
3D Acquisition, Cultural Heritage, 3D Reconstruction, 3D Comparison, Outdoor Scanning.
Abstract:
Archaeological archives are important assets because they provide primary information resources for research,
mainly digital archives that not degraded. Instead of directly visiting a site, an archaeologist can examine and
manipulate the data without harming the real object. However, choosing an efficient scanning scheme with
detailed results is a challenging task. In this work, we present new sculpture models obtained in three different
ways and assess it in two comparison approaches: A quantitative and qualitative assessment. The quantitative
comparison architecture provides a detailed assessment of three different scanning mechanisms in two stages:
point cloud and mesh comparison. This evaluation is purposed to describe the differences between unmodified
data. Finally, a qualitative evaluation is performed by an expert and practitioner to explain the difference based
on four different produced models to help their needs in the real application.
1 INTRODUCTION
Archaeological archives should represent a real con-
dition of the artifact, and it is a researchable resource
generated by archaeological investigations. These
archives are also the primary source of information
to understanding any interpretations of published re-
sults. Furthermore, the data collection related to the
records of all archaeological remains must be updated
periodically(CIFA, 2014). Instead of a direct visit
to sites, an archaeologist can examine the digital in-
frastructure from the data and manipulate it without
harming the real object. However, the reconstruc-
tion becomes challenging due to environmental con-
ditions, especially for artifacts located in an outdoor
environment.
In the indoor environment, the lighting condition
can be controlled to meet particular requirements. In
the Michelangelo project (Levoy et al., 2000), the
lighting from various directions around the statue is
in the fixed distance. These setups are possible be-
cause the indoor environment usually is reachable and
can be manipulated based on the requirement. On
the other hand, several outdoor scanning approaches
a
https://orcid.org/0000-0001-7512-2043
b
https://orcid.org/0000-0003-4195-1593
have been created to solve the reconstruction prob-
lem, such as Photogrammetry (Boehler and Marbs,
2004), Structured Light (Georgopoulos et al., 2010),
and low-cost scanner (Gonzalez et al., 2013). How-
ever, these works are only focused on their specific
problems.
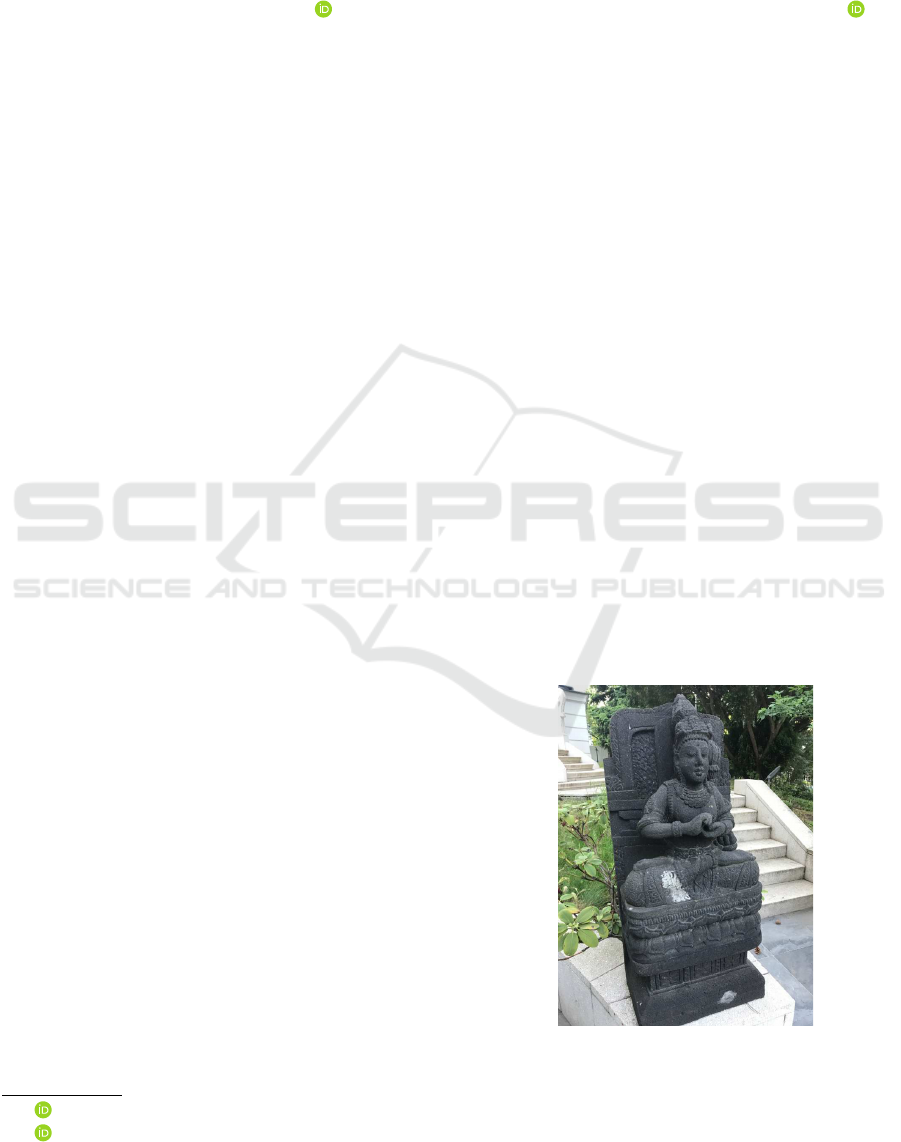
Figure 1: Sculpture object.
We made a detailed comparison on point clouds,
geometry, and completeness to understand the differ-
ence between the processes. Hence, several results
792
Frisky, A., Fajri, A., Brenner, S. and Sablatnig, R.
Acquisition Evaluation on Outdoor Scanning for Archaeological Artifact Digitalization.
DOI: 10.5220/0008964907920799
In Proceedings of the 15th International Joint Conference on Computer Vision, Imaging and Computer Graphics Theory and Applications (VISIGRAPP 2020) - Volume 5: VISAPP, pages
792-799
ISBN: 978-989-758-402-2; ISSN: 2184-4321
Copyright
c
2022 by SCITEPRESS – Science and Technology Publications, Lda. All rights reserved
from four different methods without any modifica-
tions (such as noise reduction, smoother, and hole
filling) are used to keep their originality. The con-
tribution of this paper is two-fold: First, a scan-
ning of Indonesian sculptures in an outdoor environ-
ment that can be used by other archaeologists or sci-
entists to study Indonesian culture to acknowledge
the complexity of Indonesian sculptures. Second, a
comparison of various ways of reconstruction, i.e.,
Photogrammetry, ASUS XTION, AICON Primescan
Structural light scanner, and Single Image Recon-
struction (SIR) to investigate the characteristics of the
surface results in outdoor sculptures. In the final part,
these results are given to an Indonesian archaeologist
and qualitatively assessed based on the requirement
on the real application.
2 RELATED WORKS
With the increasing demand for 3D spatial infor-
mation in cultural heritage documentation, the tech-
niques of obtaining it have been increasingly impor-
tant. In particular, a point clouds with high accuracy
and density are demanded to describe the detail infor-
mation of object components (Lee et al., 2015). Many
different devices have been used to build 3D models,
with each system coming with its limitations, advan-
tages, and costs. It should be noted that many restric-
tions are due to the properties of the various objects
that are to be digitized. Between all the available sen-
sors, methods, and platforms, the most suitable ones
based on expert requirements should be chosen care-
fully(Remondino and Rizzi, 2010).
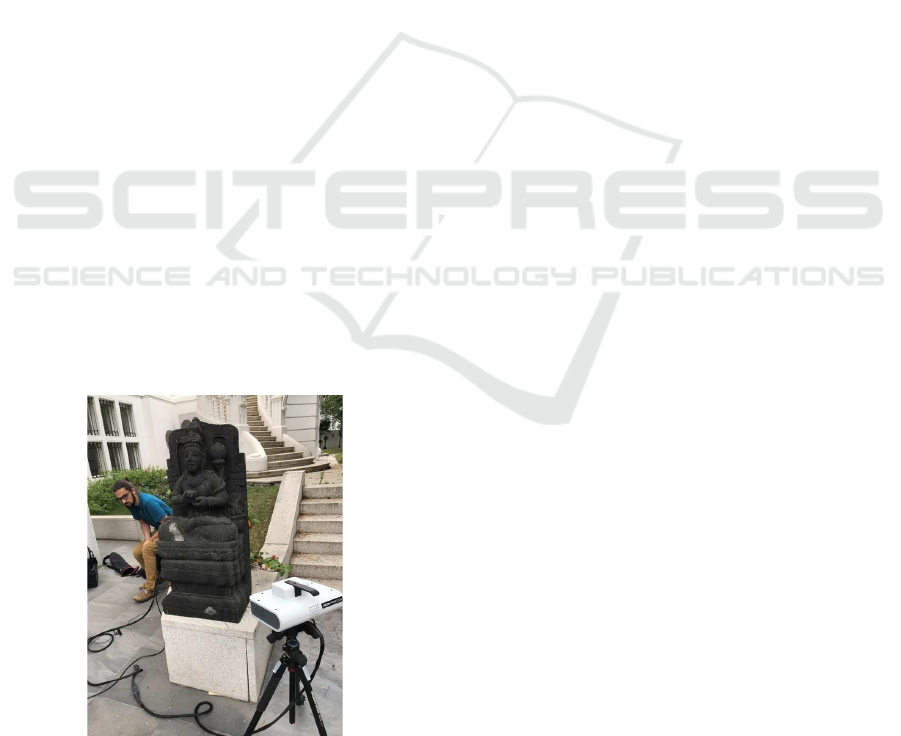
Figure 2: The outdoor scanning process of Structured Light
Scanner to capture the sculpture.
In cultural heritage preservation, Photogramme-
try and laser scanning have long played an essen-
tial role in archaeological research (Remondino and
Rizzi, 2010). Photogrammetry, i.e., extracting infor-
mation from a series of images, has long been used
to record, measure, and model archaeological struc-
tures of different-size artifacts. An alternative to the
most known and market-dominating laser scanners
is Structured Light (Georgopoulos et al., 2010). A
Structured Light 3D scanner projects a pattern of light
on the object and detects the deformation of the pat-
tern on it. The scanners are non-contact optical sys-
tems, similar to Photogrammetry; they transform im-
age pairs to surface information. The main advan-
tage of using this scanner is the faster speed com-
pared to a typical laser scanner (Georgopoulos et al.,
2010). However, a problem arises when the location
of the sculpture is in an area that lacks electricity and
unobstructed sunlight. Direct sunlight intensity has
2-5 orders of magnitude brighter than the projected
structured light (Gupta et al., 2013), and it makes
a distortion on the result. Therefore, the structured
light method is rarely used for outdoor scanning. In
Gupta’s works (Gupta et al., 2013), they show that
the reconstruction quality of an object placed out-
doors degrades under intense ambient illumination,
even when spectral filtering is used. However, the
content of the artifact can still be seen, including the
engraving reliefs in the objects. Based on this evi-
dence, we include the Structured light method into
one of our compared methods. On the other hand,
a new approach called Single Image Reconstruction
(SIR) recovering the geometric information from a
single photograph or synthetic image. This method
tried to infer the 3D shape of complex objects, given
from one picture. Recent work in cultural heritage
application, Pan et al. (Pan et al., 2018) uses Deep
Learning to predict the depths in the relief images
from Borobudur temple. However, the real problem
with SIR in full 3D reconstruction remains the same,
as it is shown from the one perspective.
3 DATA PREPARATION
Firstly, we investigate 3D data obtained from several
scanning processes. This process is divided into two
parts, which are quantitative and qualitative evalua-
tions. Quantitative evaluation measures unprocessed
data by finding the distance and differences. On the
other hand, qualitative evaluation measures the effec-
tiveness of the results on user experience. The qual-
itative and quantitative evaluation is described in the
next subsection.
Acquisition Evaluation on Outdoor Scanning for Archaeological Artifact Digitalization
793
Full Point
Comparison
Density
Photogrammetry
Comparison
POINT CLOUD
COMPARISON
Slice Depth
Distance
Full mesh
Comparison
Direct View
Mean Angular
Difference
MESH
COMPARISON
ALIGNMENT
Structured Light Scanner
Photogrammetry
Low-Cost Scanner
Hausdorff
Distance
Ph
Ph
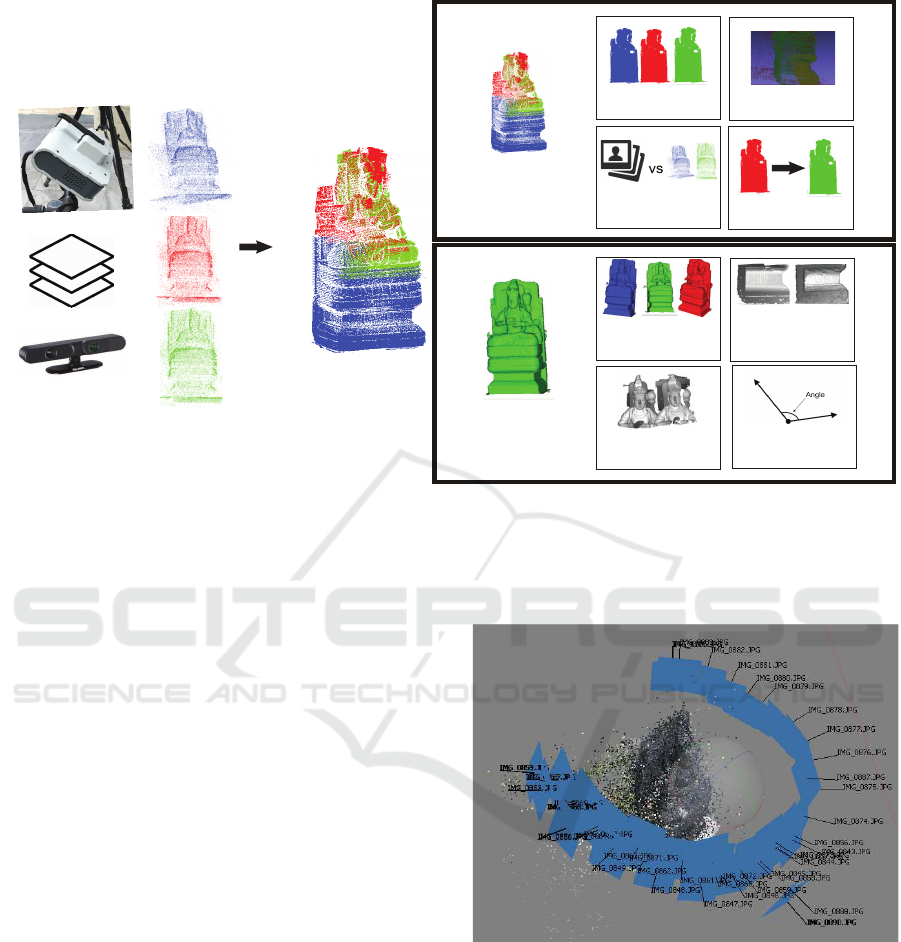
Figure 3: Quantitative Evaluation scheme.
3.1 Quantitative Evaluation
The sculpture scanned in this paper is an Indonesian
Sculpture replica of Prajnaparamita Sculpture made
from Candi Stone and located in the outdoor envi-
ronment (see Figure 1). Candi stone, also known as
Black Lava Stone, is a type of black basalt quarried
in Indonesia. The scanning is done under direct sun-
light, without a cloud, between 50.000 and 100.000
lux in illuminance. The four different processes used
the following configuration:
• Structured Light Scanner. The scanner used is
AICON Primescan with 2 x 8 Megapixel cam-
era resolution, 28 Megapixel projection resolu-
tion, and a fixed 50 mm field of view. The distance
between the object and the scanner is one meter,
but the angle is variance. The whole process con-
sisted of forty times of scanning from different an-
gles (see Figure 2). After that, these chunks of
scans are manually registered to obtain the com-
plete point cloud of the statue.
• Photogrammetry. In this method, 48 RGB pic-
tures with 3.024 x 4.032 resolution are taken from
iPhone 7, covering all the sides of the statue. The
pictures are taken randomly from different angles,
yet still covering all areas of the statue (Figure
4). The photogrammetry process is performed us-
ing Agisoft using a high-density option. In qual-
itative evaluation, we used three different reso-
lutions, i.e., 1.280 x 720 (720p), 1.920 x 1.080
(1080p), and 3.024 x 4.032 (4K).
Figure 4: Photogrammetry setup of 48 images.
• Low-Cost Scanner. The low-cost scanner used in
this paper is ASUS XTION Primesense. Based
on Gonzalez’s (Gonzalez et al., 2013) accuracy
test, to get a 15mm accuracy, the distance be-
tween the scanning device and the object should
be maintained in one meter. In this work, we
follow the configuration on Gonzalez work, start-
ing from one meter using freehand scanning. The
process tried to capture a whole sculpture while
maintaining the distance. The scanning process is
performed in the Skanect application.
VISAPP 2020 - 15th International Conference on Computer Vision Theory and Applications
794
• Single Image Reconstruction. Single Image Re-
construction (SIR) approach used in this paper
is a method in Pan et al.’s (Pan et al., 2018)
with input 720p from frontal image data. Next, a
pre-trained model from Eigen work (Eigen et al.,
2014) is used to obtain the depth and point clouds.
The number of the point cloud is the same num-
ber with a number of pixels in the depth image.
Furthermore, the stochastic point-based rendering
method is used to reconstructed point clouds to
obtain the 3D model.
To be able to compare 3D models, the aligning
process is needed. One of the most common ways to
align 3D data onto one another is the Iterative Clos-
est Point (ICP) algorithm by Besl and McKay in (Besl
and McKay, 1992). This method minimizes the dif-
ference between two-point clouds by decreasing dis-
tances between them in every iteration. ICP algorithm
is a widely popular solution and has been improved
several times. The algorithm keeps iterating until it
finds the minimum Mean Square Difference (MSD)
while we fixed the iterative count parameter steadily
at 100.
After the point clouds are aligned, it converted
into a mesh using Poisson Reconstruction (Kazhdan
et al., 2006). Poisson reconstruction is chosen be-
cause of the detailed result by combining the bene-
fits of both global and local fitting schemes. The pur-
pose of this conversion is to investigate the surface
produced from point cloud by each method. Since
this part of the work is focusing on investigating the
surface alone, the comparison is only made to the
scanned surface, ignoring the hole. There are three
methods used in this paper to evaluate the quality of
the surface: Visual, Depth Distance, and Mean Angu-
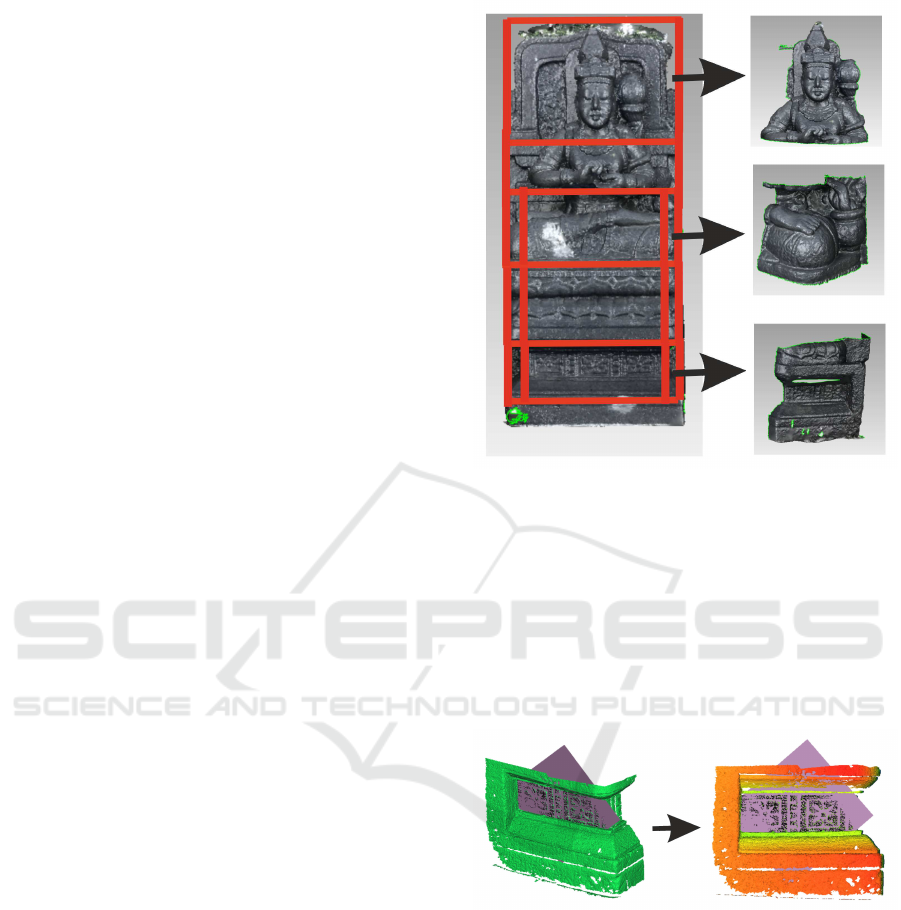
lar Difference. Different parts of the statue give dif-
ferent errors and complexity. Therefore, in order to
achieve a fair comparison, the sculpture is sliced into
eleven smaller pieces (see Figure 5), and the differ-
ences between each part are investigated separately.
Different level of depth is a problem, especially
when comparing the 3D models from different scan-
ning processes. To overcome that problem, In Figure
6, it can be seen that a ground plane is used as a basis
for zero values depth, where the camera direction is
orthogonal from the surface of this plane. Based on
the visual result, it is decided to use a structured light
mesh model to find the plane, and the other meshes
(Photogrammetry and Low-cost scanner) are aligned
to this chosen one. This plane is obtained by perform-
ing RANSAC shape finder from (Yang and F
¨
orstner,
2010). After all meshes are aligned, then the depth
value is measured. Using this obtained depth value,
we obtained the surface normal by calculating the nor-
Figure 5: Slice configuration. The orange line is the border
of a slice, thin box in the right and left means it is the right
and left side of the mesh.
mal using the basis plane. Afterward, based on Acker-
mann and Goesele’s work,(Ackermann and Goesele,
2015), the Mean Angular Difference (MAD) is calcu-
lated by finding the mean difference value. In the next
section, a result comparison of three different meshes,
i.e. Structured Light Scanner (SLS), Photogramme-
try(PH), and Low-cost Scanner(LC) are presented.
Figure 6: Left image: Mesh with with basis plane (rectan-
gle) from RANSAC shape detector, Right image: Aligned
mesh.
3.2 Qualitative Evaluation
In this section, the qualitative measure shows the dif-
ference of quality impact on archaeologist’s works.
Two parts of the evaluation process are conducted,
which are the reconstruction process and result. Both
the reconstruction process and the mesh model of six
different results are randomly given to ten archaeolo-
gists and conduct a direct interview to assess it. The
final result of this assessment is adaptability, flexibil-
ity, efficiency, and post-processing. From these ex-
Acquisition Evaluation on Outdoor Scanning for Archaeological Artifact Digitalization
795
aminers, five of them are an expert, and the others
are practitioner and student. The expert consisted of
lecturers at universities who deepened their knowl-
edge about Indonesian artifacts and experts from In-
donesian artifact observation centers. Also, the prac-
titioner is field staff from the observation center and
master students from the archaeologist department.
4 RESULTS
Based on Figure 3, the comparison step mainly con-
sists of two parts: point clouds and mesh comparison.
The point clouds comparison process mainly used the
full, unprocessed point cloud and compared the re-
sults between them. There are four steps included in
point cloud comparison, i.e., full point cloud compari-
son, direct view, two-pair Photogrammetry, and Haus-
dorff distance. In mesh comparison, there are two
parts of the process, full and slices comparison. The
full-size part, there is a direct full mesh comparison
using a direct view, slices direct view, slice depth dis-
tance, and mean angular difference. In the next sec-
tion, all the results in each process is explained more
detail.
4.1 Point Cloud Comparison
In our first investigation, we determine how well the
Photogrammetry worked, including the minimum re-
quirements for the photogrammetry algorithm. The
data consists of 48 images, and neighboring pairs of
images are created. We perform Photogrammetry on
these pairs to obtaining the points clouds. From 48
images, we created eight neighboring image pairs and
an 8-point cloud to be compared with structured light
mesh and low-cost scanner results. The numbers in
each pair name are the image numbers; for exam-
ple, pair1-2 refers to the pairing of images 1 and 2.
In this experiment, pair1-2 and pair3-4 are used for
the bottom-left side of the statue, pair3-4 is used for
the upper-left side, pair14-15 and pair15-16 are used
to check the bottom-front side, pair17-18 is used to
check the upper-front side, pair33-34 is used to check
the bottom-right side, and pair34-35 is used to check
the upper-right side. In other words, two models are
in close proximity by hand, then registered using ICP.
Finally, all 48 images are aligned and compared with
structured light and low-cost mesh. It can be seen
in Table 1, that pair15-16 gives the highest Mean
Squared Difference(MSD) and variance rather than
the other. It can be concluded that the comparison
at the top front part of the statue performs worse and
more complicated surface than the other part.
Table 1: MSD two-pair point cloud of photogrammetry
compared with SLS and LC in millimeter.
Config. PH vs SLS PH vs LC Variance
Model (a) (b) (a) k (b)
pair1-2 42.23 35.34 5.25k4.32
pair2-3 41.54 33.65 4.32k5.25
pair3-4 40.34 35.45 4.45k6.23
pair14-15 45.88 38.32 18.1k8.45
pair15-16 52.56 44.78 15.5k12.4
pair17-18 44.50 39.67 19.4k11.5
pair33-34 42.30 34.85 4.37k5.68
pair34-35 41.68 33.87 6.61k3.46
Max. Dist. 68.76 51.48 -
Average 43.88 36.99 -
Next, We perform Hausdorff distance comparison
to determine the distance between point clouds. Ta-
ble 2 shows the Hausdorff distance and MSD between
three full sculpture point clouds. Based on this result,
the distance between ST and LC is higher than the
other. It proves that the gap between this performance
is quite low compared with others. Another factor
is because both methods directly scan the object; the
noise produces in both processes is minimum. On the
other hand, PH, have a noise from the background,
which is not included in the other approaches. Be-
cause of that, it can be seen that both results in two
comparison processes with PH is higher than SLS vs.
LC.
Table 2: Comparison results of Hausdorff Distance (H) and
MSD in full point cloud against Structured Light Scanner
(SLS) in millimeter.
Configuration SLS vs. LC SLS vs. PH
Full(H) 4.88 28.7
Full(MSD) 2.41 16.0
Variance (MSD) 0.32 6.85
Max. Dist. (MSD) 2.71 18.3
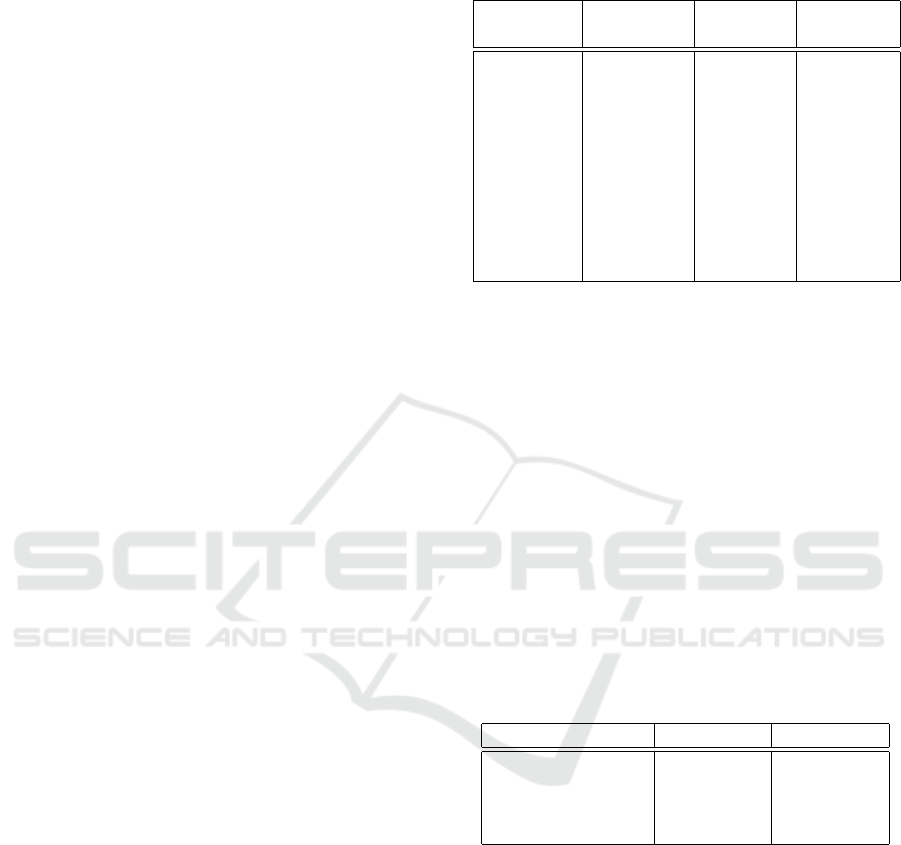
In density comparison, two sets of point clouds
have a close Hausdorff distance if every point of each
set is proximate to the other set. Differences in den-
sity are depicted in Figure 7, where the structured
light shows the highest density compared to the other
two. On the other hand, because of the usage of
background in the image, the Photogrammetry’s point
clouds is sparser than other results.
4.2 Mesh Comparison
In this section, fully connected point clouds, called
meshes, are used for comparison. Connecting point
clouds using Poisson Reconstruction created these
VISAPP 2020 - 15th International Conference on Computer Vision Theory and Applications
796
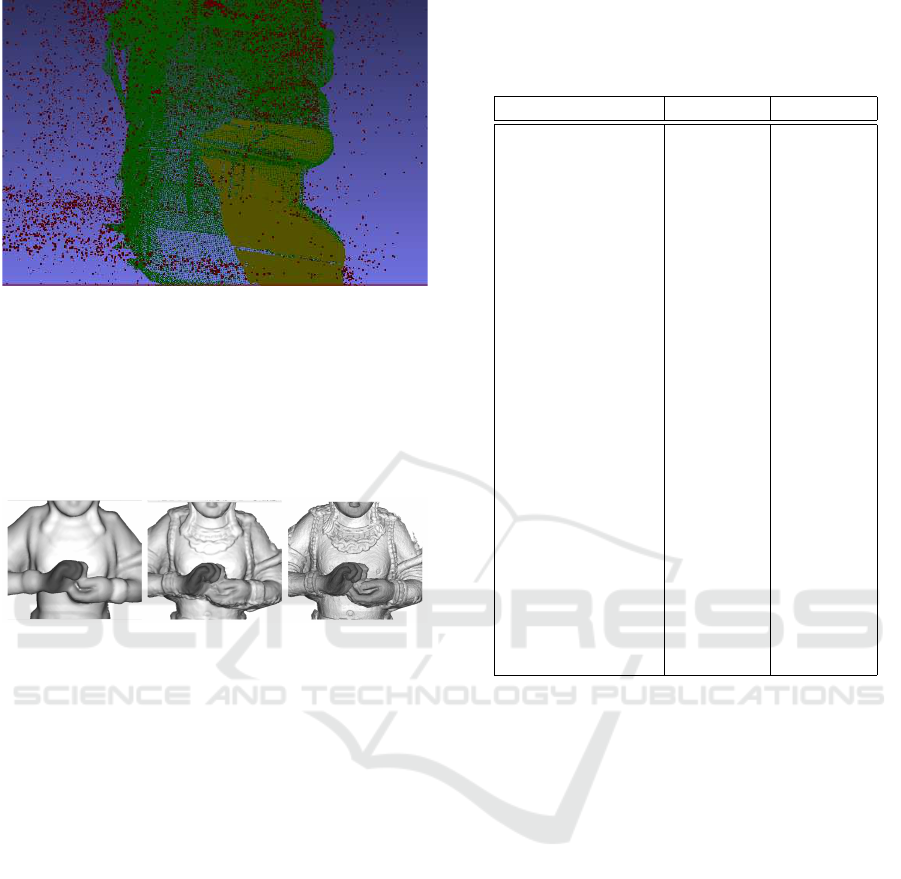
Figure 7: Point cloud density comparison. Red is Pho-
togrametry, Green is Low-cost scanner, and Yellow is Struc-
tured light scanner.
meshes. The result of surface reconstruction can be
seen in Figure 8. Structured light gives the highest
level of detail, followed by Photogrammetry with 4k
resolution and low-cost scanner.
Figure 8: Direct view comparison of three different mesh.
Left: low-cost scanner, middle: photogrammetry, right:
structured light.
In the next experiment, to know the distance be-
tween the two depth images, Euclidean Distance is
used to measure the performance. As shown in Table
2, Slice 5 has a higher value than average in all dis-
tance comparisons. However, some have more differ-
ence values than others because of the different levels
of difficulty in reconstructing each part of the statue.
The geometrical quality of the mesh can change the
DD and MAD results. It is proved that different parts
can produce different performance results based on
how detailed the meshes are.
4.3 Qualitative Result
In this section, all the processes are evaluated based
on two parts. First is the effectiveness of the scan-
ning process, and the second is the quality of the re-
sults. For the effectiveness, we implement a param-
eter for the adaptability, flexibility, time efficiency
(Georgopoulos and Stathopoulou, 2017), in the as-
sessment. For the result, examiners are invited to fill
the evaluation. The variation engraved in the sculp-
ture surface itself plays a significant role for the ar-
Table 3: Results of Depth Distance (DD) using Euclidean
Distance and Mean Angular Difference (MAD) from three
different comparisons : SLS , PH, and LC using eleven
slices (in mm).
Configuration ST vs. LC ST vs. PH
Slice1 (DD) 215.66 266.34
Slice2 (DD) 273.32 417.50
Slice3 (DD) 326.59 398.09
Slice4 (DD) 309.37 399.09
Slice5 (DD) 339.75 435.78
Slice6 (DD) 274.37 283.49
Slice7 (DD) 202.09 273.68
Slice8 (DD) 220.56 621.74
Slice9 (DD) 194.29 304.04
Slice10 (DD) 201.43 319.68
Slice11 (DD) 295.71 352.04
Slice1(MAD) 29.57 12.43
Slice2(MAD) 27.34 10.71
Slice3(MAD) 30.79 10.77
Slice4(MAD) 45.92 19.36
Slice5(MAD) 24.96 9.56
Slice6(MAD) 22.33 9.51
Slice7(MAD) 22.13 8.76
Slice8(MAD) 24.36 9.91
Slice9(MAD) 23.84 10.65
Slice10(MAD) 23.30 10.71
Slice11(MAD) 28.24 13.92
Variance(MAD) 2.35 4.32
Max. Dist.(MAD) 29.54 13.43
chaeologist to understand the content in a 3D surface
engraved in the sculpture. Especially in Indonesian
sculpture, the usage of specific parts, i. e. crown,
necklace, and other accessories can determine the
story or even the construction time of the reliefs. On
the Barcelo work (Barcel
´
o, 2014), to understand the
surface characteristic, several parameters need to be
seen in the surface model, i.e., roughness, shape, and
waviness.
Overall, based on Table 4, the Photogrammetry
gives enough adaptability, flexibility to be established
in an outdoor area. The problem in using Photogram-
metry is the homogeneous object with minimum vari-
ation in color and shape. Based on the obtained
model, the photogrammetry result has all the major
components, such as the body, hand, crown, and neck-
lace. Based on that, the style of the sculpture can
be determined. Furthermore, the main shape of the
accessories, the action of the sculpture, can be seen
clearly. The relief detail on the surface cannot be used
to determine the material due to the lack of roughness,
but the waviness can is depicted on the surface. Based
on that observation, it is best to use Photogrammetry
on outdoor artifact at noontime based on the adapt-
Acquisition Evaluation on Outdoor Scanning for Archaeological Artifact Digitalization
797

Table 4: Qualitative Evaluation. Higher Xmeans is better choice ( Adaptability, Flexibility, Efficiency, and Post-processing)
and easy to determine the main feature of the object( Main parts and Relief detail).
Scanning method Adaptability Flexibility Efficiency Post-Processing Main parts Relief detail
PH(720p) XXX XXX XXX XXX XXXX XXX
PH (1080p) XXX XXX XXX XXX XXXX XXX
PH (4k) XXX XXX XXX XXX XXXX XXXX
SL X X XX XX XXXXX XXXXX
LS XXX XXXX XXXX - XXXX XX
SIR XXXXX XXXXX XXXXX - XX XX
ability, flexibility, and efficiency results. Also, it can
be seen that a higher resolution on the input gives bet-
ter performance on detail reconstruction.
On the other hand, Structured Light Scanner lacks
adaptability, flexibility, and efficiency. Based on
Georgopoulos’s review, (Georgopoulos et al., 2010),
they show the difficulties to set up the laser scanner
because of the need of AC electricity, the flexibility
is limited by the power source and cable length. This
scanner is also sensitive to light. Because of that, po-
sitioning from the object, and the direction of scan
taking are very much considered. There are 40 scans
done in the sculpture, and after that, manual register-
ing is needed to complete the model. Contrary to the
scanning process, which is rather complicated, the re-
sult of SLS gives promising detail in the surface mod-
els. The surface has the roughness from the mate-
rial and the waviness of the depth. This method is fit
to be used in the adequate size of an artifact with a
power source nearby. This scanning process is also
proven to be used in an outdoor environment at noon-
time with excellent results. The third acquisition pro-
cess is a low-cost scanning. Different from SLS, the
ASUS XTION scanner requires power from the USB
port directly from the computer. The process of scan-
ning is almost real-time and gives output directly. Be-
cause of the portability, this scanner is easy to use
in the outdoor environment. Regarding the results, it
lacks the roughness, and waviness makes the detail on
the crown and necklace cannot be examined. In this
quality level, based on (Zatzarinni et al., 2009), (Tal,
2014), also with an observation on the model from
the examiner, this quality can be used as a base sur-
face besides of textured 2D images to understand the
surface detail. The last reconstruction method is SIR
applied from (Eigen et al., 2014). The input is sliced
into a 304x228 resolution patch and trained using reg-
istered image and depth from one perspective. Based
on the examiner, the adaptability and flexibility using
this method are better than any other methods. Sim-
ilar to the Low-Cost Scanner result, the depth infor-
mation obtained from SIR can help to determine the
shape and pose. The major drawback of using SIR is
created from one perspective. Hence, this approach is
the best to be used for 2.5D plane artifacts, such as
relief in-wall.
5 CONCLUSION
A comparison of scanning models using three dif-
ferent acquisition methods for quantitative evalua-
tion and four methods for qualitative evaluation is
presented. In this paper, the acquisition process,
efficiency, and the perspective from the user per-
spective are assesed. Firstly, quantitative measure-
ment is conducted. Two sub-architectures are es-
tablished to know the differences in point cloud ob-
tained and mesh model. However, most data prepara-
tion are needed to be completed using a manual ap-
proach. Moreover, after the data are collected, the
post-processing of structured light registration is done
by the human hand. After the data are ready, they
are compared to know the quality of the result be-
tween three different scanning processes. Using these
results of the comparison, archaeologists can under-
stand differences in performance and use this as the
basis for choosing the best method. On the other
acquisition, Photogrammetry gives an excellent per-
formance; however, much noise is produced through
the process. It is because the background is not re-
moved. It is also possible that the shape complexity
and the position where the data is taken can disrupt
the scanning process. Because of that, it makes the
preparation must be prepared carefully. Based on our
investigation, this problem can be solved by taking
close-range Photogrammetry. In the third approach,
the result of a low-cost scanner is presented. Over-
all, these results give the best efficiency, and it can be
used to reconstruct 2.5D models. This reconstruction
can be used on Indonesian sculpture, relief, and tem-
ple since all of them have similar shape properties.
What makes it different between them is the number
of scans or data used to create the models.
VISAPP 2020 - 15th International Conference on Computer Vision Theory and Applications
798

ACKNOWLEDGMENT
This work is funded by a collaboration scheme be-
tween the Ministry of Research and Technology of
the Republic of Indonesia and OeAD-GmbH within
the Indonesian-Austrian Scholarship Program (IASP)
and Computer Vision Lab, TU Wien. Thank you to
Embassy of Republic Indonesia in Vienna for permis-
sion to scan the sculpture.
REFERENCES
Ackermann, J. and Goesele, M. (2015). A survey of pho-
tometric stereo techniques. Found. Trends. Comput.
Graph. Vis., 9(3-4):149–254.
Barcel
´
o, J. (2014). 3d modelling and shape analysis in ar-
chaeology. 3D Recording and Modelling in Archae-
ology and Cultural Heritage - Theory and Best Prac-
tices, pages 15–23.
Besl, P. J. and McKay, N. D. (1992). A method for regis-
tration of 3-d shapes. IEEE Transactions on Pattern
Analysis and Machine Intelligence, 14(2):239–256.
Boehler, W. and Marbs, A. (2004). 3d scanning and pho-
togrammetry for heritage recording: A comparison.
Proc. 12th Int. Conf. on Geoinformatics, pages 291–
298.
CIFA (2014). Standard and guidance for the creation,
compilation, transfer and deposition of archaeological
archives.
Eigen, D., Puhrsch, C., and Fergus, R. (2014). Depth
map prediction from a single image using a multi-
scale deep network. In Ghahramani, Z., Welling, M.,
Cortes, C., Lawrence, N. D., and Weinberger, K. Q.,
editors, Advances in Neural Information Processing
Systems 27, pages 2366–2374. Curran Associates, Inc.
Georgopoulos, A., Ioannidis, C., and Valanis, A. (2010).
Assessing the performance of a structured light scan-
ner. International Archives of Photogrammetry,
Remote Sensing and Spatial Information Sciences,
XXXVIII:250–255.
Georgopoulos, A. and Stathopoulou, E. K. (2017). Data
Acquisition for 3D Geometric Recording: State of the
Art and Recent Innovations, pages 1–26. Springer In-
ternational Publishing, Cham.
Gonzalez, H., Riveiro, B., Vazquez-Fernandez, E.,
Mart
´
ınez-S
´
anchez, J., and Arias, P. (2013). Metro-
logical evaluation of microsoft kinect and asus xtion
sensors. Measurement, 46:1800–1806.
Gupta, M., Yin, Q., and Nayar, S. K. (2013). Structured
light in sunlight. 2013 IEEE International Conference
on Computer Vision, pages 545–552.
Kazhdan, M., Bolitho, M., and Hoppe, H. (2006). Poisson
surface reconstruction. In Proceedings of the Fourth
Eurographics Symposium on Geometry Processing,
SGP ’06, pages 61–70, Aire-la-Ville, Switzerland,
Switzerland. Eurographics Association.
Lee, J., Hong, S., Cho, H., Park, I., Cho, H., and Sohn,
H.-G. (2015). Accuracy comparison between image-
based 3d reconstruction technique and terrestrial lidar
for as-built bim of outdoor structures. Journal of the
Korean Society of Surveying, Geodesy, Photogramme-
try and Cartography, 33:557–567.
Levoy, M., Pulli, K., Curless, B., Rusinkiewicz, S., Koller,
D., Pereira, L., Ginzton, M., Anderson, S., Davis, J.,
Ginsberg, J., Shade, J., and Fulk, D. (2000). The Dig-
ital Michelangelo Project: 3D scanning of large stat-
ues. In Proceedings of ACM SIGGRAPH 2000, pages
131–144.
Pan, J., Li, L., Yamaguchi, H., Hasegawa, K., Thufail, F. I.,
Mantara, B., and Tanaka, S. (2018). 3D Reconstruc-
tion and Transparent Visualization of Indonesian Cul-
tural Heritage from a Single Image. In Sablatnig, R.
and Wimmer, M., editors, Eurographics Workshop on
Graphics and Cultural Heritage, pages 187–198. The
Eurographics Association.
Remondino, F. and Rizzi, A. (2010). Reality-based 3d
documentation of natural and cultural heritage sites—
techniques, problems, and examples. Applied Geo-
matics, 2(3):85–100.
Tal, A. (2014). 3d shape analysis for archaeology. 3D
Recording and Modelling in Archaeology and Cul-
tural Heritage - Theory and Best Practices, 8355:50–
63.
Yang, M. Y. and F
¨
orstner, W. (2010). Plane detection in
point cloud data. Proceedings of the 2nd Int. Conf. on
Machine Control guidance, 1:1–16.
Zatzarinni, R., Tal, A., and Shamir, A. (2009). Relief analy-
sis and extraction. In ACM SIGGRAPH Asia 2009 Pa-
pers, SIGGRAPH Asia ’09, pages 136:1–136:9, New
York, NY, USA. ACM.
Acquisition Evaluation on Outdoor Scanning for Archaeological Artifact Digitalization
799
