
Analysis of ECG and PCG Time Delay around Auscultation Sites
Xinqi Bao
1 a
, Yansha Deng
1 b
, Nicholas Gall
2 c
and Ernest Nlandu Kamavuako
1 d
1
Department of Engineering, King’s College London, London, U.K.
2
Department of Cardiology, King’s College Hospital, London, U.K.
Xinqi.bao@kcl.ac.uk, Yansha.deng@kcl.ac.uk, Nickgall@doctors.org.uk, Ernest.kamavuako@kcl.ac.uk
Keywords:
Phonocardiogram (PCG), Electrocardiogram (ECG), Auscultation Site, Time Delay.
Abstract:
Phonocardiogram (PCG) and Electrocardiogram (ECG) are the two important signals for cardiac preliminary
diagnosis. Using ECG as a reference for segmenting the PCG signal is a simple but reliable technique for
the devices with integration capability of PCG and ECG recording. The aim of this work is to analyse the
time delay between ECG and PCG at each auscultation site. To do so, we performed the experiments on 12
healthy subjects, where the ECG and PCG signals were collected simultaneously at two sites at each time. Our
results reveal that 1) the inter-distance of the electrodes for ECG does not affect the occurrence time of the
R-peak. 2) The delay between R-peak and onset of first heart sound (S1) depends on the auscultation site e.g.
S1 onset occurs before the R-peak at auscultation site M. This study suggests that small integrated ECG-PCG
devices can be made by reducing the distance between the ECG electrodes. In the meantime, distinguishing
the auscultation location is necessary for performing more precise PCG segmentation using ECG as reference.
1 INTRODUCTION
Heart sound auscultation and Electrocardiogram
(ECG) are the two most common and effective ways
in the primary diagnosis of heart diseases. Their sig-
nal waveforms, phonocardiogram (PCG) and ECG
can reflect the mechanical and electrical activities of
the heart, respectively. The PCG signal can reveal
the physiological or pathological conditions of car-
diac valves and chambers to diagnose the structural
heart disease (SHD), such as prolapsed mitral valve,
ventricular septal defect (VSD), tricuspid regurgita-
tion, etc. The ECG can help to detect diseases asso-
ciated with impulse conduction, such as arrhythmias,
coronary heart disease, heart attacks, etc. (Auer et al.,
2012).
The normal cardiac cycle relies on the coopera-
tion of electrical activity and mechanical contraction
of the atria and ventricles of the heart. The whole
process is initially stimulated by the spontaneous ac-
tion potential in the sinoatrial (SA) node (represented
as P wave on ECG), then propagated to the atrioven-
tricular (AV) node causing the atria contraction and
the blood is pumped into ventricles and the ventric-
a
https://orcid.org/0000-0002-7117-1267
b
https://orcid.org/0000-0003-1001-7036
c
https://orcid.org/0000-0003-1289-1421
d
https://orcid.org/0000-0001-6846-2090
ular depolarization (represented as QRS complex on
ECG) begins. Once the ventricular pressure becomes
greater than the atrial pressure, the atrioventricular
valves close (represented as S1 onset on PCG) and
the ventricular depolarization is finished. The contin-
uation of the electrical signal goes through the bun-
dle of His to the Purkinje fibres causing the ventricle
contraction and the blood is pumped out of the heart.
After the blood pumping out, the ventricles are repo-
larized (represented as T wave on PCG) and relaxed.
The closure of the semilunar valves cause the S2 on
the PCG. Therefore, the PCG and ECG are closely
related in the time domain (Wartak, 1972).
In order to fully utilise the diagnosis power of
the PCG, it is of utmost importance to segment S1
from S2. All the proposed segmentation methods can
be basically grouped into: 1) ECG reference based
methods use the R-peak and T wave to determine
the locations of the heart sounds. It highly requires
the simultaneous recording of the ECG and PCG sig-
nals (Lehner and Rangayyan, 1987; El-Segaier et al.,
2005), but robust in performance and computationally
efficient; 2) Envelope-based methods are more com-
monly used techniques in non-ECG based segmenta-
tion. They use the signal energy to do morpholog-
ical transformation (Liang et al., 1997; Wang et al.,
2009; Kang et al., 2015), but their performance de-
crease in the presence of large environmental noise
and murmurs; 3) Temporal-spectral parameters based
206
Bao, X., Deng, Y., Gall, N. and Kamavuako, E.
Analysis of ECG and PCG Time Delay around Auscultation Sites.
DOI: 10.5220/0008942602060213
In Proceedings of the 13th International Joint Conference on Biomedical Engineering Systems and Technologies (BIOSTEC 2020) - Volume 4: BIOSIGNALS, pages 206-213
ISBN: 978-989-758-398-8; ISSN: 2184-4305
Copyright
c
2022 by SCITEPRESS – Science and Technology Publications, Lda. All rights reserved

methods use the time-frequency domain characteris-
tics of the heart sounds, murmurs, and noise to seg-
ment the heart sound (Iwata et al., 1980; Liang et al.,
1998); 4) Wavelet based PCG segmentation meth-
ods are the evolution of temporal-spectral parameters
based methods (Oskiper and Watrous, 2002;
¨
Olmez
and Dokur, 2003; Kumar et al., 2006; Zhong et al.,
2011). They will decompose the signals to empha-
size the heart sounds and suppress the effects of mur-
murs and noises. The major challenge of wavelet-
based segmentation method is to select the appro-
priate filters, decomposition level and required sub-
bands for heart sound and murmurs detection; 5) Hid-
den Markov models are also used for segmentation
in recent years (Ricke et al., 2005; Lima and Car-
doso, 2007; Schmidt et al., 2010), and they have out-
standing performance in low signal-to-noise ratio. At
present, there is no widely recognized the best PCG
segmentation method, but with the presence of simul-
taneous ECG recording, ECG-based segmentation is
more desirable for practical applications due to its ro-
bustness and simplicity.
In the previous ECG-base PCG segmentation
studies, S1 onset is conventionally considered to oc-
cur after R peak (Shino et al., 1996; Syed et al., 2004;
Ahlstr
¨
om, 2006; Andresen et al., 2006). Ahlstrom
(2006) detailedly summarized the time property of
heart sounds that S1 starts 10–50 ms after R peak and
lasts for 100–160 ms; S2 starts 280–360 ms after R-
peak in ECG and lasts for 80–140 ms. For the prac-
tical applications, the development of microprocessor
in the last two decades has made it possible to make
portable devices that can be of great value in primary
care. Devices, such as the SensiumVitals
R
system,
Zio patch monitor and CAM patch monitor appear
which can collect the ECG using a lightweight patch
on the chest region. This provides the possibility to
integrate ECG and PCG together around the chest
auscultation area, instead of measuring at different
place of the body. Integrating PCG and ECG together
for concurrent measurement will be of great help to
increase the portability and reduce the size in design-
ing the small and portable device or systems. Further-
more, combining ECG with PCG can provide more
comprehensive heart diagnosis(Phanphaisarn et al.,
2011; Homaeinezhad et al., 2012; Zarrabi et al.,
2017). In such case, the need for sophisticated seg-
mentation can be mitigated by using the ECG as ref-
erence signal and segmenting the PCG accordingly.
To the best of our knowledge, research on au-
tomatic analysis of PCG is mainly based on single
channel signals and the time correlation described is
not exhaustive on which lead of ECG and auscul-
tation site were used. However, multiple channels
auscultation will provide more comprehensive infor-
mation on the heart conditions. On this basis, there
are studies on multi-site PCG recording to visualize
the heart related acoustic sounds by cardiac acous-
tic mapping (Okada, 1982; Cozic et al., 1998; Ba-
hadirlar and G
¨
ulc¸
¨
ur, 2000; Nogata et al., 2012; Sap-
sanis et al., 2018). These studies not only provide a
new way to analyse the heart sound, but also illus-
trate that the heart sound generation and propagation
delay in the auscultation area. In addition, the ECG
signals have morphological changes due to the elec-
trode placement around the chest. According to Ka-
nia (2014), the QRS complex shifts due to the elec-
trodes placement (Kania et al., 2014). Therefore, it is
not known whether the correlation between ECG and
PCG remains the same when multiple channel signals
are collected from different auscultations sites. In the
case of small-scale ECG-PCG device, the recordings
of the ECG should occur around the auscultation site.
It is therefore of utmost importance to revisit the time
properties of ECG and PCG.
The primary aim of this study is to analyse the
time delay between ECG and PCG at different aus-
cultation sites (A, P, T, M). The secondary aim is to
investigate the changes in the time occurrence of the
R-peak in relation to the distance between the record-
ing electrodes. All the findings will contribute to de-
sign small-scale ECG-PCG integrated device and pro-
vide more precise time property for ECG-based PCG
segmentation.
2 METHODOLOGY
2.1 Experiment
2.1.1 Subjects
The experiments were conducted on 12 human sub-
jects with no history of heart diseases (8 male/ 4 fe-
male, age range 21–28 years, mean 25.6 years). The
procedures were approved by the King’s College Re-
search Ethics Committee (Approval No.: LRS-18/19-
10673). Subjects gave written informed consent prior
to the experimental procedures.
2.1.2 Data Collection
The proposed experiment requires the simultaneous
acquisition of ECG and PCG signals at each ausculta-
tion site. A simple block diagram of this hardware
system is shown in Figure 1. The recording uses
the commercial acquisition system (iWorx, model RA
Analysis of ECG and PCG Time Delay around Auscultation Sites
207
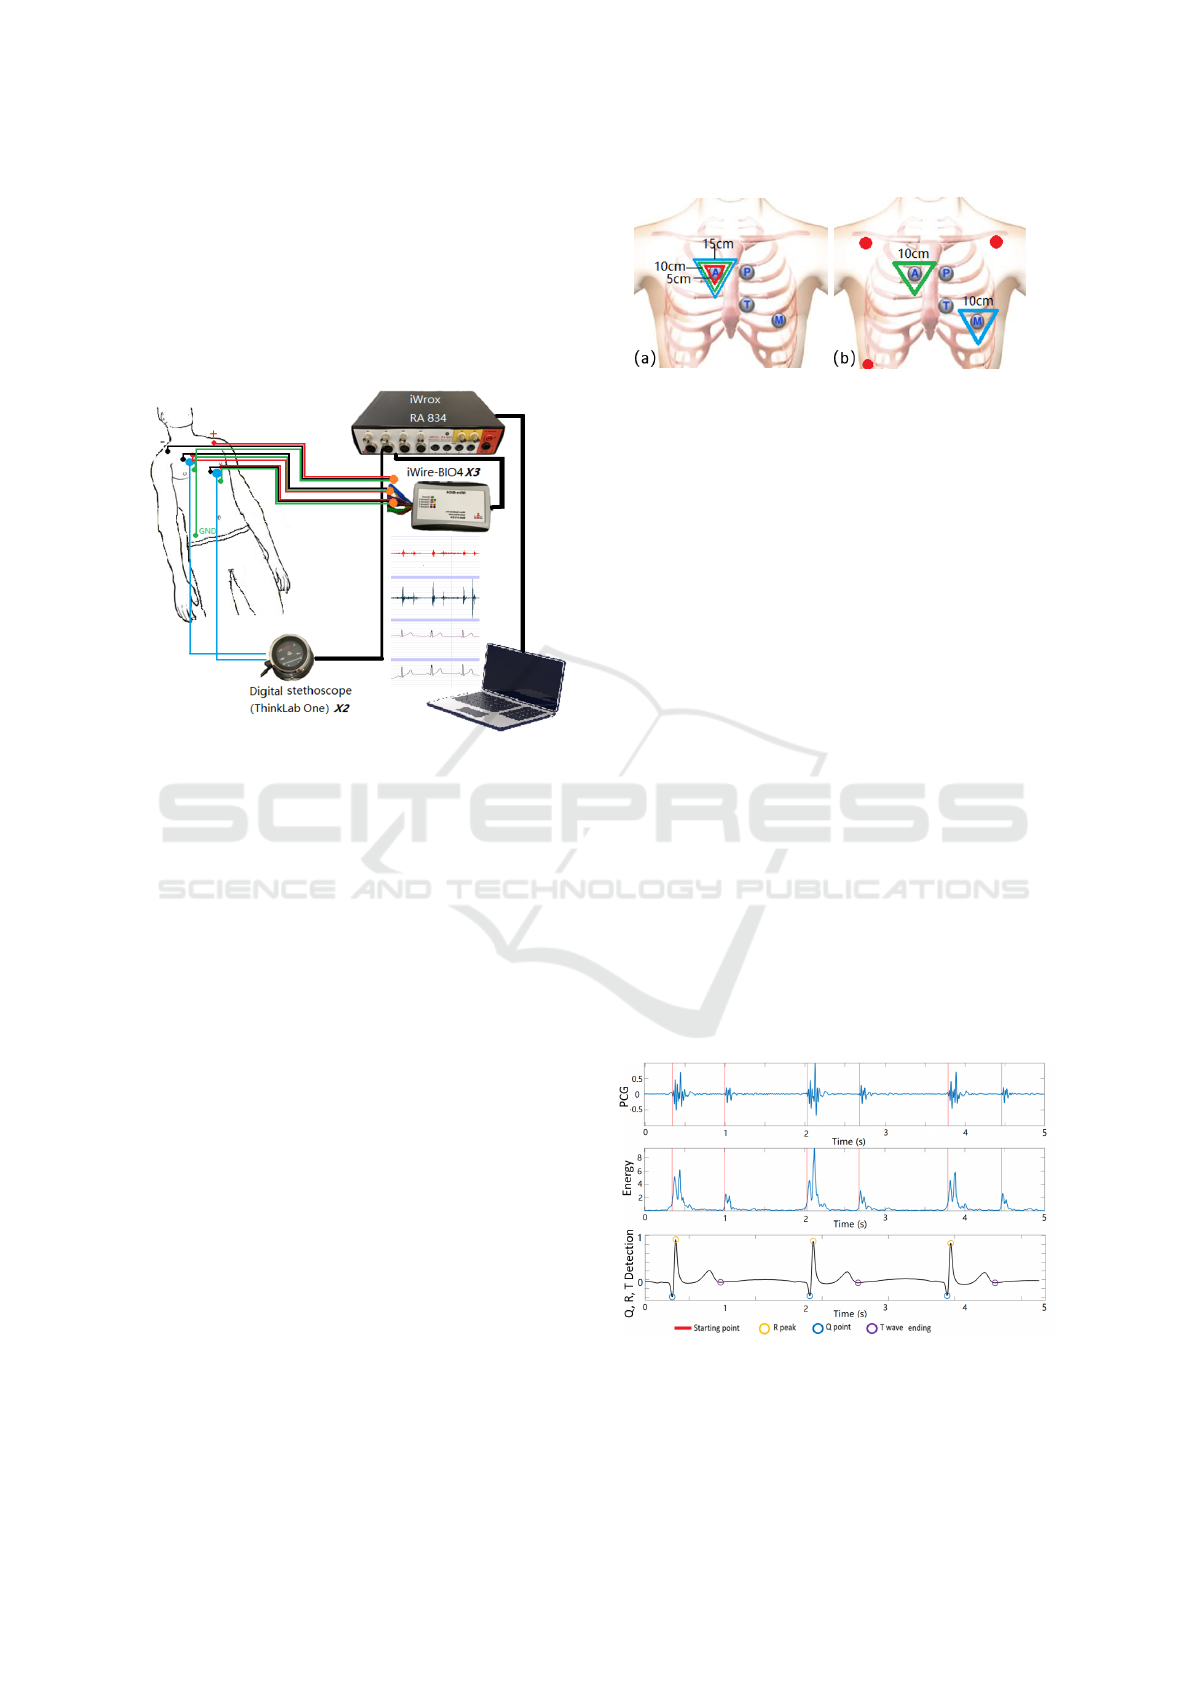
834) as recorder. ECG devices (iWire-BIO4) and dig-
ital stethoscopes (ThinkLab One) are connected with
the recorder by iWire inputs and DIN8 inputs. The
solid gel electrodes (Ambu 0215M) are used as ECG
sensors. The sampling frequency was 20 kHz to allow
fine resolution around the 0.05 ms. The filter for ECG
was 0.05 – 40 Hz (Ricciardi et al., 2016), and PCGs
were recorded with wideband mode (20 – 2000 Hz).
Figure 1: Block Diagram of the recording setup.
2.1.3 Experimental Procedures
Prior to commencing the experiments, we quantified
the instrumentation delay. To achieve this, all three
iWire devices where connected on the same elec-
trodes in a limb lead configuration while both micro-
phones where placed close to the auscultation site A.
The sampling frequency was set to 100 KHz for this
particular measurement. Instrumentation delay was
very negligible about 10 microseconds.
The experiments are divided into two stages, and
the subjects should keep supine. Stage I is to analyse
whether the inter-electrode distance (IED) will affect
the ECG delays. Three groups of disposable adhesive
ECG sensors are placed at A site with 5 cm, 10 cm
and 15 cm IED as shown in Figure 2 (a). The data is
collected for 3 mins.
In Stage II, the effect of placement on ECG and
PCG delays will be analysed. Three electrodes (red
points) are positioned over the chest of a subject with
standard Lead I as reference. The other two iWire de-
vices will do the simultaneous recording with 10 cm
IED at each auscultation site. Two ThinkLab stetho-
scopes are put at the centre of the electrodes (ausculta-
tion points). Each site is identified using the anatomi-
cal landmark and listening. The placement of sensors
in Stage II can be seen in Figure 2 (b). Four groups of
data are collected corresponding to each auscultation
site with 3 mins duration.
Figure 2: (a) Placement of electrodes for different inter-
electrode distanc (IED).(b) Placement of sensors for differ-
ent auscultation locations.
2.2 Data Analysis
In this study, the delays were analysed using the tem-
poral locations of the R-peaks, the Q points and the
T wave ending points in ECG, and the S1, S2 starting
points in PCG. The processing was conducted in the
Matlab
R
R2018b environment.
2.2.1 Signal Filtering
The captured ECG and PCG signals were filtered first
to remove the unwanted noise. For the ECG, a 3rd-
order infinite impulse response (IIR) high-pass filter
with 1 Hz is used to eliminate the baseline wander
(Laguna et al., 1992). For the PCG, a 150 Hz low-
pass IIR Chebyshev type I filter of order 3 is used to
filter the lung sound. All filters were zero-phased.
2.2.2 Parameter Extraction
As mentioned in 2.2, the R-peaks, Q points and the T
wave ending points are extracted from ECG signals,
and S1, S2 starting points are extracted from PCG sig-
nals. Figure 3 shows the extraction results of the pa-
rameters.
Figure 3: The S1,S2 starting points in PCG, and Q, R, T
points in ECG extraction result.
To capture more accurate R-peak, the Pan-
Tompkins algorithm (Pan and Tompkins, 1985) is
BIOSIGNALS 2020 - 13th International Conference on Bio-inspired Systems and Signal Processing
208
used. The ECG signal is derivative filtered and
squared to enhance the dominant peaks (QRSs) and
reduce the possibility of erroneously recognizing a T-
wave as an R-peak. After the square, the R peaks of
the ECG can be easily detected by setting an appro-
priate threshold. By using the intermediate coordi-
nates between the R peaks, the ECG and correspond-
ing PCG can be cut into one cardiac cycle. The data
will be analyzed using 5 consecutive cycles. The Q
points are detected by calculating the slope on the left
side of R. When the slope (first derivative) is becom-
ing greater than or equal to 0, the first lowest point
is reached, which is the Q point. The detection of
T wave ending point is based on the relationship be-
tween R peak and T wave, where T wave normally oc-
curs 250 ms – 350 ms after R peak (O’Keefe Jr et al.,
2010). Therefore, the peak point in this period is the T
peak, and then we use the same method of Q detection
to find T ending point by the first derivative.
For S1, S2 starting point detection, the short-term
energy (STE) method (Malarvili et al., 2003) is used.
Its equation is
E
n
=
N−1
∑
m=0
x
2
n
(m), (1)
where E
n
is the short-term energy of the signal X
n
at frame n, and N is the length of the frame. In
our study, the frame length is 10 ms, and frame in-
crease is 0.5 ms. There are two thresholds to deter-
mine whether the sound is a heart sound or noise: en-
ergy threshold and duration threshold. If the STE is
larger than the lower energy threshold (10% of the
maximum energy), it is regarded as the potential start
point. When it becomes larger than the higher energy
threshold (25% of the maximum energy) and its du-
ration is longer than the threshold, this sound will be
regarded as heart sound.
After the parameter extraction, the captured data
are shown in Table 1. It worth mentioning that during
the parameter extraction, manual check is also used to
reduce the error and enhance its accuracy.
2.2.3 ECG Delay Estimation Method
In this study, the Cross-correlation (CC) method is
used for ECG delay estimation. CC is a function to
measure the similarity of two signals by calculating
the sliding inner-product, which is given as:
(s
1
∗ s
2
)[τ] ,
∞
∑
m=−∞
s
1
[t] s
2
[t + τ], (2)
where s
1
and s
2
are the two signals to be compared,
s
1
[t] is the complex conjugate of s
1
[t], and τ is the
displacement for inner-product. When (s
1
∗ s
2
) is the
Table 1: Extracted data from ECG and PCG. The subscripts
(Ref, A, P, T, M) mean the data is collected by the placement
of the electrodes in standard Lead I or around auscultation
sites.
ECG R peak Q point
ECGref Rref Qref
ECG
A
R
A
Q
A
ECG
P
R
P
Q
P
ECG
T
R
T
Q
T
ECG
M
R
M
Q
M
T ending point S1 starting point S2 starting point
Tref – –
T
A
S1
A
S2
A
T
P
S1
P
S2
P
T
T
S1
T
S2
T
T
M
S1
M
S2
M
largest, it means the similarity is the greatest. For the
ECG signals, they are regular and periodic, so the dis-
placement to get the maximum CC is equivalent to the
delay between the two signals. Using this relation, the
time delay between the two ECG signals can be deter-
mined by:
τ
delay
= argmax
t∈R
((s
1
∗ s
2
)(t)), (3)
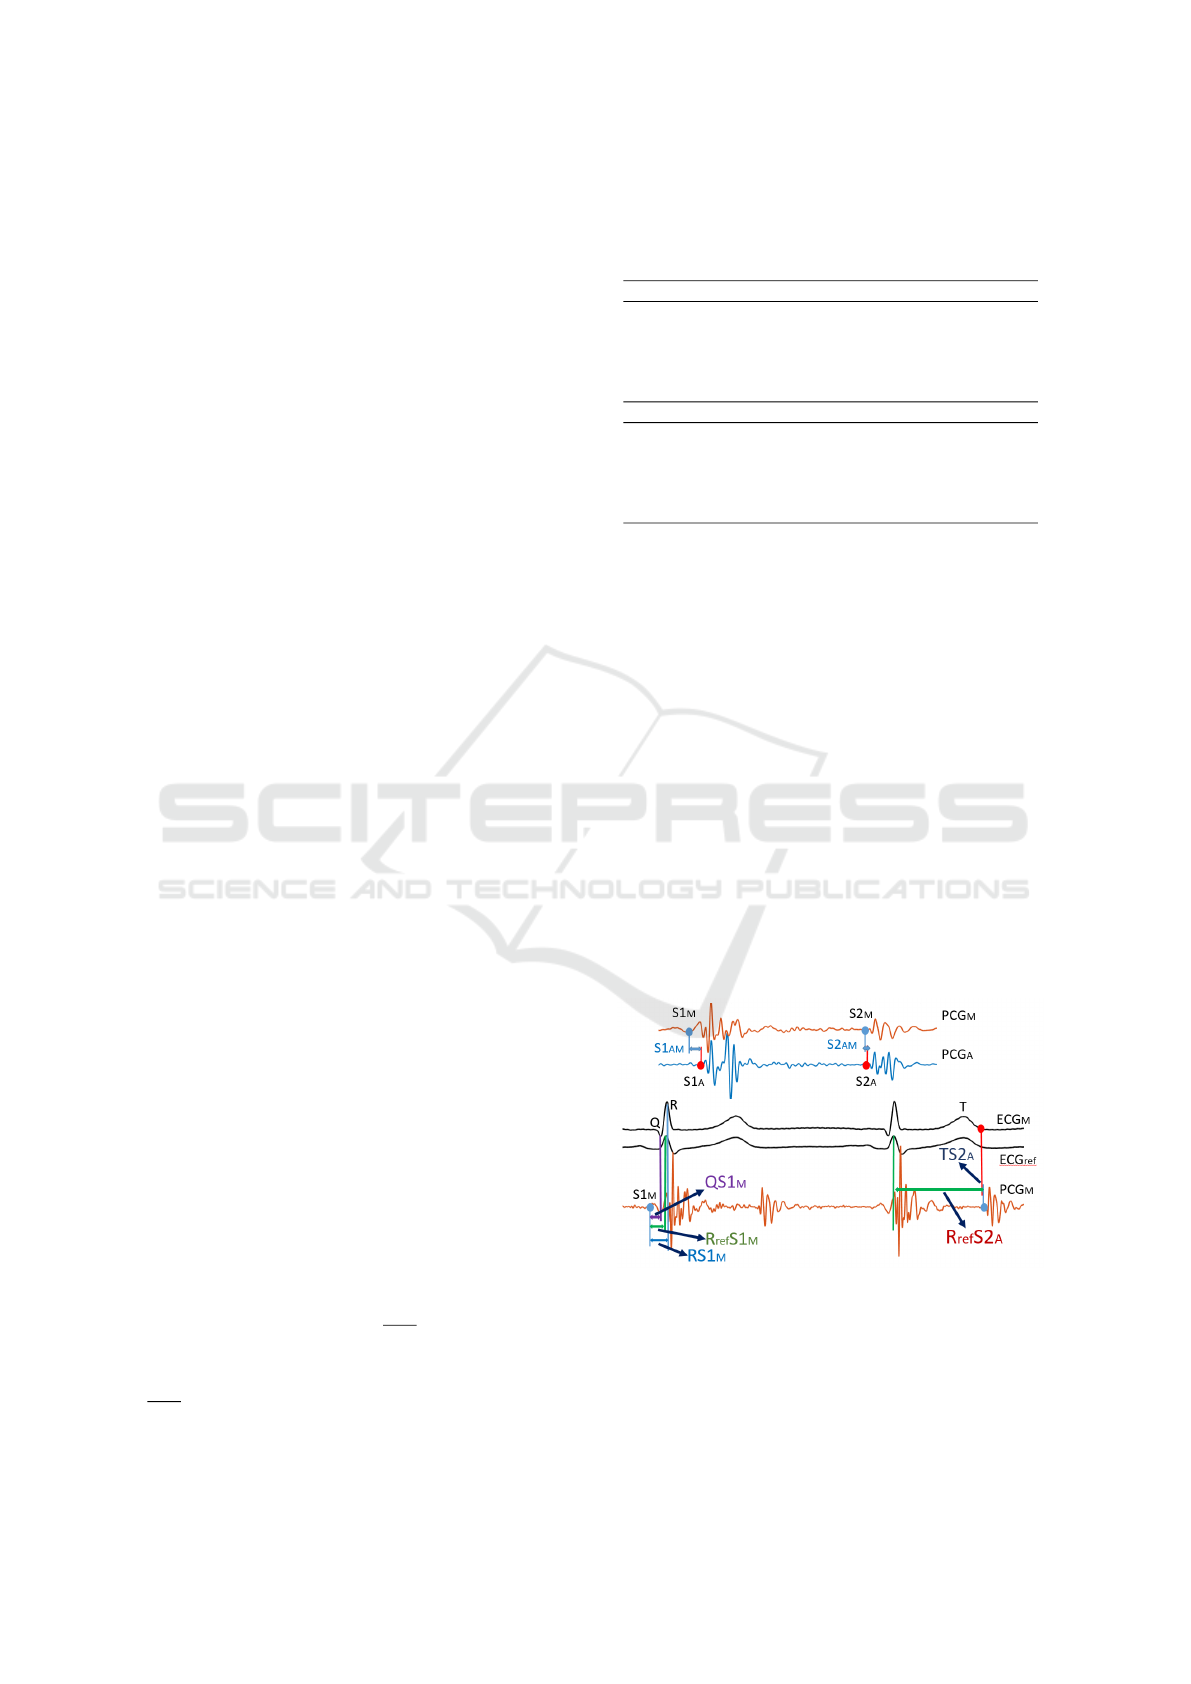
2.2.4 PCG Delay Calculation Method
The PCG signals are relatively complicated and not
regular as ECG. Thus using the CC method will cause
a significant estimation error. Therefore, the delays
are calculated directly by the difference of the key
points. The error is reduced by calculating the mean
of the five heart cycles. According to the extracted
data in Table 1, the calculated delays are shown in
Figure 4.
Figure 4: The calculated delays associated with PCG.
S1
AM(AP, AT )
are the delays between S1 onset in
site A and the other auscultation sites. S2
AM(AP, AT )
are the delays between S2 onset in site A and the
other auscultation sites. RS1
M(A, P, T )
are the delays
between S1 onset and R peak in each auscultation site.
R
re f
S1
M(A, P, T )
are the delays between S1 onset and
Analysis of ECG and PCG Time Delay around Auscultation Sites
209
R peak in reference ECG. QS1
M(A, P, T )
are the delays
between S1 onset and Q point in each auscultation
site. R
re f
S2
A(P, T, M)
are the delays between S2 onset
and R peak in reference ECG. T S2
A(P ,T , M)
are the
delays between S2 onset and T wave ending in each
auscultation site.
3 RESULTS
3.1 The Effect of IED on ECG Delays
Figure. 5 shows the IED of 5 cm and 15 cm compared
with 10 cm. The delays of the occurrence of R peak
are all close to 0 ms (mean ± standard deviation; 5cm:
-0.359 ± 2.181 ms, 15cm: 0.805 ± 1.861 ms), except
one outlier. Therefore, we can basically conclude that
the IED does not affect the R peak occurrence signifi-
cantly, and there is no obvious regularity in the effect.
Figure 5: IED caused ECG delay (10 cm as reference).
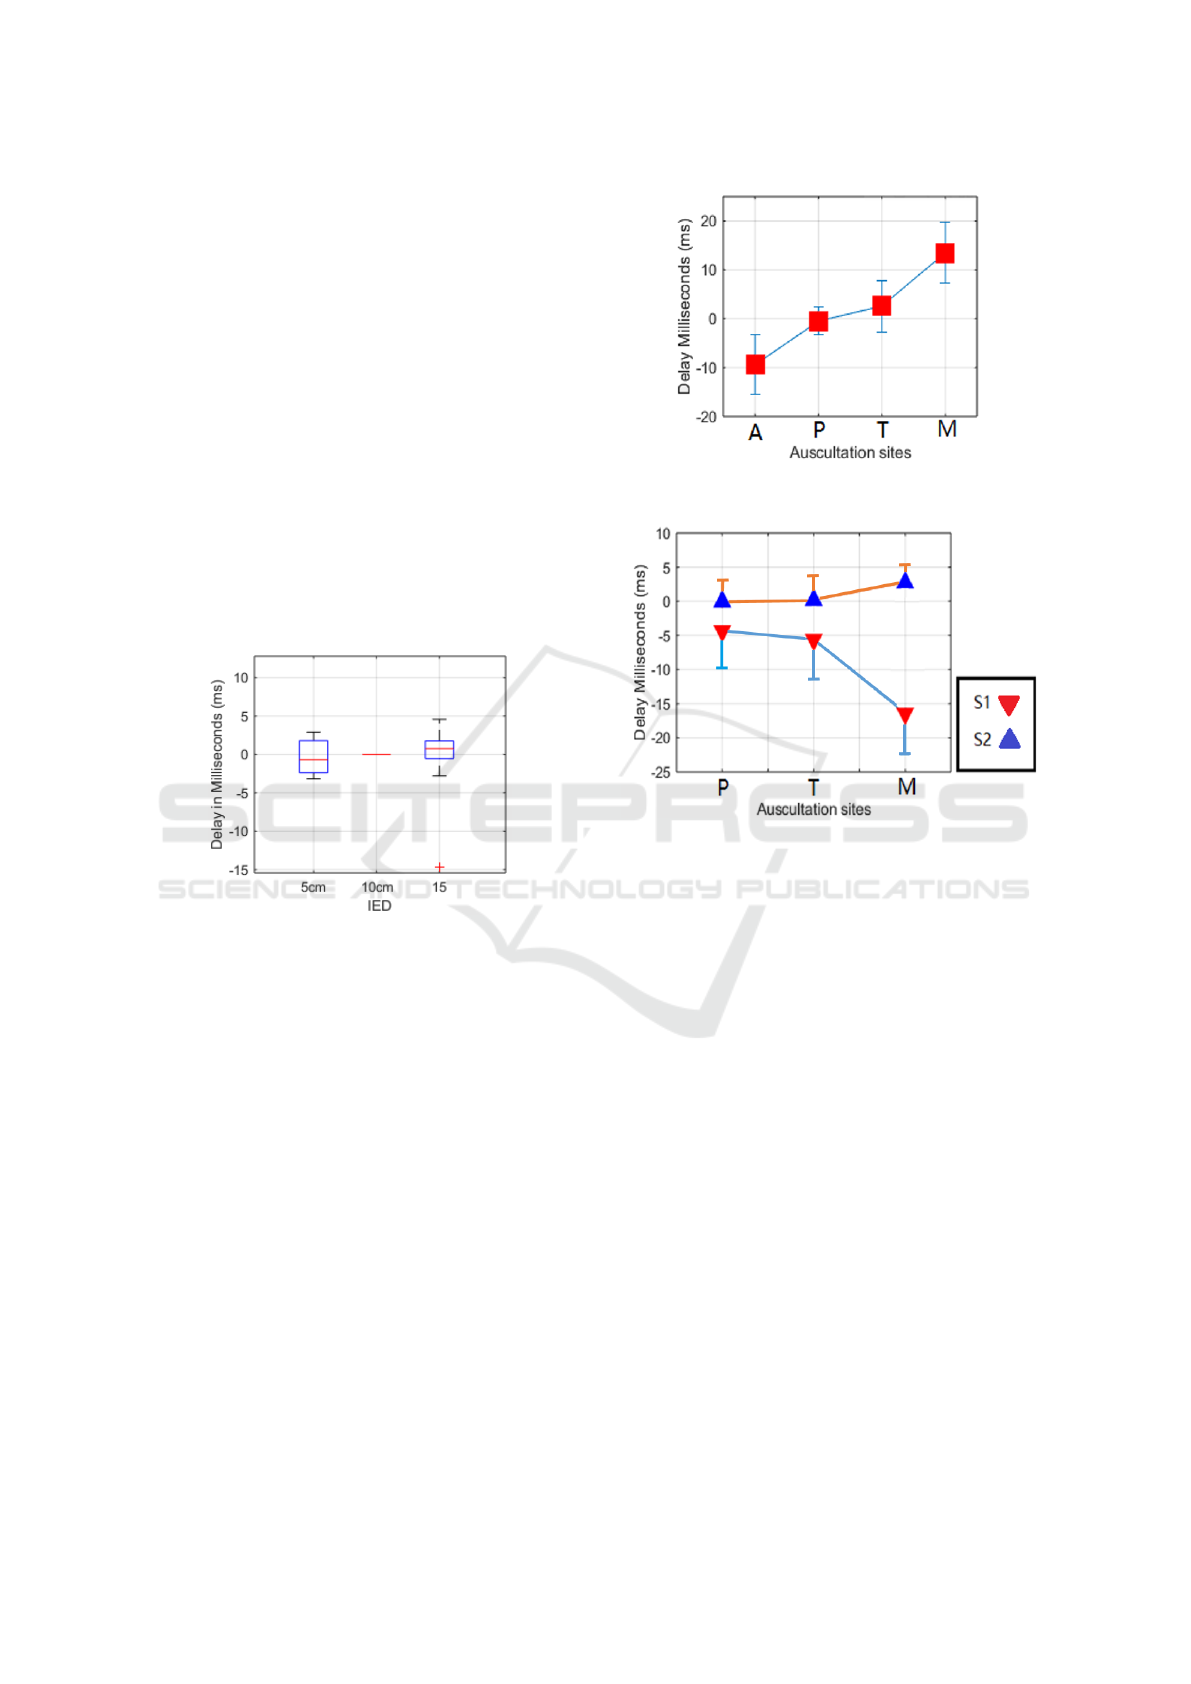
3.2 Delay between Standard Lead 1
ECG and Site Specific ECG
As shown in Figure 6, the delay between auscultation
sites shows an increasing trend from site A to site M.
Compared with the standard lead I ECG, the ECG at
A site is normally negative, which means the R peaks
at site A is advanced, R peaks at P and T are close
to standard lead I ECG; and R peak at M comes later
than standard lead I ECG.
3.3 PCG Delay between Site A and the
Rest
For the PCG delay between the auscultation sites (site
A is as the reference), S1 and S2 are analysed sepa-
rately. The results are shown in Figure 7. S1 onset
becomes earlier (negative) from A to M. However, S2
onset almost remains the same from A to T, but there
is a slight delay (positive) at M.
Figure 6: The delay (mean ± standard deviation, SD) be-
tween auscultation sites ECG and standard Lead I.
Figure 7: The delay of S1 (red) and S2 (blue) in each aus-
cultation site (A site as reference).
3.4 Delay between ECG and PCG
Figure 8 shows the delay between S1 onset in each
auscultation site and R peak in standard Lead I ECG.
The delay trend is similar to the S1 onset delay trend,
but it can be seen that at site A, the onset of S1 oc-
curs after R-peak. When it comes to site M, the S1
onset is basically before R-peak. Figure 9 illustrates
the delay of S1 onset, R-peak and Q point in the aus-
cultation site ECG. The delay trend is similar to the
delay of Standard Lead I, but it becomes larger. At
site A and M, there are average 20 ms time difference
between S1 onset and R-peak. However, compared
with Q point, the average delay in site M is close to 0.
S2 is widely regarded as occurring right after T-
wave. In this study, it is found that the S2 onsets are
basically after T wave ending points in auscultation
area, except 4 groups of outlier as shown in Figure
10. Besides, the relationship between Lead I ECG R-
peak and S2 onset is also presented in Figure 11.
BIOSIGNALS 2020 - 13th International Conference on Bio-inspired Systems and Signal Processing
210
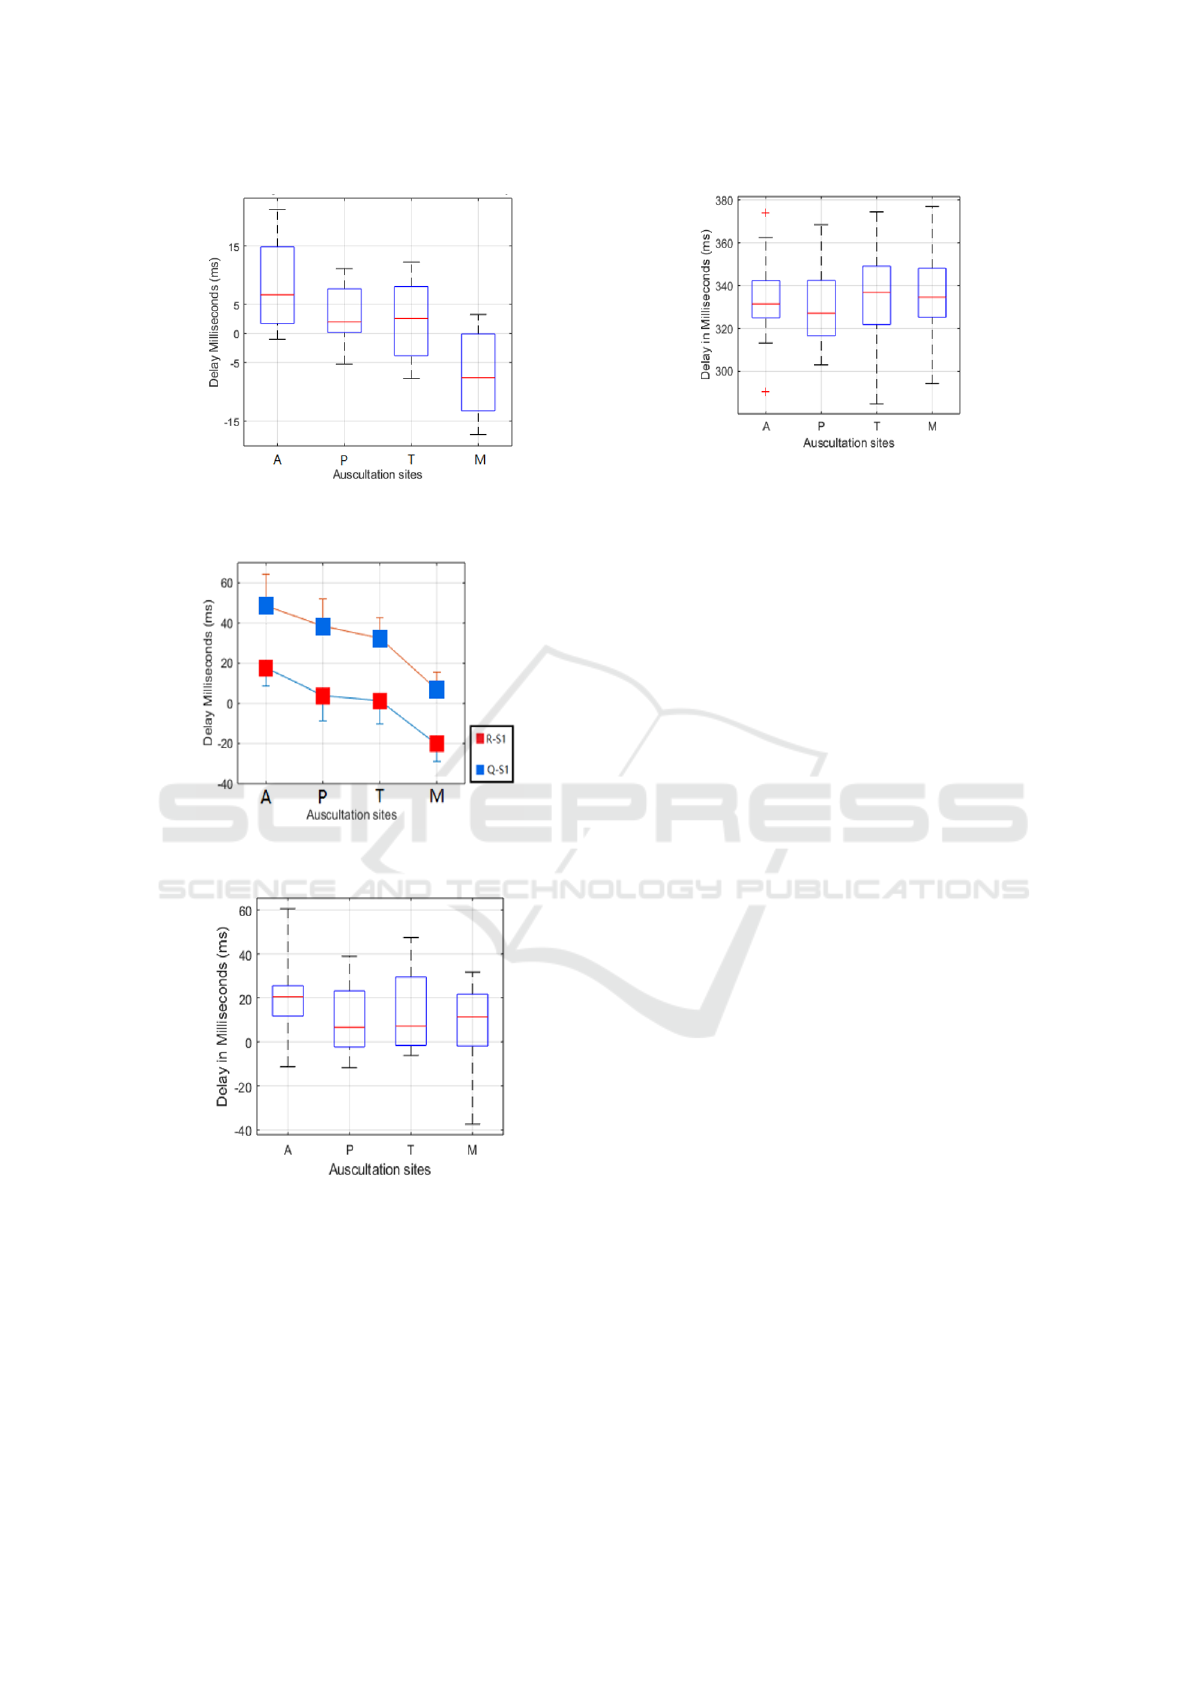
Figure 8: The delay between S1 onset for each auscultation
site and R peak in standard Lead I.
Figure 9: The delay between S1 onset and R peak/ Q point
in each auscultation site.
Figure 10: The delay between S2 onset and T wave ending
point in each auscultation site.
4 DISCUSSION
This study aimed to analyse the time delay between
ECG and PCG at different auscultation sites (A, P,
T, M), and investigated the changes in the time oc-
currence of the R-peak in relation to the distance be-
tween the recording electrodes. The results shown
Figure 11: The delay between S2 onset and R peak in Stan-
dard Lead I.
firstly that the time property for PCG segmentation
based on ECG in the previous study can be mislead-
ing and holds only for specific auscultation sites. In
our recorded PCG signals, the S1 onset was gradually
advanced from auscultation site A to site M, while
the S2 was delayed in the meantime. This result is
basically in line with our previous knowledge that S1
is generated at heart apex (site M and T) and S2 is
generated at heart base (site A and P) (Karnath and
Thornton, 2002), so S1 should be captured at site M
earlier and S2 should be captured at site A earlier. As
the result of heart sound propagation variation on the
chest, the S1 onsets in the captured PCG can occur
before or after R peak in the ECG. Normally, the S1
onset is after R peak at site A, before R peak at site
M, and adjacent to R peak at site P and T. Therefore,
distinguishing the auscultation location is necessary
for doing more precise segmentation.
Secondly, there is regularity in the translation of
the R-peak relative to the auscultation sites. Consider-
ing the body as a volume conductor, we can conclude
the R-peak of the ECG signals is conducted from site
A to site M. Because site T and M coincide with the
chest lead in clinic, we also analyzed the open-source
12 leads ECG, and found analogous delay trend be-
tween V2 to V6. This finding is similar to the elec-
trical axis caused QRS complex deviation, and the di-
rection is reverse for PCG and thus care should be
taken when using the ECG as a reference signal to
segment the PCG. When the signal is captured at site
M where S1 onset is far before R peak, Q point can be
an alternative reference point for the segmentation.
Thirdly, the IED has not effect on the R peak shift-
ing. Thus, shortening the IED can be of help to reduce
the size when designing ECG-PCG integrated small
device.
Besides, it is found that the RSR’ (An ECG find-
ing in which there are two R waves) happened in 5
subjects’ site A ECG during the experiment. Nor-
mally the RSR’ occurs in the conditions of right bun-
Analysis of ECG and PCG Time Delay around Auscultation Sites
211

dle branch block (RBBB) or left bundle branch block
(LBBB) (Daniela, 1996), but there is no such physio-
logical or heart conditions on the subjects. Therefore,
it worth noticing to choose appropriate R peak when
using ECG to do PCG segmentation under this con-
dition. In our analysis, the first peak was used in the
delay calculation and it conforms to the rest trend.
Lastly, there are also some limitations in this
study. The IED effects on ECG were tested by only
5 cm, 10 cm and 15cm which was limited by the di-
ameter of the electrodes (4 cm). If there are more
interpolations between them, the result will be more
convincing and accurate. In the analysis of IED ef-
fect on ECG, there is one outlier with around 15 ms
R peak shifting cannot be explained. It is conjectured
that the error was caused by the misplacement of the
electrodes.
5 CONCLUSIONS
The study found that when the ECG is captured at aus-
cultation sites, the R peak of ECG shifted backward
regularly from A to M, and the distance between the
electrodes did not affect the R peak shifting. In addi-
tion, the propagation of the heart sound on the chest
caused a delay on S1 onset in the captured PCG sig-
nals. Therefore, the R peak shifting and PCG delay
lead that using R peak to directly locate S1 in PCG no
longer accurate. This can be improved by distinguish-
ing the time property of each auscultation site. All the
findings will be of help in designing small ECG-PCG
integrated device, and providing theoretical basis for
using ECG to do more accurate PCG segmentation.
REFERENCES
Ahlstr
¨
om, C. (2006). Processing of the Phonocardio-
graphic Signal: methods for the intelligent stetho-
scope. PhD thesis, Institutionen f
¨
or medicinsk teknik.
Andresen, A., Galen, P., Warner, R., and Selvester, R.
(2006). Combined ecg and sound chart report and
methodology. US Patent App. 11/140,010.
Auer, R., Bauer, D. C., Marques-Vidal, P., Butler, J., Min,
L. J., Cornuz, J., Satterfield, S., Newman, A. B., Vit-
tinghoff, E., Rodondi, N., et al. (2012). Association
of major and minor ecg abnormalities with coronary
heart disease events. Jama, 307(14):1497–1505.
Bahadirlar, Y. and G
¨
ulc¸
¨
ur, H.
¨
O. (2000). Cardiac pas-
sive acoustic localization: Cardiopal. Turkish Jour-
nal of Electrical Engineering & Computer Sciences,
6(3):243–260.
Cozic, M., Durand, L.-G., and Guardo, R. (1998). De-
velopment of a cardiac acoustic mapping system.
Medical and Biological Engineering and Computing,
36(4):431–437.
Daniela, T. (1996). Clinical characteristics and prognosis
significance of bundle-branch block (bbb) associated
with acute myocardial infarction (ami). Rom J Intern
Med, 34(3-4):211–215.
El-Segaier, M., Lilja, O., Lukkarinen, S., S
¨
ornmo, L., Sep-
ponen, R., and Pesonen, E. (2005). Computer-based
detection and analysis of heart sound and murmur. An-
nals of Biomedical Engineering, 33(7):937–942.
Homaeinezhad, M., Sabetian, P., Feizollahi, A., Ghaf-
fari, A., and Rahmani, R. (2012). Parametric mod-
elling of cardiac system multiple measurement sig-
nals: an open-source computer framework for perfor-
mance evaluation of ecg, pcg and abp event detec-
tors. Journal of medical engineering & technology,
36(2):117–134.
Iwata, A., Ishii, N., Suzumura, N., and Ikegaya, K. (1980).
Algorithm for detecting the first and the second heart
sounds by spectral tracking. Medical and Biological
Engineering and Computing, 18(1):19–26.
Kang, S., Doroshow, R., McConnaughey, J., Khandoker, A.,
and Shekhar, R. (2015). Heart sound segmentation to-
ward automated heart murmur classification in pedi-
atric patents. In 2015 8th International Conference
on Signal Processing, Image Processing and Pattern
Recognition (SIP), pages 9–12. IEEE.
Kania, M., Rix, H., Fereniec, M., Zavala-Fernandez, H.,
Janusek, D., Mroczka, T., Stix, G., and Maniewski, R.
(2014). The effect of precordial lead displacement on
ecg morphology. Medical & biological engineering &
computing, 52(2):109–119.
Karnath, B. and Thornton, W. (2002). Auscultation of the
heart. Hospital Physician, 38(9):39–45.
Kumar, D., Carvalho, P. d., Antunes, M., Henriques, J.,
Maldonado, M., Schmidt, R., and Habetha, J. (2006).
Wavelet transform and simplicity based heart mur-
mur segmentation. In 2006 Computers in Cardiology,
pages 173–176. IEEE.
Laguna, P., Jan
´
e, R., and Caminal, P. (1992). Adaptive fil-
tering of ecg baseline wander. In 1992 14th Annual
International Conference of the IEEE Engineering in
Medicine and Biology Society, volume 2, pages 508–
509.
Lehner, R. J. and Rangayyan, R. M. (1987). A three-channel
microcomputer system for segmentation and charac-
terization of the phonocardiogram. IEEE Transactions
on Biomedical Engineering, (6):485–489.
Liang, H., Lukkarinen, S., and Hartimo, I. (1997). Heart
sound segmentation algorithm based on heart sound
envelogram. In Computers in Cardiology 1997, pages
105–108. IEEE.
Liang, H., Lukkarinen, S., and Hartimo, I. (1998). A bound-
ary modification method for heart sound segmentation
algorithm. In Computers in Cardiology 1998. Vol. 25
(Cat. No. 98CH36292), pages 593–595. IEEE.
Lima, C. S. and Cardoso, M. J. (2007). Phonocardiogram
segmentation by using hidden markov models.
Nogata, F., Yokota, Y., Kawamura, Y., Morita, H., and Uno,
Y. (2012). Novel technique for visualizing heart mo-
BIOSIGNALS 2020 - 13th International Conference on Bio-inspired Systems and Signal Processing
212

tion without using ultrasonic cardiography. In Pro-
ceedings of 2012 IEEE-EMBS International Confer-
ence on Biomedical and Health Informatics, pages
249–252. IEEE.
Okada, M. (1982). Chest wall maps of heart sounds
and murmurs. Computers and biomedical research,
15(3):281–294.
O’Keefe Jr, J. H., Hammill, S. C., Freed, M. S., and Pog-
wizd, S. M. (2010). The complete guide to ECGs.
Jones & Bartlett Publishers.
¨
Olmez, T. and Dokur, Z. (2003). Classification of heart
sounds using an artificial neural network. Pattern
Recognition Letters, 24(1-3):617–629.
Oskiper, T. and Watrous, R. (2002). Detection of the first
heart sound using a time-delay neural network. In
Computers in Cardiology, pages 537–540. IEEE.
Pan, J. and Tompkins, W. J. (1985). A real-time qrs detec-
tion algorithm. IEEE Trans. Biomed. Eng, 32(3):230–
236.
Phanphaisarn, W., Roeksabutr, A., Wardkein, P., Koseeya-
porn, J., and Yupapin, P. (2011). Heart detection and
diagnosis based on ecg and epcg relationships. Medi-
cal devices (Auckland, NZ), 4:133.
Ricciardi, D., Cavallari, I., Creta, A., Giovanni, G. D., Cal-
abrese, V., Belardino, N. D., Mega, S., Colaiori, I.,
Ragni, L., Proscia, C., Nenna, A., and Sciascio, G. D.
(2016). Impact of the high-frequency cutoff of band-
pass filtering on ecg quality and clinical interpretation:
A comparison between 40hz and 150hz cutoff in a sur-
gical preoperative adult outpatient population. Jour-
nal of Electrocardiology, 49(5):691 – 695.
Ricke, A. D., Povinelli, R. J., and Johnson, M. T. (2005).
Automatic segmentation of heart sound signals using
hidden markov models. In Computers in Cardiology,
2005, pages 953–956. IEEE.
Sapsanis, C., Welsh, N., Pozin, M., Garreau, G., Tognetti,
G., Bakhshaee, H., Pouliquen, P. O., Mitral, R.,
Thompson, W. R., and Andreou, A. G. (2018).
Stethovest: A simultaneous multichannel wearable
system for cardiac acoustic mapping. In 2018 IEEE
Biomedical Circuits and Systems Conference (Bio-
CAS), pages 1–4. IEEE.
Schmidt, S. E., Holst-Hansen, C., Graff, C., Toft, E., and
Struijk, J. J. (2010). Segmentation of heart sound
recordings by a duration-dependent hidden markov
model. Physiological measurement, 31(4):513.
Shino, H., Yoshida, H., Yana, K., Harada, K., Sudoh, J., and
Harasewa, E. (1996). Detection and classification of
systolic murmur for phonocardiogram screening. In
Proceedings of 18th Annual International Conference
of the IEEE Engineering in Medicine and Biology So-
ciety, volume 1, pages 123–124. IEEE.
Syed, Z., Guttag, J., Levine, R., Nesta, F., and Curtis, D.
(2004). Automated auscultation system. US Patent
App. 10/464,267.
Wang, X., Li, Y., Sun, C., and Liu, C. (2009). Detec-
tion of the first and second heart sound using heart
sound energy. In 2009 2nd International Conference
on Biomedical Engineering and Informatics, pages 1–
4. IEEE.
Wartak, J. (1972). Phonocardiology; integrated study of
heart sounds and murmurs. HarperCollins Publishers.
Zarrabi, M., Parsaei, H., Boostani, R., Zare, A., Dorfeshan,
Z., Zarrabi, K., and Kojuri, J. (2017). A system for
accurately predicting the risk of myocardial infarction
using pcg, ecg and clinical features. Biomedical En-
gineering: Applications, Basis and Communications,
29(03):1750023.
Zhong, L., Guo, X., Ji, A., and Ding, X. (2011). A robust
envelope extraction algorithm for cardiac sound signal
segmentation. In 2011 5th International Conference
on Bioinformatics and Biomedical Engineering, pages
1–5. IEEE.
Analysis of ECG and PCG Time Delay around Auscultation Sites
213
