
Two-stage Artificial Intelligence Clinical Decision Support System for
Cardiovascular Assessment using Convolutional Neural Networks
and Decision Trees
Shahab Pasha
1a
, Jan Lundgren
1b
Marco Carratù
2
, Patrik Wreeby
3
and Consolatina Liguori
2
1
STC Research Centre, Mid Sweden University, Sundsvall, Sweden
2
Department of Industrial Engineering, University of Salerno, Fisciano, Italy
3
Premicare AB, Sörberge, Sweden
Keywords: Artificial Intelligence, Cardiovascular Assessment, Decision Trees, Deep Learning, Feature Selection.
Abstract: This paper describes an artificial-intelligence–assisted screening system implemented to support medical
cardiovascular examinations performed by doctors. The proposed system is a two-stage supervised classifier
comprising a convolutional neural network for heart murmur detection and a decision tree for classifying vital
signs. The classifiers are trained to prioritize higher-risk individuals for more time-efficient assessment. A
feature selection approach is applied to maximize classification accuracy by using only the most significant
vital signs correlated with heart issues. The results suggest that the trained convolutional neural network can
learn and detect heart sound anomalies from the time-domain and frequency-domain signals without using
any user-guided mathematical or statistical features. It is also concluded that the proposed two-stage approach
improves diagnostic reliability and efficiency.
1 INTRODUCTION
The healthcare sector is entering the age of global
artificial intelligence (AI) convergence (Morsy,
2018). Benefiting from mobile applications and large-
scale data, technologies such as Blue Button (website
of the Office of the National Coordinator for Health
Information Technology, n.d.) and IBM Watson
(IBM Watson, n.d.) help track treatment progress and
reduce wrong diagnoses. In healthcare, AI covers a
wide range of applications, including screening (Lin,
Chang, Lin, Tsai, & Chen, 2017), monitoring (Ivascu,
Cincar, & Negru, 2017), and diagnosis (Islam
Chowdhuryy, Sultana, Ghosh, Ahamed, &
Mahmood, 2018). Of the applied AI methods, deep
learning techniques (Gharehbaghi & Lindén, 2017;
Loh & Then, 2017) seem to be more adaptable,
accurate, and robust in a wide range of applications
and biological signals, such as lung sound
classification (Chen, Zhang, Tian, Zhang, Chen, &
Lei, 2016), cardiac auscultation (Amiriparian,
Schmitt, M., Cummins, N., Qian, K., Dong, F., &
Schuller, 2018),
phonocardiography (Thomae &
a
https://orcid.org/0000-0002-6805-166X
b
https://orcid.org/0000-0003-1819-6200
Dominik, 2016), and vital sign evaluation (Jones,
2013).
Biological signals (e.g., heart sound signals) with
cyclic characteristics often display nonstationary
behavior not only within but across cycles in cycle-
to-cycle variation. This gives the signal a high level
of complexity, making classifier development a major
challenge.
Unlike in many industrial applications, the origin
of the complexities in most biological signals has yet
to be fully understood (Gharehbaghi & Lindén,
2017).
AI-assisted methods applied to biological signals
can be categorized into four main categories: neural
network-based and deep learning classification
(Zabihi, Rad, Kiranyaz, Gabbouj, & Katsaggelos,
2016), support vector machine-based classification
(Barhatte, Ghongade, & Thakare, 2015), hidden
Markov-model–based classification (Vernekar, Nair,
Vijaysenan, & Ranjan, 2016), and clustering-based
classification (Clifford, 2016). Advanced deep
learning techniques can automatically extract salient
patterns directly from the input (i.e., training set) and
use the produced knowledge to classify unseen
samples (Shao, Wu, & Li, 2014).
This
capability
of
Pasha, S., Lundgren, J., Carratù, M., Wreeby, P. and Liguori, C.
Two-stage Artificial Intelligence Clinical Decision Support System for Cardiovascular Assessment using Convolutional Neural Networks and Decision Trees.
DOI: 10.5220/0008941801990205
In Proceedings of the 13th International Joint Conference on Biomedical Engineering Systems and Technologies (BIOSTEC 2020) - Volume 4: BIOSIGNALS, pages 199-205
ISBN: 978-989-758-398-8; ISSN: 2184-4305
Copyright
c
2022 by SCITEPRESS – Science and Technology Publications, Lda. All rights reserved
199

Figure 1: The two stage AI decision support system.
deep networks makes them the right tool with which
to extract and learn particular patterns from diverse
and relatively large training sets, such as heart sound
databases (PhysioNet, 2016). However most existing
AI-assisted heart sound analysis systems use
medically incomprehensible mathematical and
statistical features, such as wavelets (Clifford, 2016),
Stockwell transformation (Moukadem, Dieterlen, &
Brandt, 2013), Mel-frequency cepstral coefficients
(MFCCs) (Chen, 2017), and the likelihood function
(Yamashita, Himeshima, & Matsunaga, 2014).
In this research, a convolutional neural network
(CNN) is trained based on the time-domain and high-
resolution frequency-domain “normal” and
“abnormal” heart sound signals (PhysioNet, 2016).
Along with the heart sound signals, the vital signs and
patient information are analyzed by a C4.5 decision
tree as side information for a comprehensive
cardiovascular assessment. An optimization process
(Visalakshi & Radha, 2014) is applied to find the
optimal subset of vital signs yielding the highest
classification accuracy. The proposed system is
designed for making suggestions to support the
clinical assessment process. The system uses signal
processing and data-mining techniques to maximize
accuracy, using filters designed to find the most
significant frequency band for heart murmurs and to
find the optimized set of vital signs.
The remainder of this paper is organized as
follows. Section 2 briefly describes the
cardiovascular examination procedure as performed
by medical experts. Section 3 describes the proposed
AI system and the deep network structure replicating
the medical procedure described in section 2. In
section 4, the proposed two-stage system is trained
and evaluated. The paper concludes in section 5.
2 CARDIVASCULAR
EXAMINATION AND THE
HEART SOUND MODEL
During a cardiovascular examination, the doctor has
the patient assume either a lying supine or a sitting
position and starts with the general examination,
which includes measuring body temperature, blood
pressure, skin hydration, pulse, and blood oxygen
saturation. Heart sound auscultation with a
stethoscope is the next step after the general
examination. The doctor listens to the heart at the
apex, base (i.e., the part of the heart between the apex
and sternum), and in the aortic and pulmonary areas.
A normal heart sound consists of two fundamental
sounds referred to as 𝑆1 and 𝑆2. 𝑆1 occurs when the
mitral and tricuspid valves close and 𝑆2 occurs when
the aortic and pulmonic valves close. Other sounds
include the third heart sound 𝑆3, the fourth heart
sound 𝑆4, the systolic ejection click (EC), the mid-
systolic click (MC), the diastolic sound or opening
snap (OS), and heart murmurs. Heart murmurs (Vepa,
2009) made by turbulent blood flow in the heart and
blood leakage through the closed valves are a
stationary low-frequency noise that indicates
underlying heart issues. This might happen during the
delay between 𝑆1 and 𝑆2 (i.e., the systole) or
between two consecutive beats (i.e., the diastole).
The heart sound signal is a low-frequency signal
covering a range of frequencies from 20 to 500 Hz, so
a relatively low sampling frequency, i.e. 2000 Hz
according to the PhysioNet database (PhysioNet,
2016), is sufficient.
The generated heart sound traveling through the
chest and being distorted by the respiratory noise is
mathematically modeled as:
𝑥
𝑛
ℎ
𝑛 ∗𝑠
𝑛
ℎ
𝑛 ∗ 𝑙
𝑛
𝑣
𝑛
,
(1)
BIOSIGNALS 2020 - 13th International Conference on Bio-inspired Systems and Signal Processing
200

where 𝑥
𝑛
is the signal detected by the stethoscope,
𝑠
𝑛
the heart sound, 𝑙
𝑛
the bronchial/vesicular
lung sounds, and ℎ
and ℎ
the acoustic response of
the chest at the stethoscope location from the heart
and lung sounds, respectively. However, no study has
investigated the conjectured contribution of breathing
sounds to heart auscultation and so far no standard
filtering scheme has been proposed (Dalmay,
Antonini, Marquet, & Menier, 1995).
3 THE TWO-STAGE
CLASSIFICATION SYSTEM
The heart sound signal and the vital signs provide
partial indicators of the patient’s cardiovascular
health. As depicted in Figure 1, the proposed system
is a two-stage classifier that analyzes the heart sound
signals (using CNN) and the vital signs (using
decision trees) for a comprehensive initial
assessment. The scoring scheme (Table 1) labels an
individual “normal” if the heart sound signal and vital
signs are both classified as “normal.”
3.1 Deep Learning for Heart Sound
Anomaly Detection
The problem of classifying heart sounds by deep
learning is formulated as minimizing the loss
function, defined as the difference between the target
vector (i.e., ground truth labels) and predicted results
(i.e., classifier outputs) (5). Let us assume that there
are 𝑁 recordings comprising 𝑐 classes (in this
research 𝑐2, “normal” and “abnormal”) and the
recording length is represented by 𝐷 (in this research
𝐷 ranges from 4000 to 12,000, translating to 2–6
seconds at 𝑓
2 𝑘𝐻𝑧).
x
𝑥
,..,𝑥
.
(1)
The frequency domain signal with
𝑁
256
frequency bins calculated and averaged over 64 sample
windows with a 32-sample overlap
is represented by:
Table 1: The proposed scoring scheme.
Heart sound Vital signs Score
Normal Normal Normal
Abnormal Normal
Possible anomaly
if recurring
Normal Abnormal
Possible anomaly
if recurring
Abnormal Abnormal
Needs to be
examined by a
docto
r
𝑥
𝑥
𝑛
𝑒
2
𝑗
𝜋
𝑘𝑛
𝑁1
𝑛0
,
(2)
where 𝑘∈
1,…,𝑁
.
x
𝑥
,..,𝑥
,
(3)
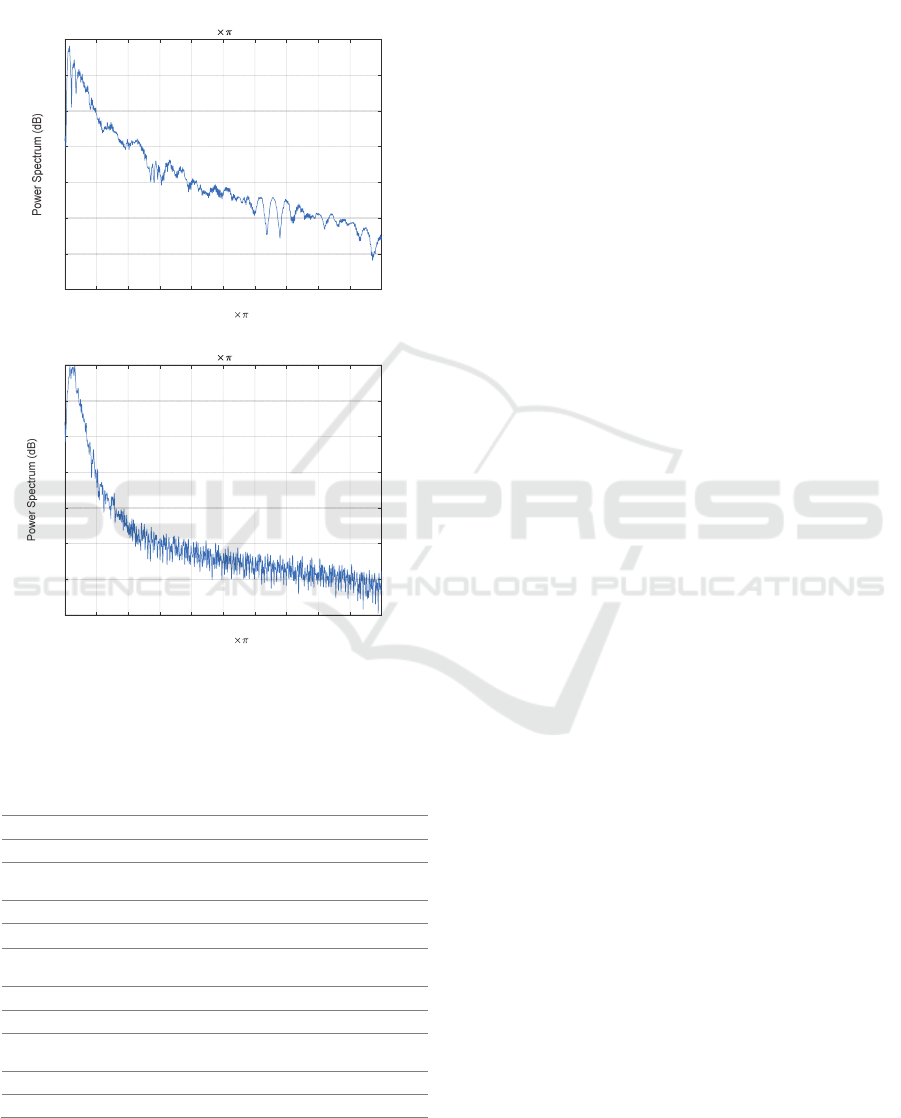
It is observed that normal heart sounds have distinct
peaks (i.e., sharp edges correlated with higher
frequencies) at 𝑆1 and 𝑆2, whereas abnormal heart
sounds have weaker 𝑆1 and 𝑆2 edges distorted by
strong murmurs (Figure 2). In the PhysioNet
database, most abnormal instances are related to heart
valve defects and coronary artery disease patients
(PhysioNet, 2016). The presence of murmurs
increases the heart sound complexity (Moukadem,
Dieterlen, & Brandt, 2013). This difference leads to a
30 dB difference (Figure 2) between the “normal” and
the “ abnormal ” signal spectra. The binary
classifier is trained by the time-domain (2) and
frequency-domain (4) representations of the heart
sound signals and by the ground-truth labels y ∈
{y_Normal,y_Abnormal} provided by the applied
database (PhysioNet, 2016). For a database consisting
of N persons’ data, the matrix of the heart sound
recordings is X_hs∈R^(N×D) and the target vector
is y_hs∈Β^(N×1).
𝐗
𝑥
1,1
…𝑥
1,𝐷
⋮⋱⋮
𝑥
𝑁,1
…𝑥
𝑁,𝐷
. (4)
The predictor’s matrix 𝐗
as in (4) and the target
𝐲
are applied to train the network, which is
mathematically modeled as:
𝑚𝑖𝑛ℓ𝑌,∅
𝑋,𝑊
,…,𝑊
𝜆Ө
𝑊
,…,𝑊
,
𝑊
,
(5)
where ℓ
𝑌,∅
is a loss function measuring the
agreement between the true output 𝒚 and the
predicted output.
∅
𝐗
,𝐖
. The predicted label for each sample
recording 𝑥 from (1) (rows of 𝐗) is:
𝑦Ѱ𝐱
W
,
(6)
where Ѱ and 𝐖 represent the bias and weights of the
deep network, respectively. Table 2 summarizes the
applied deep network architecture of the CNN that
accepts a matrix (i.e., the transformed time-domain or
frequency-domain vector) as input. A standard sound
classification architecture is applied consisting of
three convolutional layers, each followed by batch-
normalization and max-pooling layers, followed by
two fully connected layers before the final
classification (Kim, Lee, & Nam, 2018). The applied
dataset (𝐗
) includes 3126 normal and abnormal
Two-stage Artificial Intelligence Clinical Decision Support System for Cardiovascular Assessment using Convolutional Neural Networks
and Decision Trees
201
heart sound recordings sampled at 𝑓
2000 𝐻𝑧.
The length of the database recordings (PhysioNet,
2016) varies, but to maintain consistency, all the
experiments are done with training sets and test sets
of the same lengths (i.e., 2𝑠,…,6𝑠). Having 𝑥
𝑛
a)
b
)
Figure 2: Power spectrum of a) normal heart sound with
distinct peaks and b) weaker abnormal heart sound.
Table 2: Summary of the CNN configuration.
Layer Type Output
Kernel
s
ize
Stride
1 Convolution
12888 8 1
2 BatchNorm
12888
3
Max
pooling
64 4 8 4 2
4 Convolution
64 4 8 8 1
5 BatchNorm
64 4 8
6
Max
pooling
32 2 8 4 2
7 Convolution
32 2 8 8 1
8 BatchNorm
32 2 8
9
Max
pooling
12 1 8 4 2
10 Flatten
96
11 Softmax
2
from (1), the low-pass ( 𝑔
) and high-pass ( 𝑔
)
filtered signals are given by:
𝑥
𝑛
𝑔
𝑛
∗𝑥
𝑛
.
(7)
The training set 𝐀
∈ℝ
,𝑀≅0.7𝑁 consists
of 70% of the dataset. The heart sound vectors are
transformed into matrices to match the 2D input layer
of the CNN (Table 2) The initial learning rate is set to
0.01 with a maximum of 250 epochs. All convolution
layers are zero padded to preserve the input
dimension.
3.2 Decision Tree for the Vital Signs
Let
𝐗
,𝐲
denote the vital signs of 𝑁 individuals
and the ground-truth targets; 𝛉 represents the
classification parameters and ∁ the cost function. The
goal of the classification problem is to find the
classifier 𝑓𝐱
,𝛉
where 𝛉
argmin
,
∁𝛉. Thirteen vital signs ( Ζ )
(University of California Irvine Machine Learning
Repository, n.d.) associated with heart defects are
considered in this research. Medical experts believe
that these 13 vital signs and additional patient
information can help in understanding the heart defect
cause and type, if measured or provided as side
information during a cardiovascular examination.
The C4.5 decision tree (i.e., the advanced version
of the ID3 algorithm) is applied in this work to create
models including both continuous numerical data
(e.g., age and serum cholesterol) and categorical data
(e.g., sex and chest pain type). The process of
inducing the decision tree includes calculating the
information gain and the gain ratio of each feature,
which shows the significance of each feature for the
classification. Finding the right threshold for each
feature depending on the data distribution is also part
of the inducing process. The applied dataset includes
thirteen features ( Ζ ) of 270 adults (i.e., 300
augmented instances). There are
13
1
⋯
13
13
1891 possible combinations of features used
in performing the classification. The feature selection
process of this research (Table 4) concludes that using
only the six features highlighted in Table 3
outperforms all other possible combinations and also
reduces the computation cost. This feature selection
improves the classification accuracy (11) by 11
percentage points from 72% to 83% compared with
the scenario in which all thirteen features are applied.
Information gain and entropy are applied to decide
the most significant vital signs. The entropy of each
vital sign is defined as:
0 0.1 0.2 0.3 0.4 0.5 0.6 0.7 0.8 0.9 1
Normalized Frequency ( radians/sample)
-90
-80
-70
-60
-50
-40
-30
-20
Fres =0.0019536 radians/sample
0 0.1 0.2 0.3 0.4 0.5 0.6 0.7 0.8 0.9 1
Normalized Frequency ( radians/sample)
-110
-100
-90
-80
-70
-60
-50
-40
Fres =0.0019536 radians/sample
BIOSIGNALS 2020 - 13th International Conference on Bio-inspired Systems and Signal Processing
202

𝐻𝐗
𝑣𝑖
𝑝
log
𝑝
,
(8)
where 𝑝
is the probability of each class in 𝐗
.
Using 𝐻, the information gain (∆𝐻) for a vital sign
(𝑧∈Ζ) is given by:
∆𝐻
𝐻
𝐗
𝐻
𝐗
,𝑧
.
(9)
where 𝐻
𝐗
,𝑧
is the entropy of 𝐗
classified
according to the feature 𝑧
. Accuracy and other
classification measurements are then calculated by:
𝐴𝑐𝑐𝑢𝑟𝑎𝑐𝑦
𝑇
𝑇
𝑇
𝑇
𝐹
𝐹
,
(10)
𝑆𝑒𝑛𝑠𝑖𝑡𝑖𝑣𝑖𝑡𝑦𝑇𝑃𝑅
,
(11)
𝑆𝑝𝑒𝑐𝑖𝑓𝑖𝑐𝑖𝑡𝑦𝑇𝑁𝑅
,
(12)
𝑃𝑟𝑒𝑐𝑖𝑠𝑖𝑜𝑛𝑃𝑃𝑉
𝑇
𝑇
𝐹
,
(13)
𝐹𝑠𝑐𝑜𝑟𝑒2
.
(14)
Table 3: The applied vital signs and patient data.
Vital sign
Information
gain
1. Age
2. Sex*
3. Chest pain*
4. Resting blood pressure
5. Serum cholesterol
6. Fasting blood sugar
7. Resting electrocardiographic results
8. Maximum heart rate achieved
9. Exercise-induced angina *
10. Old peak
11.Slope of the peak exercise ST
segment *
12. Number of major vessels colored
by fluoroscopy*
13. Thalassemia *
0.015
0.222
0.266
0.015
0.052
0.008
0.060
0.079
0.120
0.089
0.194
0.188
0.218
Table 4: Feature selection algorithm.
Calculate ∆𝐻 (9) for all the vital signs Ζ using 𝐗
and
𝐲
.
Sort the features based on their ∆𝐻 (Table 3) in
descending order
Ζ
.
For 𝑖2 to 13 (length of Ζ
:
Classify the test set using the first 𝑖 features from
Ζ
and calculate the classification accuracy
(𝐴𝑐𝑐𝑢𝑟𝑎𝑐𝑦
𝑖
) (10)
Stop the process if 𝐴𝑐𝑐𝑢𝑟𝑎𝑐𝑦
𝑖
𝐴𝑐𝑐𝑢𝑟𝑎𝑐𝑦𝑖
1
4 EVALUATION AND
DISCUSSION
The CNN classifier and the decision tree are
evaluated using unseen samples that were excluded
from the training set. The effect of the heart sound
recording lengths, filtering and feature selection are
investigated in the evaluation process. As the two
stages consume different types of signals they are
independently trained and evaluated.
4.1 CNN Evaluation
The trained CNN was able to correctly classify an
average of 74.19%
(10) of 660 unseen samples of
different frame lengths (Figure 3) from the database
and from recordings made using a Thinklabs One
digital stethoscope (Thinklabs, n.d.) down-sampled
from 44.1 𝑘𝐻𝑧 to 2 𝑘𝐻𝑧 . The F-score
(14) is
calculated for the time-domain (1) and frequency-
domain signals (3) in Figure 3 for different test set
frame lengths. It is important to note that the false
negatives (i.e., individuals with heart issues who are
not detected by the classifier) are the main concern of
medical experts, and the goal of the assessment
process is to minimize the false negative rate, i.e.,
𝐹𝑁𝑅1 𝑇𝑃𝑅
(11). It is shown that the minimum
required heart sound auscultation length for obtaining
reliable results is 5~6 seconds (Figure 4).
Figure 3: Heart sound signal classification evaluation by
CNN.
A high-pass filter (500–1000 Hz) and a low-pass filter
(0–500 Hz) with 80𝑑𝐵 attenuation per octave are
applied to coarsely find the more discriminative
frequency band. A more thorough investigation of the
frequency bands is conducted by using low-pass and
high-pass filters with varying pass-band frequencies
22.533.544.555.56
Frame len
g
th
(
Seconds
)
0.3
0.4
0.5
0.6
0.7
0.8
0.9
1
Frequecy domain-Full band
Frequecy domain-Lower band
Frequecy domain-Upper band
Time domain-Full band
Time domain-Lower band
Time domain-Upper band
Two-stage Artificial Intelligence Clinical Decision Support System for Cardiovascular Assessment using Convolutional Neural Networks
and Decision Trees
203
ranging from a minimum of 200 Hz to a maximum of
800 Hz (Figure 5). The results suggest that using a
high-pass filter with a pass-band frequency of 200 Hz
(i.e., suppressing the 0–200 Hz band) yields the
highest classification accuracy. This could be due to
removing the low-frequency noise from the
respiratory system while passing the discriminative
components of the murmur and heartbeat signals.
Figure 4: Classification results for filtered four-second
signals.
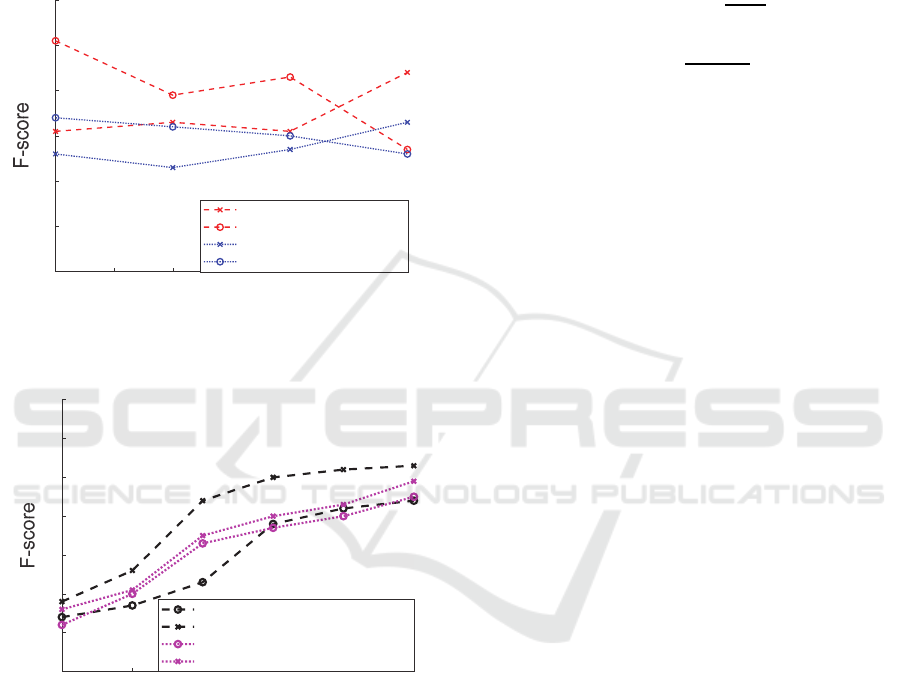
Figure 5: Vital sign classification and feature selection
evaluation.
4.2 Decision Tree Evaluation
The induced C4.5 decision tree successfully classified
83% (feature selection enabled) and 72% (using all
features) of the unseen vital signs from the test set.
The F-score is calculated to evaluate the classification
accuracy, including both precision and recall. The
results are compared with those of the baseline
support vector machine (SVM) usually used as a
binary classifier. It is shown that the C4.5 classifier
outperforms the baseline SVM for all training set
sizes (Figure 6).The experimental studies also
investigated the significance of feature selection
(Visalakshi & Radha, 2014) to find the optimal set
yielding the highest classification accuracy, which
could be of considerable interest for large healthcare
project data collection. It is observed that using only
the six selected features (highlighted in ) improves the
F-score by an average of 0.2 for the C4.5 classifier.
𝑃𝑟𝑒𝑐𝑖𝑠𝑖𝑜𝑛𝑃𝑃𝑉
,
(13
)
𝐹𝑠𝑐𝑜𝑟𝑒2
.
(14
)
5 CONCLUSION
This research reported an implementation of an AI
system trained for cardiovascular examination
decision support. The aim of the project was to
analyze the heart sound signals and patient
information to produce a reliable, comprehensive,
and time-efficient screening. The results suggest that
the proposed two-stage approach provides accurate
suggestions that correctly classify a maximum of 91%
of the heart sound signals and 83% of the
accompanying vital signs and information. Although
using the time-domain and frequency-domain
representations of the heart sound signals did not
improve the results compared with the mathematical
and statistical features applied in the PhysioNet
challenge, using the side information and the vital
signs within a two-stage approach increased the
screening reliability. Future work will investigate
more specialized deep network architectures for
diagnosing each heart defect type.
REFERENCES
Amiriparian, S., Schmitt, M., Cummins, N., Qian, K.,
Dong, F., & Schuller, B. (2018). Deep unsupervised
representation learning for abnormal heart sound
classification. 40th Annual International Conference of
the IEEE Engineering in Medicine and Biology Society
(EMBC). 18–21 July, Honolulu, USA.
Barhatte, A., Ghongade, R., & Thakare, A. (2015). QRS
complex detection and arrhythmia classification using
SVM. 2015 Communication, Control and Intelligent
Systems (CCIS). 7–8 Nov., Mathura, India.
Chen, Q., Zhang, W., Tian , X., Zhang, X., Chen, S., & Lei,
W. (2016). Automatic heart and lung sounds
classification using convolutional neural networks.
2016 Asia-Pacific Signal and Information Processing
200 300 400 500 600 700 800
Passband frequenc
y(
Hz
)
0.4
0.5
0.6
0.7
0.8
0.9
1
Frequency domain-Lowpass
Frequency domain-Highpass
Time domain-Lowpass
Time domain-Highpass
50 100 150 200 250 300
Size of the trainin
g
set
0.3
0.4
0.5
0.6
0.7
0.8
0.9
1
C4.5- All the features
C4.5 Decision tree- Feature selection
SVM- All the features
SVM- Feature selection
BIOSIGNALS 2020 - 13th International Conference on Bio-inspired Systems and Signal Processing
204

Association Annual Summit and Conference. 13–16
Dec., Jeju, Korea.
Chen, T. (2017). S1 and S2 heart sound recognition using
deep neural networks. Transactions on Biomedical
Engineering, 64(2), 372–380.
Clifford, G. (2016). Classification of normal/abnormal
heart sound recordings: The PhysioNet/Computing in
Cardiology Challenge 2016. 2016 Computing in
Cardiology Conference (CinC). 11–14 Sept.,
Vancouver, BC, Canada.
Dalmay, F., Antonini, M., Marquet, P., & Menier, R.
(1995). Acoustic properties of the normal chest.
European Respiratory Journal, 8(10), 1761–1769.
Gharehbaghi, A., & Lindén, M. (2017). A deep machine
learning method for classifying cyclic time series of
biological signals using time-growing neural network.
Transactions on Neural Networks and Learning
Systems, 29(9), 4102–4115.
IBM Watson. (n.d.). Retrieved 23 September 2019 from
https://www.ibm.com/watson
Islam Chowdhuryy, M., Sultana, M., Ghosh, R., Ahamed,
J., & Mahmood, M. (2018). AI assisted portable ECG
for fast and patient specific diagnosis. International
Conference on Computer, Communication, Chemical,
Material and Electronic Engineering (IC4ME2). 8–9
Feb., Rajshahi, Bangladesh.
Ivascu, T., Cincar, K., & Negru, V. (2017). Activities of
daily living and falls recognition and classification from
the wearable sensors data. 2017 E-Health and
Bioengineering Conference (EHB). 22–24 June, Sinaia,
Romania.
Jones, B. (2013). Developing a vital sign alert system. The
American Journal of Nursing, 8(113), 36-44.
Kim, T., Lee, J., & Nam, J. (2018). Sample-level CNN
architectures for music auto-tagging using raw
waveforms. ICASSP 2018 – 2018 IEEE International
Conference on Acoustics, Speech and Signal
Processing (ICASSP). 15–20 April, Calgary, AB,
Canada.
Lin, C., Chang, Y., Lin, C., Tsai, L., & Chen, J. (2017).
Development of an AI-based non-invasive Pulse
AudioGram monitoring device for arrhythmia
screening. 2017 IEEE Healthcare Innovations and
Point of Care Technologies (HI-POCT). 6–8 Nov.,
Bethesda, MD, USA.
Loh, B., & Then, P. (2017). Deep learning for cardiac
computer-aided diagnosis: benefits, issues & solutions.
Mhealth, 3(45), doi: 10.21037/mhealth.2017.09.01.
Morsy, A. (2018). Can AI truly transform health care? A
recent IEEE Pulse on Stage forum offers some
perspective. IEEE Pulse, 9(4), 18–20.
Moukadem, A., Dieterlen, A., & Brandt, C. (2013).
Shannon Entropy based on the S-Transform
Spectrogram applied on the classification of heart
sounds. 2013 IEEE International Conference on
Acoustics, Speech and Signal Processing. 26–31 May,
Vancouver, BC, Canada.
Official Website of the Office of the National Coordinator
for Health Information Technology (ONC). (n.d.).
Retrieved 23 September 2019 from
https://www.healthit.gov/topic/health-it-
initiatives/blue-button
PhysioNet. (2016). Retrieved 26 February 2019 from
https://physionet.org/challenge/2016/
Shao, L., Wu, D., & Li, X. (2014). Learning deep and wide:
A spectral method for learning deep networks.
IEEE
Transactions on Neural Networks and Learning
Systems, 25(12), 2303–2308.
Thinklabs. (n.d.). Retrieved 3 October 2019 from
https://www.thinklabs.com/one-digital-stethoscope
Thomae, C., & Dominik, A. (2016). Using deep gated RNN
with a convolutional front end for end-to-end
classification of heart sound. 2016 Computing in
Cardiology Conference (CinC). 11–14 Sept.,
Vancouver, BC, Canada.
University of California Irvine Machine Learning
Repository. (n.d.). (Center for Machine Learning and
Intelligent Systems) Retrieved 1 October 2019 from
http://archive.ics.uci.edu/ml/datasets/statlog+(heart)
Vepa, J. (2009). Classification of heart murmurs using
cepstral features and support vector machines. 2009
Annual International Conference of the IEEE
Engineering in Medicine and Biology Society. 3–6
Sept., Minneapolis, MN, USA.
Vernekar, S., Nair, S., Vijaysenan, D., & Ranjan, R. (2016).
A novel approach for classification of normal/abnormal
phonocardiogram recordings using temporal signal
analysis and machine learning. 2016 Computing in
Cardiology Conference (CinC). 11–14 Sept.,
Vancouver, BC, Canada.
Visalakshi, S., & Radha, V. (2014). A literature review of
feature selection techniques and applications: Review
of feature selection in data mining. 2014 IEEE
International Conference on Computational
Intelligence and Computing Research. 18–20 Dec.,
Coimbatore, India.
Yamashita, M., Himeshima, M., & Matsunaga, S. (2014).
Robust classification between normal and abnormal
lung sounds using adventitious-sound and heart-sound
models. 2014 IEEE International Conference on
Acoustics, Speech and Signal Processing (ICASSP). 4–
9 May, Florence, Italy.
Zabihi, M., Rad, A., Kiranyaz, S., Gabbouj, M., &
Katsaggelos, A. (2016). Heart sound anomaly and
quality detection using ensemble of neural networks
without segmentation. 2016 Computing in Cardiology
Conference (CinC). 11–14 Sept., Vancouver, BC,
Canada.
Two-stage Artificial Intelligence Clinical Decision Support System for Cardiovascular Assessment using Convolutional Neural Networks
and Decision Trees
205
