
A Hybrid Visual Analytics Framework to Evaluate Trauma
Incidences and Enhance Patient Care
Waqar Haque
1 a
, Jordan Oliver
2 b
, Sonal Bajaj
2 c
and Navjot Kaur
1 d
1
Department of Computer Science, University of Northern British Columbia, Prince George, Canada
2
Northern Health, Prince George, Canada
Keywords: Healthcare Analytics, Trauma Care, Visual Analytics, Online Analytical Processing.
Abstract: Large volumes of data has been collected on unintentional injuries and mortality. Besides years of life lost,
traumatic injuries account for a significant portion of healthcare expenditure. With intelligent visual analytics,
the collected data can be used for informed decision making and resource allocation. A multi-dimensional
online analytical processing (OLAP) cube has been developed using data from BC Trauma Registry (BCTR)
and Discharge Abstract Database (DAD). We propose a comprehensive framework which uses the OLAP
cube, a web-based data entry platform populating a standalone database, filters consistent with Accreditation
Canada (AC) measures, AC inclusion/exclusion criteria, and tools which render reports from historical and
operational perspectives. These reports are grouped in higher level categories with intuitive drill-down
capabilities for navigating at finer granularity along multiple dimensions. Access control for data entry is
enabled with provisions for nested groups.
1 INTRODUCTION
Trauma is a global health concern and traumatic
injuries can have an impact on individuals leading to
long term disability and even deaths in some cases
(Provincial Health Services Authority, n.d.).
Depending upon the severity of injury, trauma can be
classified as minor, moderate or major. “Major
trauma is the principal cause of death for people under
age 45 in Canada. Over 700,000 people are injured
each year in BC and more than half of them seek
medical attention. Of these 700,000 British
Columbians injured each year, about 1,800 die, 9,000
suffer permanent disability, 27,000 are hospitalized
and an estimated 41,000 potential years of life are
lost. The yearly cost of injury exceeds $2.8 billion in
BC and is close to $19.8 billion nationally. Falls and
motor vehicle-related injuries are the main causes of
injury-related hospitalization in BC.” (Provincial
Health Services Authority, n.d.) This raises a
compelling question whether any of these injuries or
a
https://orcid.org/0000-0002-6921-8097
b
https://orcid.org/0000-0002-7031-0528
c
https://orcid.org/0000-0002-9323-9453
d
https://orcid.org/0000-0001-5542-7501
deaths could have been prevented by providing better
trauma care and timely assistance.
To analyze the factors associated with each
specific trauma case and to identify gaps in trauma
care, the aid of analytical tools is vital. Business
Intelligence (BI) is defined as “broad category of
applications and technologies for gathering, storing,
analyzing, sharing, and providing access to data to
help enterprise users make better business decisions”
(Ali -Özkan, Crvenkovski, & Johnson, 2016). BI can
integrate data from a wide variety of internal and
external data sources and provide an effective
information platform for decision makers in
healthcare (Foshay & Kuziemsky, 2014). The
extracted information can then be displayed in the
form of an intuitive dashboard providing a visual
analytics platform for decision makers to take
appropriate actions and enable enhanced trauma care.
The metrics of interest include injury severity score
(ISS), location of incidence, time taken for trauma
care to be provided, type of trauma care provided,
transport information, risk groups, and mortality rate.
Haque, W., Oliver, J., Bajaj, S. and Kaur, N.
A Hybrid Visual Analytics Framework to Evaluate Trauma Incidences and Enhance Patient Care.
DOI: 10.5220/0008894500230033
In Proceedings of the 13th International Joint Conference on Biomedical Engineering Systems and Technologies (BIOSTEC 2020) - Volume 5: HEALTHINF, pages 23-33
ISBN: 978-989-758-398-8; ISSN: 2184-4305
Copyright
c
2022 by SCITEPRESS – Science and Technology Publications, Lda. All rights reserved
23

The data is collected by various Health Service
Delivery Areas (HSDA) in several formats and sent
to the Provincial Health Services Authority (PHSA)
for standardization and use in an integrated provincial
trauma system. Over the last few years, the Trauma
Services of BC wing of PHSA has developed a data
warehouse and built a very stable online analytical
processing cube. Several measures and dimensions
have also been identified (Microsoft). We have
integrated this cube with a database thus creating a
hybrid platform to provide the integrated reporting
layer together with ASP.NET based web forms to
enter data related to Trauma Team Activations (TTA)
and other local data sources.
2 RELATED WORK
The application of BI concepts in healthcare is
growing rapidly. Many healthcare institutes (Institute
for Health Metrics and Evaluation (IHME), n.d.)
(World Health Organization (WHO), n.d.)
(University of Utah, n.d.) (Fojut, 2016) (The Trauma
Audit & Research Network (TARN), n.d.) (UMC
Utrecht, n.d.) have used their own data repositories to
develop online analytics and visualization tools for
various diseases (such as cardiovascular, diabetes,
cancer, etc.) and injuries. The Institute of Health
Metrics and Evaluation (IHME) provides a tool which
analyzes data (1990-2016) related to premature
deaths, disabilities, and injury from over 130
countries and can be visualized along several
dimensions including demographics, mortality,
disease causes and risk factors. The visualization is
available in different formats such as map, treemap,
line chart, patterns bar chart, pyramid chart, arrow
chart and heat map. The dashboard can be drilled
down to specific countries and states (Institute for
Health Metrics and Evaluation (IHME), n.d.). The
WHO’s GHO (Global Health Observatory) is a web-
based analysis and visualization tool for global health
priorities (World Health Organization (WHO), n.d.).
The data presented is in form of 35 different theme
pages where each theme presents summary and
reports on global health conditions such as
HIV/AIDS, child health, tuberculosis and road safety.
These dashboards are not completely trauma data
centric and do not provide any information about the
causes of trauma related incidence and deaths, or
trauma patient movement.
The Intermountain Injury Control Research Center
(IICRC) at University of Utah is the central data
repository for trauma-related data. IICRC compiles
and analyzes trauma data making it available for
research (Bureau of Emergency Medical Services &
Preparedness, Utah Department of Health, 2015). A
Trauma Audit dashboard is developed by University
of Utah School of Medicine and is available at state,
hospital and region level. The key performance
indicators (KPIs) used in the dashboard are age,
population, ISS, mortality, field triage, level of care,
transfers (inter or intra-hospital) and mode of
transport amongst others (University of Utah, n.d.).
Centura Health developed a trauma BI application for
monitoring hospital’s trauma system performance
using data from trauma registry and other facilities
(Fojut, 2016). The dashboard is made of pivot tables
allowing users to analyze and report with drill-down
capabilities. The reports can be filtered by injury type
using ICD codes and can be further sliced by month,
fiscal period, quarter, facility and regional groups.
The reports provide insights into financial measures
like cost per case or contribution margin.
The Trauma Audit and Research Network
(TARN) (The Trauma Audit & Research Network
(TARN), n.d.) has one of the largest trauma database
in Europe, receiving data from 80% of trauma centers
across the United Kingdom. TARN measures and
monitors trauma care process and provides local,
regional and national information on trauma patient
outcome. The Major Trauma Dashboard provides
quarterly and ad-hoc reports to the clinicians and also
published population statistics on the epidemiology
of trauma. Jedox (Jedox, n.d.) and Celcus B.V.
(Celcus, n.d.), Netherlands based companies, have
developed a trauma BI application for University
Medical Centre Utrecht’s (UMC Utrecht) (UMC
Utrecht, n.d.) trauma centre. This application
integrates data collection, reporting and analysis
process. Users can enter data manually and the
application validates and transforms the data. The
data is then stored in relational data sources and is
analyzed and visualized by using dashboards and
dynamic reports.
3 METHODOLOGY
The purpose of our proposed framework is to provide
healthcare professionals and decision-makers with
real-time aggregated information on regional trauma
cases, trauma team activations and other trauma-
related information. The primary source of data is the
OLAP cubes maintained by the Provincial Health
Services Authority (PHSA) using the Discharge
Abstract Database (DAD) and the British Columbia
Trauma Registry (BCTR). The BCTR data includes
moderate and severe trauma whereas the DAD cube
HEALTHINF 2020 - 13th International Conference on Health Informatics
24
also includes cases categorized as minor trauma. Both
of these cubes are coupled with a relational database
for comprehensive reporting and regional data entry
through web forms. Microsoft’s BI tool stack
consisting of SQL Server, various business
intelligence components and ASP.net framework has
been used for data integration, reporting and analysis
[14]. A challenge in designing the framework was the
integration of disparate data files from different data
sources. An abstract level interaction diagram of the
interrelated components of the proposed framework
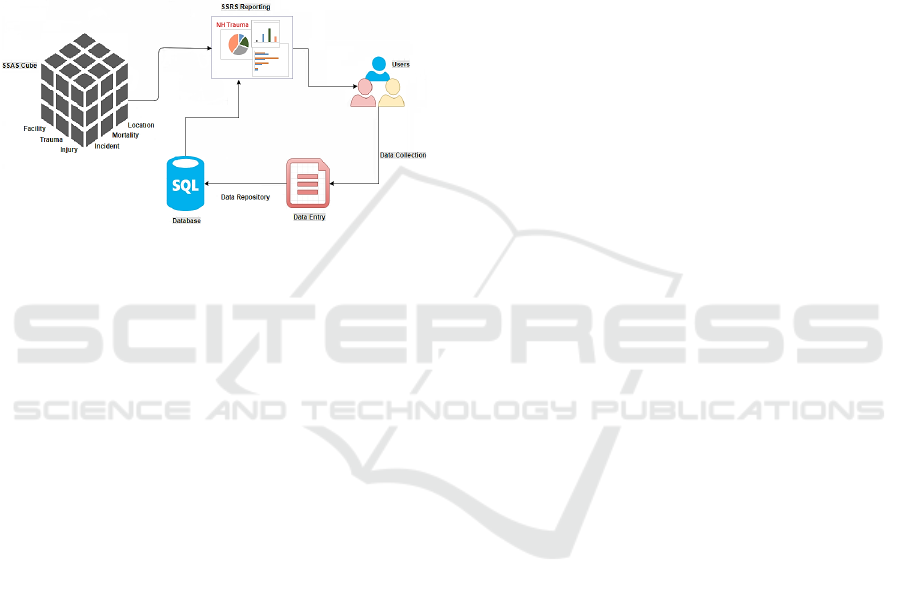
is shown in Figure 1.
Figure 1: Framework Components.
Users interact with the framework through data entry
components and reporting interfaces. The data entry
web forms are accessible from remote sites and can
be used to populate regional information such as
Trauma Team Activations (TTA), ground and air
ambulance services, and staff credentials. This
information is currently outside the scope of OLAP
cubes maintained by PHSA and thus is captured
directly at designated sites. The web interface gives
the user the ability to easily edit, delete and validate
the underlying data. The information entered is stored
in a relational database which is independent of the
OLAP cubes, but integrated in the reporting module.
The relational tables include information such as
mechanism/motivation of injury, admitting services,
methods of transport, mortalities, sites, and trauma
team activations. This database has logical
relationships between tables so that data can be
accessed and re-assembled by the SQL Server
Reporting Services (SSRS) to extract meaningful
information. Likewise, the reporting component
securely connects users to the aggregated information
and drill downs of the underlying data. It renders
different dashboards grouped by specific sets of
reports such as Incidence, Mortality, Transportation,
and TTA. These reports pull information from the
database and cubes to provide a visual representation
of various KPIs in the form of intuitive graphs, pie
charts, tables, and bar/line graphs.
A server-based reporting platform, SQL Server
Reporting Services (SSRS), has been used to create
the reporting dashboard. Besides providing a
visualization platform, SSRS has provision to export
reports to applications such as MS Excel, MS Word,
PDF, etc. In addition, SSRS provides the ability to
create reports with drill through/drill down actions,
expand/collapse toggles, tooltips and report
parameters for interactive navigation. The SSRS
reports can also be filtered, grouped and sorted
according to user’s requirements. Once deployed, the
reports can be viewed by multiple users via a standard
browser through a web-based connection and does
not require any configuration of the client machine.
Users can open data entry web-form and reporting
dashboard in different windows and can use both
components at the same time. Access control is
accomplished through an Active Directory. Data
entry can only be done by designated sites/staff
whereas the reports can be viewed broadly upon
authentication.
4 DATA VISUALIZATION
The reporting module consists of over forty reports
representing data from the sources mentioned earlier.
The top level dashboards display aggregated results
in visually appealing formats and allow intuitive
navigation to finer granularity via drill down and drill
through reports. The framework allows tracking of
several metrics including transportation times, injury
severity, most responsible diagnosis, inter-facility
transfers for higher level of care,
mechanism/motivation of injury, trends, all broken
down by gender, demographics and other specified
parameters. These dashboards not only provide
access to useful information but also enable
administrators to make more informed decisions.
Where applicable, historical data is used to show
trends. The reports are highly optimized and render
within 2-7 seconds.
4.1 Landing Page
The landing page (Figure 2) provides an overview of
the dashboard together with the ability to navigate
through various web pages. The page is divided into
two sections for reporting and data entry. The
reporting section is further divided into three sub-
sections based on the data sources: BCTR, DAD and
Pre Registry Database. As stated earlier, BCTR
reports only include moderate and major trauma cases
A Hybrid Visual Analytics Framework to Evaluate Trauma Incidences and Enhance Patient Care
25
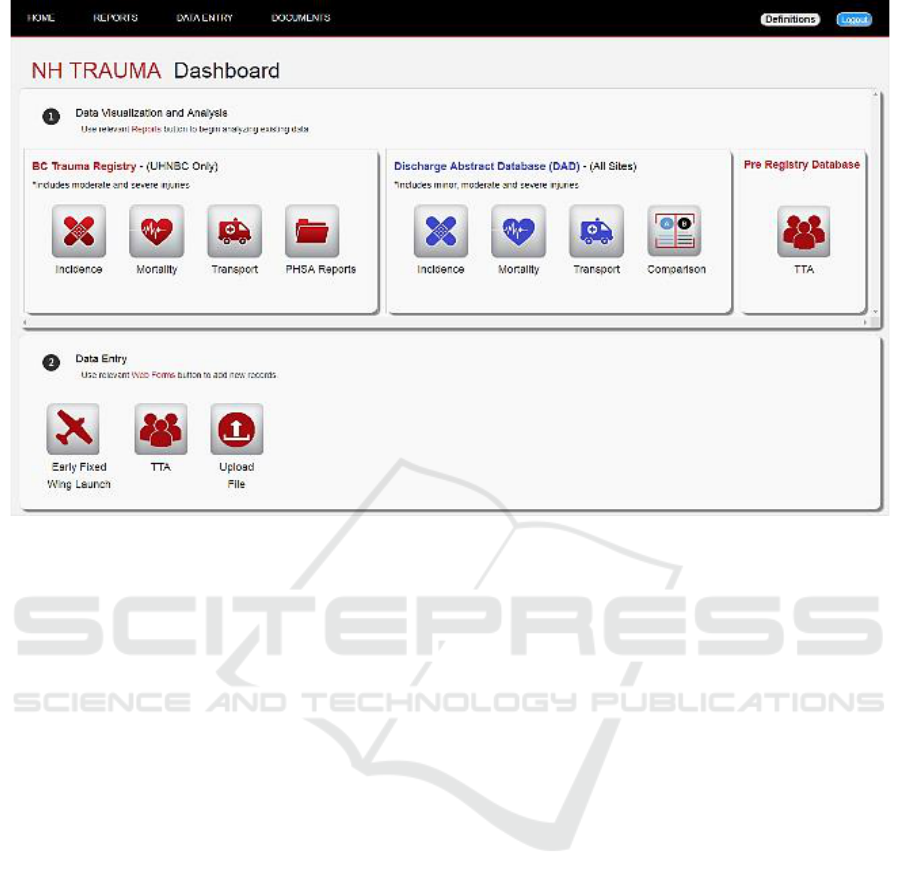
Figure 2: Landing Page
whereas DAD also includes trauma cases which are
categorized as ‘Minor Trauma’. The icons on the
left side navigate to different dashboards representing
the BCTR data (Incidence, Mortality, and Transport).
In addition the PHSA Reports icon allows viewing of
static annual reports which are periodically uploaded
through the data entry section. The next three icons
produce similar reports for the DAD data. In
addition, a Comparison icon allows selection of up to
three facilities for comparison purposes. Finally, the
TTA icon generates a comprehensive report
displaying various metrics related to trauma team
activations. The data entry section presents different
web forms for entering data which is not supplied by
PHSA cubes. This includes Early Fixed Wing
Launch, TTA, and uploading of Annual Reports
compiled by PHSA.
4.2 TTA Web Form
The Trauma Team Activation web form (Figure 3)
provides an interactive mechanism to enter
information/records of all admitted cases where the
trauma team was activated and those where the
admitted patient met TTA criteria, but an activation
did not occur. The data captured includes different
sites, demographics, pre-registry number, emergent
care (TTA Activated, Mechanism of injury,
Motivation of injury, etc.), disposition (Admitting
services, OR arrival time Transferred, etc.) and
outcome information (Length of Stay, ISS, Vital
Status). This web-form is highly interactive with
ability to search data, and enforces data integrity via
validation constraints in real time. Existing records
are displayed in a grid view under the form which
allows easy editing and deletion of records. Any
changes made through the web form are reflected
immediately in the associated reports.
4.3 Incidence (BCTR)
The Incidence dashboard provides a snapshot of
trauma incidence related statistics (Figure 4). The
report header displays the total number of major
trauma cases for the selected fiscal year and facility.
A trend chart shows the number of moderate and
severe trauma incidences over the last five years. The
trauma incidence count is broken down by KPIs such
as age-range, gender, Injury Severity Score (ISS),
motivation/mechanism of injury, risk groups, falls,
and alcohol related injuries. The mechanism of injury
section provides transport and non-transport related,
and work related trauma incidence statistics. These
charts can be further drilled down for information on
the specific KPI at finer granularity. In addition, there
are several buttons on the dashboard which allow
navigation to other drill-down reports. For example,
Figure 5 shows the trend in Emergency Department
HEALTHINF 2020 - 13th International Conference on Health Informatics
26
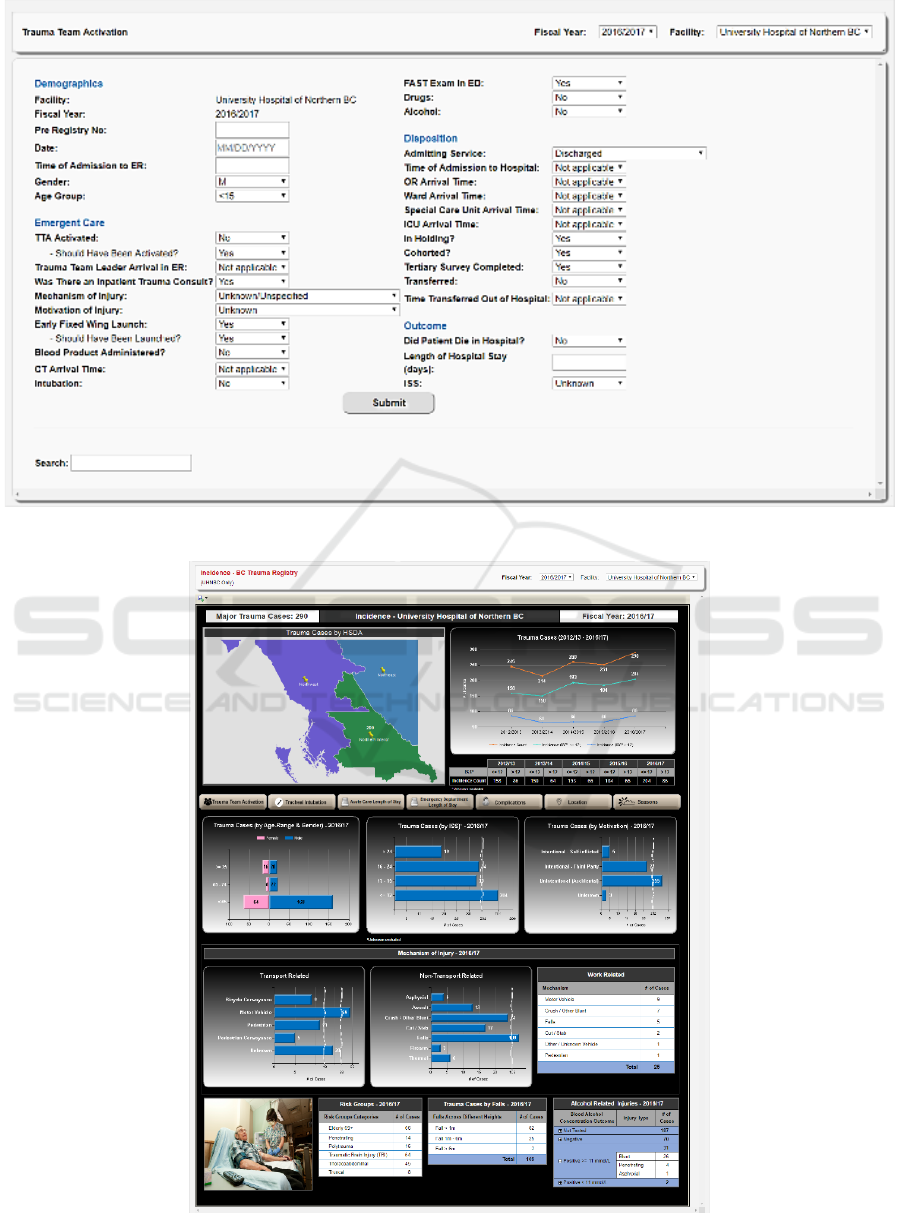
Figure 3: Trauma Team Activation Data Entry Web Form.
Figure 4: Trauma Incidences (BCTR).
A Hybrid Visual Analytics Framework to Evaluate Trauma Incidences and Enhance Patient Care
27
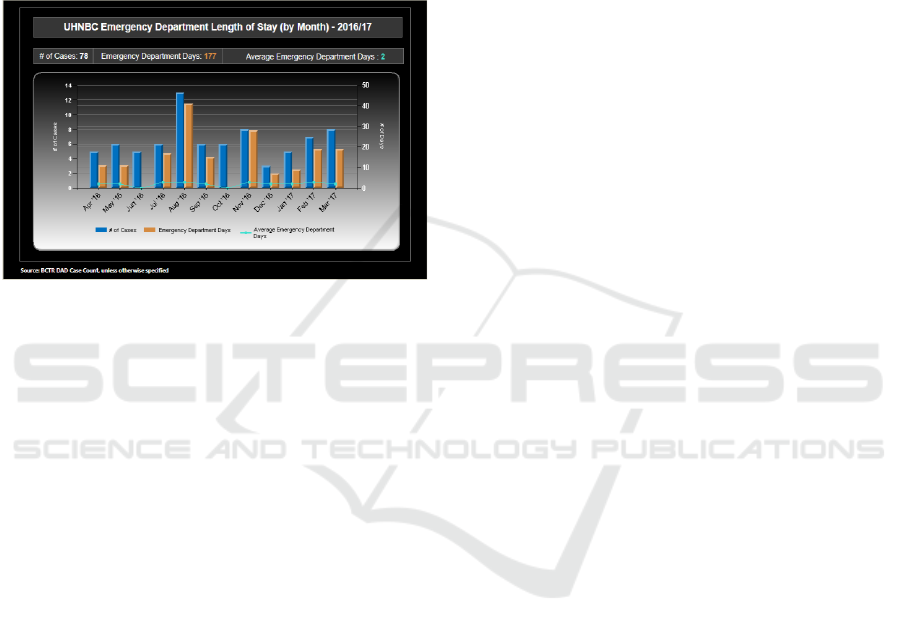
Length of Stay (ED LOS) by months over the selected
fiscal year. The blue bars show the total number of
cases while the orange bars show the total number of
ED LOS days for each month. The monthly trend of
average patient length of stay is also displayed. For
the fiscal year 2016/17, the total number of trauma
cases admitted to the emergency department was 78
with a total of 177 emergency department days. Based
on this, it is observed that a trauma patient spends on
average two days in ED.
Figure 5: Length of Stay drill-down.
4.4 Mortality (BCTR)
The mortality report (Figure 6) uses BCTR data to
report on the number of trauma related deaths by
facility and fiscal year. A breakdown of this number
by regions or local health authorities is shown on an
interactive map. The mortality trend chart shows the
number of deaths that occurred in the last five years
with respect to the total trauma incidence count and
severity level of the injury. Additional indicators
displayed on the dashboard allow the user to view
other parameters related to trauma mortality. For
instance, the numbers are broken down by gender and
age-group which illustrates that more male trauma
patients died than female in the selected year.
The monthly bar graph shows that more deaths
were reported in November and December in
comparison to other months. The mortality by
location pie chart shows that three deaths occurred in
the Intensive Care Unit (ICU), two in the Nursing
Unit and one in the Operating Room. Clicking on this
pie chart renders a detailed drill down that displays
the location of the deaths by ISS level. Similarly, the
other charts (tables, graphs) explain various trends
and changes in mortality rates by falls grouped by
four main ISS levels. The three tables at the end of
the report allow the user to easily identify the
mechanisms, types and motivations of injury that
contribute to the patients’ deaths.
4.5 Transport (BCTR)
Transportation times are a key factor in the outcome
from a traumatic injury. The ultimate goal is to
identify bottlenecks and minimize transfer times.
Figure 7 shows the average time it took for a trauma
patient to arrive at a definitive care facility either from
scene of injury, or as a transfer. The transfer times are
also shown by the injury severity level. For instance,
it can be seen that all severe trauma patients (ISS>12)
arrived at the definitive care facility within four
hours. A breakdown of the number of cases
transported from scene and/or first facility to
definitive care is an important metric to analyze
patient’s journey and identify bottlenecks, if any.
These charts also show the distribution of patient
transport modes such as land ambulance, private
transport, and fixed-wing or helicopter ambulance.
The trend line shows the average time to definitive
care for the previous five years which allows one to
assess the impact of resource allocation, if any.
Drill-down reports provide a monthly breakdown of
this information. Often, patients are transferred to
facilities where a higher level of care can be provided.
This information is also displayed on the dashboard.
In cases where such transfer occurs directly from
scene, a report on regional transfers provides relevant
information for the selected facility. Finally, the
dashboard also allows drilling down to another KPI
which shows the number of cases that required a
higher level of care by different risk groups (i.e.
penetrating, truncal, elderly, and polytrauma).
A similar set of reports is also available for the
Discharge Abstract Database (DAD). In addition to
the metrics defined earlier, this cube also contains
data for minor trauma and provides a finer granularity
comprising of all locations whether or not those are
designated as trauma care facilities. Thus, the number
of cases in BCTR is a subset of those included in the
DAD cube. However, the ISS scores are not captured
in the latter.
HEALTHINF 2020 - 13th International Conference on Health Informatics
28
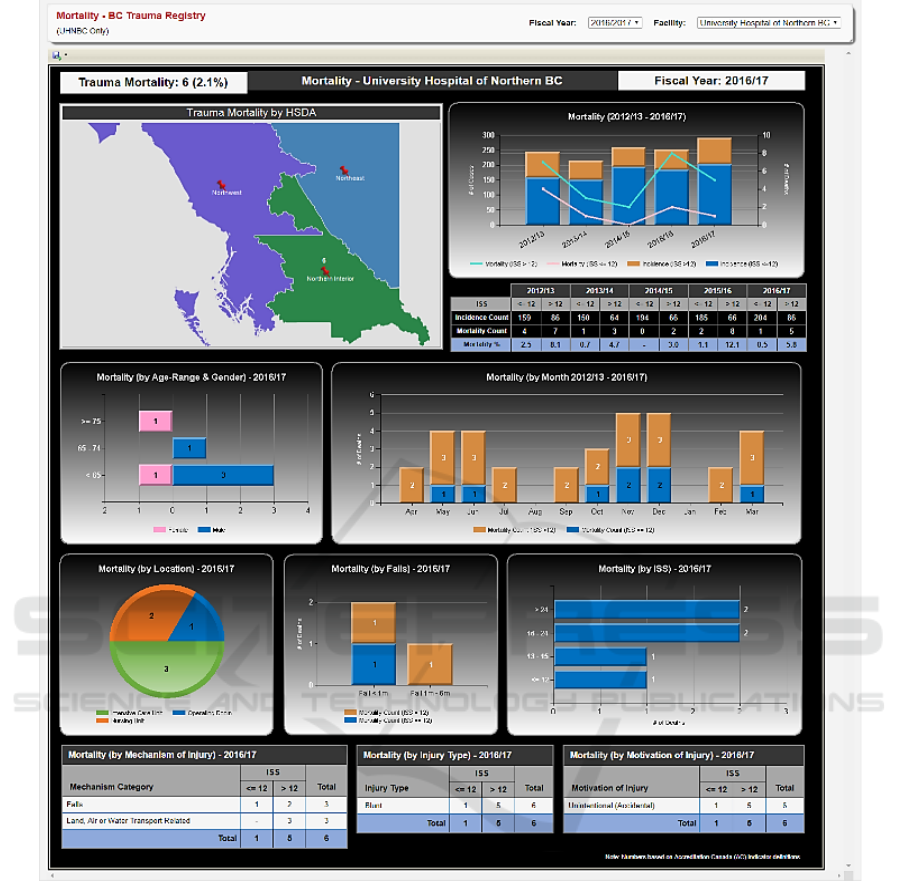
Figure 6: Trauma Mortality (BCTR).
A Hybrid Visual Analytics Framework to Evaluate Trauma Incidences and Enhance Patient Care
29
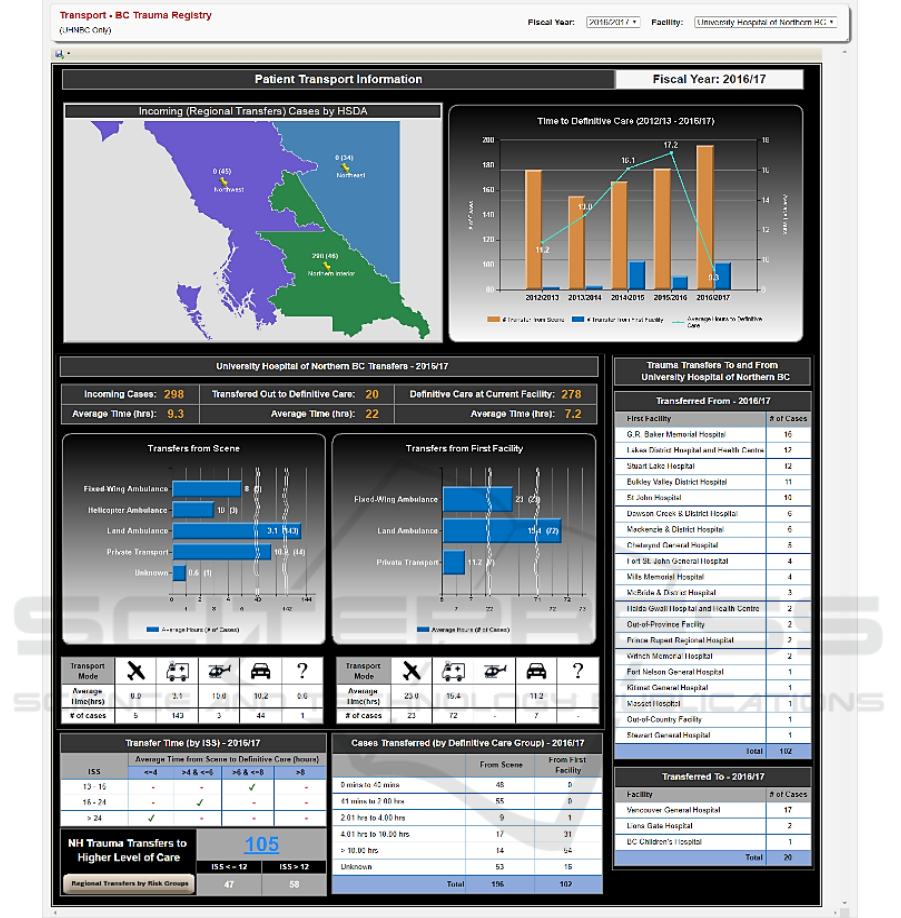
Figure 7: Transport Report.
4.6 Comparison
Trauma statistics at facilities which are similar in size
and resources can be compared to obtain useful
information. This is accomplished by a comparison
report (Figure 8) which allows selection of up to three
facilities for side-by-side comparison. The top section
of this report provides a comparison of general
trauma statistics such as incidence, mortality count,
mortality percentage, complications, comorbidities,
and age range. The trauma statistics section provides
a more comparison of other metrics such as injury
type and motivation/mechanism of injury. The
transfers section of the report shows the discharged
and transferred cases by mode of transport for each of
the selected facilities. With the ability to compare
facilities side-by-side, executives/users have the
ability to determine how incidences and mortalities
differ across similar facilities.
HEALTHINF 2020 - 13th International Conference on Health Informatics
30
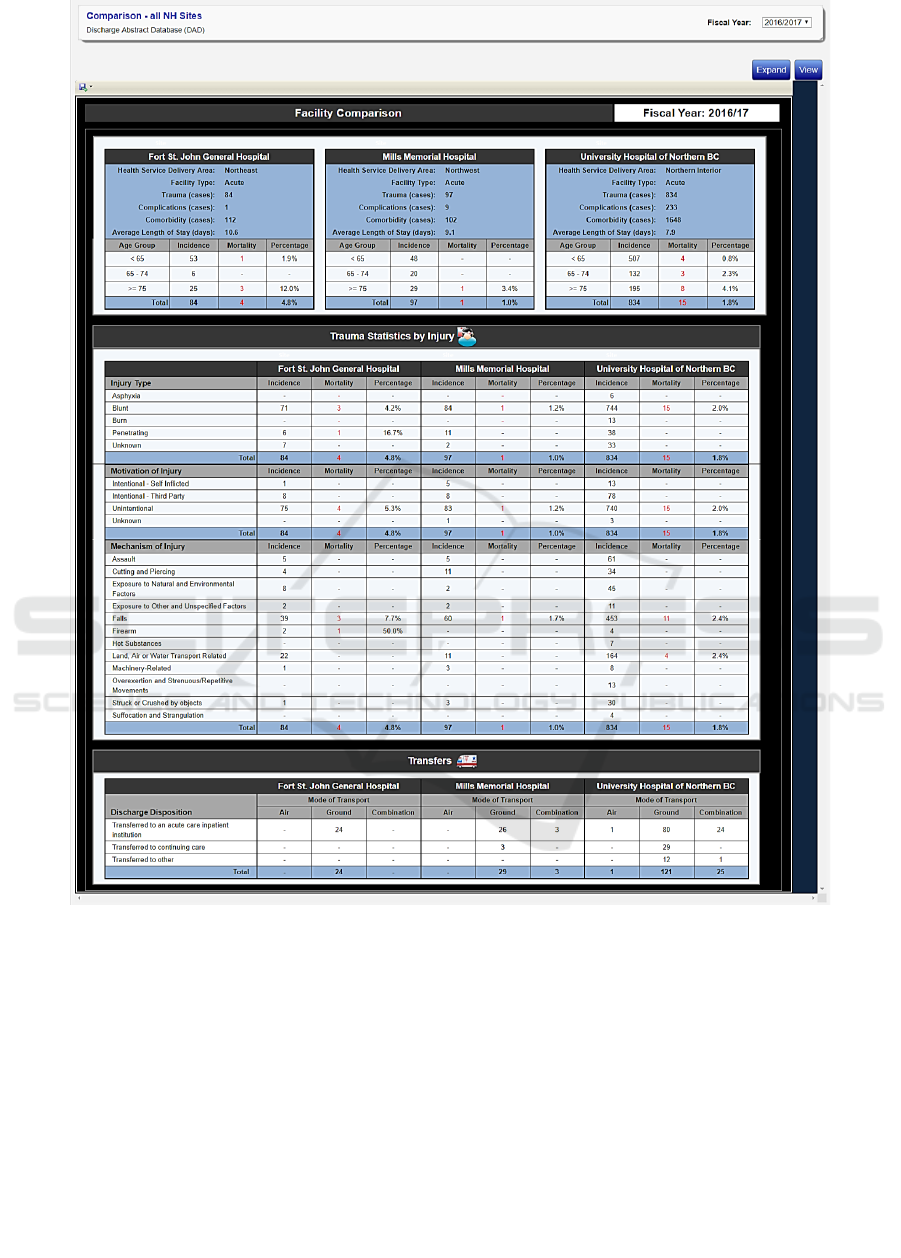
Figure 8: Facilities Comparison.
4.7 TTA
Trauma Team Activation (TTA) is the pre-hospital
notification by Emergency Medical Services (EMS)
based on scene triage criteria that is provided to the
emergency department. This ensures that the trauma
team is immediately available upon patient arrival to
address the clinical needs of seriously injured
patients. This information is entered through web
forms and can be simultaneously seen in the reporting
module. The report header displays the total number
of trauma team activations (split by gender) for the
selected fiscal year and facility (Figure 9). An
aggregated overview of the data entered is displayed
in top portion of this report. Some of the key statistics
include inpatient trauma consults, number of TTAs
cohorted, number of early fixed wing launches,
average length of stay and peak periods of arrival.
Average times and total number of cases for various
departments (CT, Hospital, OR, Ward, SCU and ICU)
are also presented.
The report further groups the TTA cases by ISS,
month, age range, motivation/mechanism of injury,
admitting services, mode of transport and transfers.
For instance, Figure 8 shows a total of 91 TTAs, out
of which 6 died in ER, ICU and Ward. For 2017/18,
A Hybrid Visual Analytics Framework to Evaluate Trauma Incidences and Enhance Patient Care
31
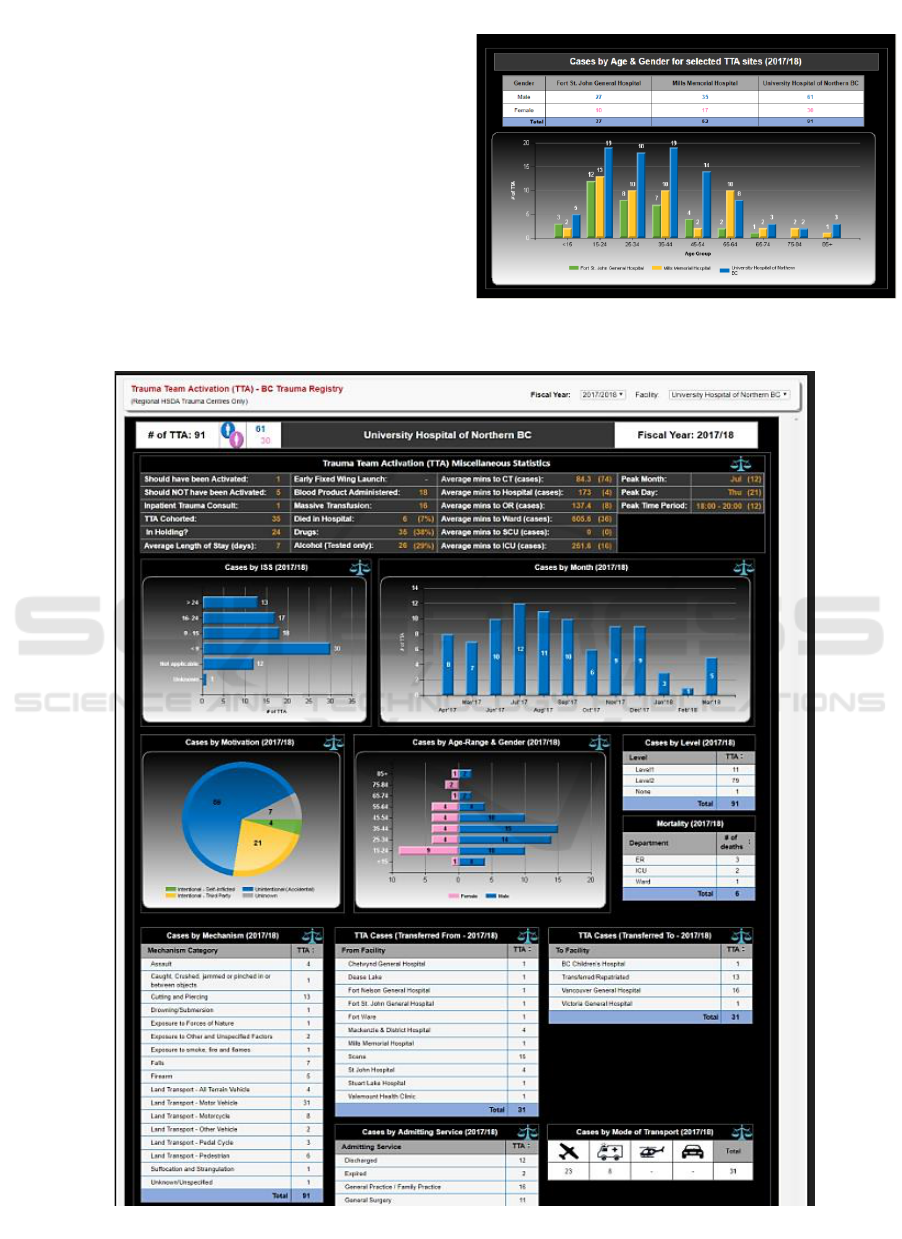
July was the peak month with twelve trauma team
activations. Additionally, the highest number of TTA
injuries had a reported Injury Severity Score (ISS)
less than 9. A total of 31 cases were transferred into
UHNBC, out of which 15 arrived directly from the
incidence scene. The highest number of cases were
transferred out to Vancouver General Hospital.
Each chart in the TTA report can be further drilled
down to compare the TTA data of the selected
Facility with other Trauma sites. Figure 10 is an
example of the drill down from “Cases by Age-Range
& Gender” chart. The drill down report shows a
higher number of overall TTA cases for males when
compared to females. Across all three TTA sites, the
highest number of cases are recorded for the age-
rnge 15-24, followed by 25-34 and 35-44.
Figure 10: TTA Cases by Age and Gender.
Figure 9: Trauma Team Activations (TTA).
HEALTHINF 2020 - 13th International Conference on Health Informatics
32

5 CONCLUSION
A large amount of data related to trauma incidences
has been residing in multiple repositories in legacy
formats. A multi-dimensional OLAP cube was built
by PHSA, but the data still remained in a format
which could not be used for decision making. We
have proposed a framework which allows
visualization of this data along several KPIs. The
dashboard provides a platform which can be easily
navigated to reports at finer granularity. The reports
are grouped on the basis of incidences, mortality,
transportation and trauma levels, and are tightly
coupled with web forms which capture data not
included in the OLAP cubes. This creates a hybrid
environment where data is extracted from both cubes
and relational databases in a transparent manner.
Simultaneous users can access the interface through
standard web browsers while access control is
implemented using Active Directory.
The interactive platform allows decision makers
to view trends, bottlenecks and performance along
multiple dimensions to identify areas which can result
in improved trauma care. The platform is extendable
to seamlessly include other health service delivery
areas and add other metrics of interest.
ACKNOWLEDGEMENTS
This work was supported by the research
collaborative grant RC15-3180 received from
Northern Health British Columbia, Canada. Other
students who contributed to this work include Devin
Calado, Giridhar Krishnan, Helal Lutfi and Lila
Mansour.
REFERENCES
Ali -Özkan, O., Crvenkovski, P., & Johnson, H. (2016).
Using a business intelligence data analytics solution in
healthcare. IEEE 7
th
Annual Information Technology,
Electronics and Mobile Communication Conference
(IEMCON), (pp.1-6) doi:10.1109/IEMCON.2016.77463
28
Bureau of Emergency Medical Services & Preparedness,
Utah Department of Health. (2015). Traumatic Injury
Outcomes in Utah's Trauma System, 2001-2013. Salt
Lake City: Division of Family Health and Pre-paredness.
Retrieved 09 10, 2018, from https://bem sp.utah.gov/wp-
content/uploads/sites/34/2016/05/utr_2013.pdf
Celcus. (n.d.). Retrieved September 3, 2018, from
http://www.celcus.nl/en
Fojut, R. (2016, February 22). Trauma System News.
Retrieved August 9, 2018, from http://www.trauma-
news.com/2016/02/how-a-trauma-system-uses-
business-intelligence-to-evaluate-protocols-track-
costs-monitor-quality-optimize-billing-and-more/
Foshay, N., & Kuziemsky, C. (2014). Towards an
implementation framework for business intelligence in
healthcare. International Journal of Information
Management, 34(1), 20-27.
Institute for Health Metrics and Evaluation (IHME). (n.d.).
GBD Data. Retrieved September 3, 2018, from
http://www.healthdata.org/gbd/data
Jedox. (n.d.). Retrieved September 3, 2018, from https://
www.jedox.com/en/
Microsoft. (n.d.). Retrieved June 29, 2018, from https://ww
w.microsoft.com/en-us/sql-server/business-intelligence
Microsoft. (n.d.). What Are Measures and Dimensions?
Retrieved July 1, 2018, from https://docs.micro
soft.com/en-us/biztalk/core/what-are-measures-and-
dimensions
Provincial Health Services Authority. (n.d.). Trauma
Services BC. Retrieved July 18, 2018, from http://www
.phsa.ca/our-services/programs-services/trauma-servic
es-bc
The Trauma Audit & Research Network (TARN). (n.d.).
Retrieved July 15, 2018, from https://www.tarn.ac.uk/
UMC Utrecht. (n.d.). Retrieved July 15, 2018, from
https://www.umcutrecht.nl/en/1
University of Utah. (n.d.). Trauma Audit Dashboard.
Retrieved August 3, 2018, from http://www.utahtr
auma.org/registryMembers/documents/TraumaAuditD
ashboardUserManual.pdf
World Health Organization (WHO). (n.d.). Global Health
Observatory. Retrieved September 3, 2018
A Hybrid Visual Analytics Framework to Evaluate Trauma Incidences and Enhance Patient Care
33
