
Source-based Multifractal Detrended Fluctuation Analysis for
Discrimination of ADHD Children in a Time Reproduction Paradigm
Shiva Khoshnoud
1,3
, Mohammad Ali Nazari
2
and Mousa Shamsi
3
1
Institute for Frontier Areas of Psychology and Mental Health, Freiburg, Germany
2
Faculty of Advanced Technologies in Medicine, Iran University of Medical Sciences, Tehran, Iran
3
Biomedical Engineering Faculty, Sahand University of Technology, Tabriz, Iran
Keywords: Multifractal Detrended Fluctuation Analysis, ADHD, Time Perception, EEG.
Abstract: Electroencephalography recordings have a scale-invariant structure and multifractal detrended fluctuation
analysis (MF-DFA) could quantify the fluctuation dynamics of these recordings in different brain states.
However, the channel-based electrical activity of the brain has low spatial resolution and considering the
source-level activity patterns is a good answer for this restriction. In this work, the multifractal spectrum
parameters of the channel-based EEG, as well as the corresponding source-based independent components
in children with Attention Deficit Hyperactivity Disorder (ADHD) and the age-matched control group, has
been investigated. Considering the perceptual timing deficit in children with ADHD, for the analysis of the
multifractality, two brain states including the eyes-open rest and the time reproduction condition have been
considered. The results obtained showed that switching from rest to the time reproduction condition
increases the degree of multifractality and so the complexity and non-uniformity of the signal. While the
channel-based multifractal properties could not significantly distinguish two groups, the results for the
source-based multifractal analysis showed a significantly decreased degree of multifractality for children
with ADHD in prefrontal, mid-frontal and right frontal source clusters suggesting reduced activation of
these clusters in this group. Utilizing support vector machine (SVM) classifier it is found that, the source-
based multifractal features provide a significantly higher accuracy rate of 86.67% in comparison to the
channel-based measures.
1 INTRODUCTION
Electroencephalography (EEG) recordings as a
nonstationary time series possess a scale-invariant
structure which indicates that signal repeats its
structure on different sub-intervals (Eke, Herman,
Kocsis, & Kozak, 2002; Ihlen, 2012; Zorick &
Mandelkern, 2013). Time series with a complex
structure like EEG are multifractal and the
multifractal detrended fluctuation analysis (MF-
DFA) has been proposed for evaluation of their
fractal properties (Kantelhardt et al., 2002). Several
reports suggest that changes in the scale-invariant
structure of the biomedical signals reflect changes in
the adaptability of physiological processes and
successful treatment of pathological conditions
might changes the fractal structure and improve
health (Goldberger et al., 2002). Multifractal
properties of the sleep stage EEG signals have been
assessed in several studies representing that these
measures
correlated with the sleep depth, exhibiting
different values for deeper sleep stages (Ma, Ning,
Wang, & Bian, 2006; Weiss, Clemens, Bódizs, &
Halász, 2011; Weiss, Clemens, Bódizs, Vágó, &
Halász, 2009; Zorick & Mandelkern, 2013). Zorick
& Mandelkern (2013) revealed that even short EEG
tracings represent significant dissimilarities in the
width of the multifractal spectrum for the different
sleep stages. Assessing the height of the multifractal
spectrum, Weiss et al. (2011, 2009) indicated that
EEG signals tend to be less multifractal during
NREM4 compared to NREM2 and REM sleep
stages. Moreover, the predictive power of
multifractal parameters in epilepsy research was also
examined in order to detect and predict focal
seizures (Dick & Svyatogor, 2012; Dutta, Ghosh,
Samanta, & Dey, 2014; Easwaramoorthy &
Uthayakumar, 2010; Figliola, Serrano, & Rosso,
2007). Fractal parameters have also been utilized to
study the scaling behavior of the fluctuations of the
EEG while listening to musical stimuli (Maity et al.,
2015; Natarajan, Acharya U, Alias, Tiboleng, &
38
Khoshnoud, S., Nazari, M. and Shamsi, M.
Source-based Multifractal Detrended Fluctuation Analysis for Discrimination of ADHD Children in a Time Reproduction Paradigm.
DOI: 10.5220/0008876700380048
In Proceedings of the 13th International Joint Conference on Biomedical Engineering Systems and Technologies (BIOSTEC 2020) - Volume 4: BIOSIGNALS, pages 38-48
ISBN: 978-989-758-398-8; ISSN: 2184-4305
Copyright
c
2022 by SCITEPRESS – Science and Technology Publications, Lda. All rights reserved

Puthusserypady, 2004). Despite this consistent
evidence for the brain-state related adaptability of
the multifractal structure, a few studies have been
conducted in the area of neurodevelopmental
disorders. Attention-deficit hyperactivity disorder
(ADHD) is a common neurodevelopmental disorder
in school-aged children which exhibit varying levels
of hyperactivity, inattention, and impulsivity, and
substantially affect their cognitive performance
(American Psychiatric Association, 2013; Sadock &
Sadock, 2011).
In our previous study, the multifractal spectrum
alterations of the resting-state EEG in children with
ADHD have been identified (Khoshnoud, Nazari, &
Shamsi, 2018). More precisely, during rest
condition, over frontal and right parietal scalp
channels, the multifractal spectrum was higher in
children with ADHD compared to the age-matched
control group. This elevated multifractal structure
suggests more complex EEG patterns in children
with ADHD compared to the healthy subjects during
rest. Considering this outcome, an investigation of
the multifractal structure of the EEG signals during
different paradigms in this group would have a great
impact on understanding their disorder. Several
studies have demonstrated that children with ADHD
have deficits in perceptual timing (Barkley, 1997;
Barkley, Edwards, Laneri, Fletcher, & Metevia,
2001; Barkley, Koplowitz, Anderson, & McMurray,
1997; Noreika, Falter, & Rubia, 2013; Rubia, Halari,
Christakou, & Taylor, 2009; Toplak & Tannock,
2005; Toplak, Dockstader, & Tannock, 2006).
Taking into account the different cortical activity
patterns of these children during time reproduction
(Khoshnoud, Shamsi, Nazari, & Makeig, 2017), one
could expect to see distinct multifractal structures
for these cortical sources during the time
reproduction condition.
To address this issue, we conducted an EEG
study in children with ADHD and age-matched
control subjects during two EEG recording sessions:
eye-open rest and time reproduction condition. We
used both the channel-based and the source-based
multifractal spectrum analysis in order to visualize
distinguished patterns of activity in both groups.
Finally, two groups were classified based on these
distinct multifractal patterns utilizing a support
vector machine (SVM) classifier. Our main
hypothesis was that children with ADHD would
exhibit distinct multifractal structure during both
EEG recording sessions and this pattern would be
more distinguishable in the source-based level
analysis.
2 MATERIALS AND METHODS
2.1 Participants and the Experimental
Design
The EEG data used here is the authors’ previously
recorded dataset consisting of EEG time series of 15
ADHD and 19 controls, 7-11 years of age in the
eyes-open rest and time reproduction conditions.
Details about the diagnosis criteria and inclusion
procedures could be found in Khoshnoud et al.
(2017). EEG recording starts with the eyes-open
resting period for 3 min followed by a visual time
reproduction task for approximately 10 min. In each
trial, following a trial start cue, a target white disk is
displayed on the screen center indicating the start of
a target interval of 1000 or 2200 ms (short and long
encoding phase). Participants are requested to keep
this interval in mind and reproduce it after a waiting
period of 1500 ms as indicated by a red disk
displayed at the screen center.
2.2 Data Processing
EEG data collection was accomplished using the
Mitsar® amplifier with 21 channels and WinEEG®
software. The reference electrodes were linked ear
lobes, with the ground electrode placed on AFZ. The
sampling frequency was 250 Hz. For this study, we
were particularly interested in the MF-DFA analysis
of the channel-based EEG signals as well as the
source-based components of the signals during both
recording sessions. Therefore each analysis was
followed by a specific processing procedure. The
EEG data were processed using EEGLAB functions
(version 13) (Delorme & Makeig, 2004) running on
Matlab (MATLAB2013a, The Mathworks, Inc.).
At first, the raw EEG signals were high-pass
filtered above 1 Hz and were low-pass filtered below
50 Hz using a windowed FIR sync filter to remove
line noise and other artifacts. After re-referencing to
a common average reference, the EEG time series
were visually inspected to reject periods with
abnormally high artifact levels. After this general
pre-processing step, the channel-based study was
continued with the MF-DFA analysis (section 2.3).
For the source-based study, additional processing
steps have been performed. The schematic overview
of these steps has been illustrated in Figure 1. At
first, the raw EEG signals were high-pass filtered
above 1 Hz and were low-pass filtered below 50 Hz
using a windowed FIR sync filter to remove line
noise and other artifacts.
Source-based Multifractal Detrended Fluctuation Analysis for Discrimination of ADHD Children in a Time Reproduction Paradigm
39
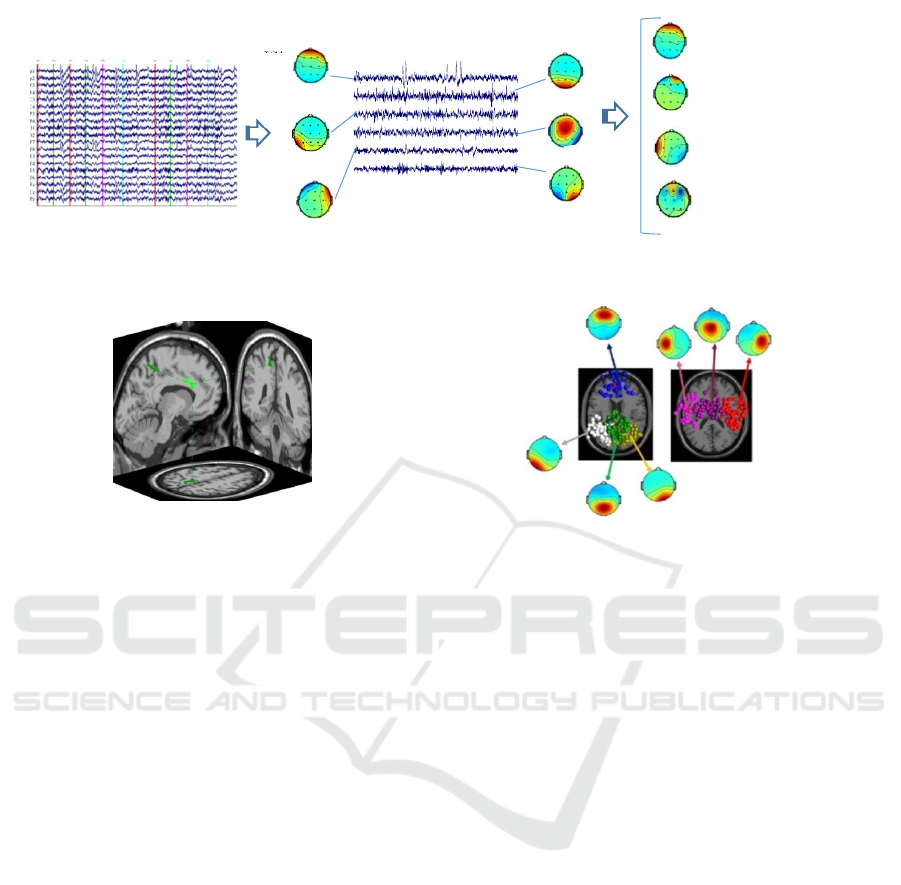
Figure 1: Overview of the EEG data processing steps for the source-based MF-DFA analysis after pre-processing of the
data. 1) Single-subject EEG data are decomposed by AMICA into a set of ICs and then nonbrain ICs are identified and
removed from further processing. 2) Equivalent current dipole positions for resumed ICs are estimated. 3) Based on the
dipole position and mean log spectra, the ICs are clustered across subjects into 7 clusters.
After re-referencing to a common average reference,
the EEG time series were visually inspected to reject
periods with abnormally high artifact levels. After
this general pre-processing step, the channel-based
study was continued with the MF-DFA analysis
(section 2.3). For the source-based study, additional
processing steps have been performed. The
schematic overview of these steps has been
illustrated in Figure 1.
ICA Decomposition- In order to decompose the
pre-processed EEG data to a corresponding set of
statistically independent source components, the
Adaptive Mixture Independent Component Analysis
(AMICA) algorithm (Palmer, Kreutz-Delgado, &
Makeig, 2006, 2011; Palmer, Makeig, Kreutz-
Delgado, & Rao, 2008) was used. AMICA has been
shown to have superior performance among blind
source separation algorithms for EEG decomposition
(Delorme, Palmer, Onton, Oostenveld, & Makeig,
2012). After identifying and removing the eye and
muscle activity-related components based on their
spectra, scalp maps, and time courses, the brain-
related independent components (ICs) were
selectedfor further analysis (Makeig et al., 2002).
Equivalent Current Dipole Position Estimation-
Subsequently, equivalent source distribution of the
brain-related ICs were computed using the DIPFIT
toolbox within EEGLAB
(http://sccn.ucsd.edu/wiki/A08:_DIPFIT). Scalp
electrode positions were co-registered to an MNI
template brain (Montreal Neurological Institute,
MNI, and Quebec) using nonlinear warping. Then, a
best-fitting equivalent current dipole was matched to
each IC using a template three-shell boundary
element method (BEM) head model based on the
MNI brain template. ICs with the equivalent dipole
model located within the brain which explained
more than 90% of the variance of the IC scalp map
were retained for further analysis.
IC Clustering- ICs across subjects were classified
based on similarities in IC dipole locations and mean
log spectra using K-means algorithm and totally
seven clusters were computed (Makeig et al., 2002;
Onton & Makeig, 2006). ICs whose distance to any
cluster centroid was more than three standard
deviations from the cluster mean distance were
considered outliers.
⋮
IC3
IC1
IC2
IC4
IC5
IC6
Vertical eye movements
Horizontal eye movements
Muscle activity
Noise
3. Clustering ICs based on dipole location and
mean-log spectra
2. Equivalent current dipole position
estimation
1. ICA decomposition and non-brain IC rejection
BIOSIGNALS 2020 - 13th International Conference on Bio-inspired Systems and Signal Processing
40

2.3 Multi-fractal Detrended
Fluctuation Analysis
There are two distinct types of multifractality in time
series: multifractality due to a broad probability
density function and multifractality due to long-
range correlations of the small and large fluctuations
in time series. While the former cannot be removed
by shuffling the data, the corresponding shuffled
series of the latter one will exhibit no- or weaker
multifractality scaling behavior (Kantelhardt et al.,
2002). The complete procedure for Mf-DFA is
divided into the following steps:
Step 1: The noise-like structure of the time series
with length N was converted into a random walk:
, 1,…,
(1
)
Step 2: The integrated time series are divided into
number of non-overlapping segments with equal
lengths s as follows:
(2
)
Step 3: For each segment, the root mean square
(RMS) variance is calculated by Equation (3), in
which
1,...,2
and
is the fitting
polynomial in segment ν:
,≡
1
(3
)
Step 4: Subsequently, to obtain the qth-order
fluctuation function, the mean RMS value over all
segments is calculated:
≡
1
2
,
/
/
(4
)
Step 5: Because of spatial and temporal variations in
the scale-invariant structure of the multifractal time
series, the procedure is repeated for several time
scales (s). Finally, the scaling behavior of the
fluctuation functions is determined by analyzing the
log-log plots of
versus s for each value of q:
(5)
The q-order Hurst exponent is related to the scaling
exponents
by Equation (6):
1
(6)
Thereafter, scaling exponents could be converted
into the q-order singularity exponent (α) and the q-
order singularity dimension () by the following
equations to obtain the multifractal singularity
spectrum:
′
and
(7
)
The width and shape of the multifractal spectrum
are valuable factors for distinguishing different
multifractal structures. In this study, we used the
width (maxmin) and the height of the
spectrum (
) as well
as mean (α) and mean to evaluate the
multifractal spectrum.
2.4 Classification
The distinguishability of the extracted fractal
features was examined using a support vector
machine algorithm. The aim of the SVM is to
compute an optimal separating hyperplane to which
the distance from each nearest data sample in each
class is maximized (Vapnik & Lerner, 1963). SVM
offers a solution for non-separable cases, using
kernel mapping with projecting the data into a
higher-dimensional feature space using a nonlinear
function (ϕ(·)). Given a weight vector W and a bias
term b, the formulation of the hyperplane is as
follows:
.0
(8
)
To find such an optimum hyperplane, the
optimization problem is as follows:
1
2
‖
‖
1
(9
)
The above-mentioned problem is solved using the
Lagrangian optimization theory. Here, we tested
linear, polynomial and RBF kernel functions and
RBF kernel led to a better discrimination accuracy.
Source-based Multifractal Detrended Fluctuation Analysis for Discrimination of ADHD Children in a Time Reproduction Paradigm
41
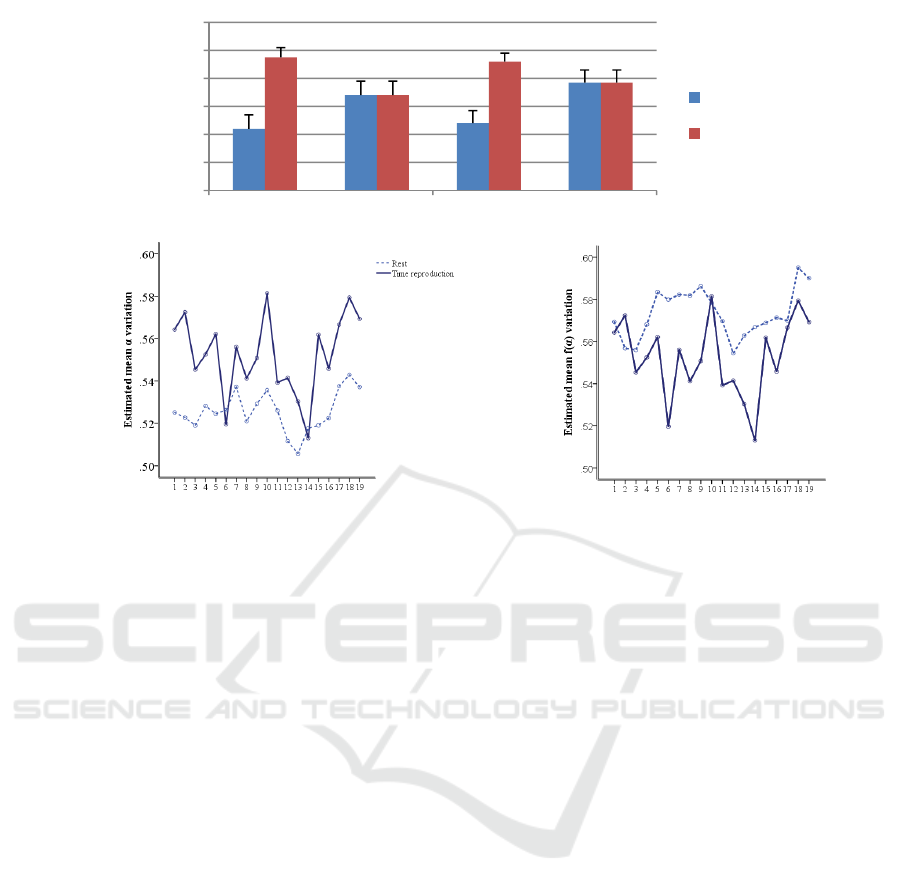
Figure 2: a) Average values of the width (d) and height () of the channel-based multifractal spectrum in children
with ADHD and age-matched controls during rest (R) and time reproduction (Tp). b) Mean d for all scalp electrodes
during rest and time reproduction. c) Mean for all scalp electrodes during rest and time reproduction.
3 RESULTS
3.1 Group Differences in the
Channel-based MF-DFA
As mentioned in the previous section, the EEG time
series have multifractal structures that contain both
types of multifractality. The important intellectual
question here is how this multifractality changes
through different brain states. In order to assess
variations in the degree of multifractality in
transition from the rest to time reproduction, average
MF spectra for each EEG signal in both conditions
(rest and time reproduction) were computed. A
comparison of the multifractal structures in the two
brain states was made by evaluating four features
extracted from MF spectra in each time series for all
subjects. These features are as follows: the width
(dα) and the height ( ) of the spectrum, mean
q-order singularity exponent (mean_
), and mean
q-order singularity dimension (mean_
).
Repeated measures analysis of variance (ANOVA)
was conducted separately on each feature with the
condition (rest vs. time reproduction) and electrode
positions as the within-subject factors and group
(ADHD vs. control) as the between-subject factor.
For the width and the height features, ANOVA
revealed a significant main effect of condition [(F (1,
32) = 9.15; p= .005), (F (1, 32) = 8.45; p =.007)],
demonstrating that for both groups, the shape of the
multifractal spectrum in the two conditions differ
significantly. In transition from the rest to time
reproduction, the width increased and the height
decreased. Figure 2 (a) shows the averaged values of
these two extracted features along with the standard
deviations of them in each condition for both groups.
Also, the electrode × condition interaction effect was
significant. Figure 2(b) and 2(c) demonstrate the
significant rise in the width and significant decline
in the height of the multifractal spectrum during
time reproduction in most of the scalp electrodes.
For mean_
, there was a significant effect of
condition (F (1, 32) = 8.52; p = .006) showing lower
values for time reproduction than rest state (Figure
3(a)). The effect of the group just for the mean_
was near significant (F (1, 32) = 8.45; p =0.07) with
controls showing higher values than ADHD subjects
regardless of the paradigm (Figure 3(b) and 3(c)).
This lower mean q-order singularity exponent value
in individuals with ADHD shows that the degree of
multifractality in signals of this group is marginally
lower than control subjects.
0.48
0.5
0.52
0.54
0.56
0.58
0.6
R_ADHD Tp_ADHD R_Control Tp_Control
dα
df(α)
(c)
(b)
(a)
BIOSIGNALS 2020 - 13th International Conference on Bio-inspired Systems and Signal Processing
42
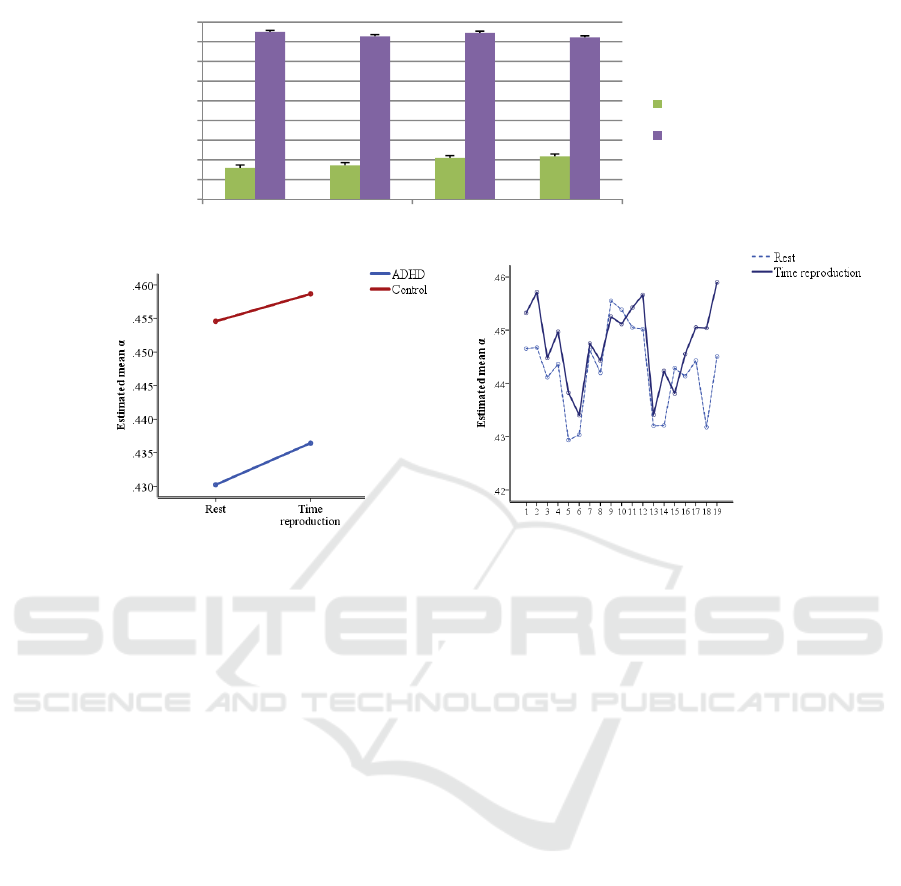
Figure 3: a) Average values of the q-order singularity exponent (mean_) and q-order singularity dimension (mean_)
of the channel-based multifractal spectrum in children with ADHD and age-matched controls during rest (R) and time
reproduction (Tp). b) Mean_ for children with ADHD and control in transition from rest to time reproduction. c) Mean_
for all scalp electrodes during rest and time reproduction.
3.2 Group Differences in the
Source-based MF-DFA
The channel-based multifractal features showed
significant alterations between two conditions, failed
to clearly distinguish two groups. Concerning better
spatial resolution of the source-based analysis, one
could expect to see a more significant trend in the
source components. However, unlike scalp channels,
a pair of independent components from two subjects
might resemble or differ from each other in many
ways. Even with one subject in a different paradigm,
the results could be different as each paradigm leads
to specific source components. Therefore making
direct comparisons about the transition from rest to
the time reproduction for ICs would not be logical.
Notwithstanding, it is possible to assess ICs’
multifractal properties for two groups during one
paradigm. To achieve this, the multifractal spectrum
of 349 ICs from 34 subjects in 7 clusters were
calculated and averaged for each group and each
cluster. Figure 4(a) represents the clusters including
two occipital, one occipital-temporal, three frontal,
and one prefrontal cluster. The averaged multifractal
spectrums of each cluster for both groups during the
encoding phase of the time reproduction task has
been shown in figure 4(b). According to the figure
4(b), in the prefrontal, mid-frontal and right frontal
clusters, the multifractal spectrum of subjects with
ADHD in both durations exhibited a leftward shift
reflecting a lower degree of multifractality for these
individuals in these clusters. Similar to the previous
section, for the purpose of statistical analysis four
features of these spectrums (dα,
,mean_
, and
mean_
) were assessed utilizing independent t-
test. The results showed that mean_
for the
prefrontal, mid-frontal and right frontal source
clusters in the ADHD group were significantly lower
than that of the control group for both durations (p-
values < 0.02). Moreover, mean_
for the right
occipital cluster in individuals with ADHD was
significantly higher than that for control subjects (p-
value < 0.019). Multifractal spectrum width in the
prefrontal cluster also displayed a significant
difference between two groups with the lower value
for the ADHD group than controls.
(c)
(b)
0.35
0.4
0.45
0.5
0.55
0.6
0.65
0.7
0.75
0.8
R_ADHD Tp_ADHD R_Control Tp_Control
mean_α
mean_f(α)
(a)
Source-based Multifractal Detrended Fluctuation Analysis for Discrimination of ADHD Children in a Time Reproduction Paradigm
43
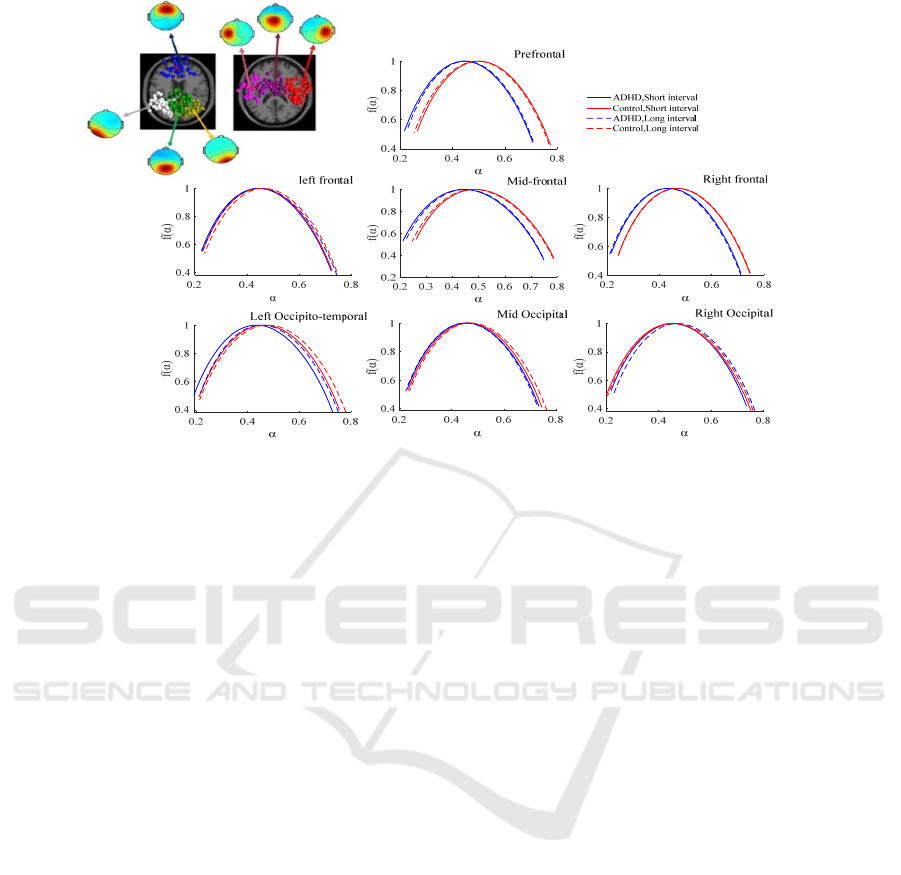
Figure 4: a) 7 IC source clusters including two occipital, one occipital-temporal, three frontal, and one prefrontal cluster. b)
Averaged multifractal spectrums of each source cluster for each group (ADHD vs. control) during two interval reproduction
(short vs. long).
3.3 Classification Results for the Both
Channel-based and Source-based
Features
The multifractal features ability to distinguish
between two groups was furthermore evaluated
by passing them to the SVM classifier. For
both the channel-based and the source-based
measures, SVM with three types of kernel
functions (linear, polynomial, and radial basis
functions (RBF)) were tested. Here, the results
for the RBFSVM are mentioned as it yielded
better results. Using the holdout cross-
validation method, 80% of the data were used
to train the classifiers; the other 20% were kept
for testing and the results were reported as an
average accuracy after 20 repetitions.
Channel-based Classification- In favor of data
reduction, the 76 channel-based multifractal features
(19 electrode * 4 features) were reduced to the 15
principle components using the principle component
analysis preserving 90% of the signal variance.
Afterward, these principal components were fed into
the SVM classifier. Table 1 summarizes the results
of applying multifractal features to the SVM. Using
channel-based multifractal features showed 73.5%
and 77.78% accuracy during rest and time
reproduction, respectively. This outcome revealed an
increase in the accuracy of the classification of two
groups applying the time reproduction paradigm.
Source-based Classification- as reflected by the
group discrepancy results in section C, mean_
,
and mean_
parameters yielded significant
differences across the two groups. Hence, these two
features were chosen for the classification with the
SVM. Considering the ICA algorithm, some subjects
might not have an IC in a cluster. In this case, the
nearest dipole to the central dipole of that cluster
was identified and the above mentioned multifractal
features from the corresponding IC were considered
as the features of that cluster for that subject.
Fourteen features (7 clusters * 2 features) for each
subject were passed to the SVM classifier with the
holdout cross-validation method described above.
The results have been reported in Table 1. The
mean_
and the mean_ presented high
accuracy values of 86.67% and 81.67%,
respectively. It is in accordance with the previous
results in section C that mean_
showed the most
distinguishing feature between the two groups.
4 DISCUSSION
In the current study, we used multifractal properties
to describe the dynamics of brain electrical activity
during two different brain states, the eyes-open rest
and the time reproduction condition. Furthermore,
multifractal features were assessed in the channel-
based as well as the source-based level to discover
(a)
(b)
BIOSIGNALS 2020 - 13th International Conference on Bio-inspired Systems and Signal Processing
44

group discrepancies between ADHD and age-
matched control participants. We found evidence of
multifractal structures as well as the presence of
both types of multifractality in the EEG signals. This
confirmed the presence of the scale-invariant
structure in the brain activity as stated in the
previous studies (Ihlen, 2012; Zorick & Mandelkern,
2013). Interestingly, the channel-based assessment
revealed that the shape of the multifractal spectrum
exhibited a significant alteration from rest to the
time reproduction condition. According to our
statistical results, in transition from the rest to time
reproduction, the width of the multifractal spectrum
increased and its height decreased significantly for
both groups. This indicates that switching from rest
state to the time reproduction state increased the
degree of multifractality of the EEG signals in both
groups. As represented in Figure 2(b-c), this trend
has been seen in almost all studied scalp electrode
sites.
The rise of the width of the singularity spectrum
during the time reproduction demonstrates an
increase of the non-uniformity and the complexity of
the signal and, hence, a climb in the degree of the
multifractality. An increase in brain complexity can
be regarded to be a measure for the brain reaching
an active state (Maity et al., 2015). According to the
MF-DFA, this increase is due to the rise in the
values of the q-order singularity exponents, hence
increase in the weak variations of the signal (h > 0
for q < 0) since at large variations (q<0) signals
behavior become more monofractal (Kantelhardt et
al., 2002). This can be interpreted in the light of
more beta activity during time perception. Beta
oscillations have been reported to correlate with time
perception (Ghaderi et al., 2018; Kononowicz &
Rijn, 2015).
Similarly, a decline in the q-order singularity
dimension variation and mean ( and
mean_ ) reflected a higher degree of
multifractality for EEG time series during time
reproduction. This outcome confirmed the previous
studies arguing the applicability of the scale-
invariant or multifractal structures to reflect changes
in the brain states (Dick, Svyatogor, Ishinova, &
Nozdrachev, 2012; Dutta et al., 2014; Figliola et al.,
2007; Ma et al., 2006; Maity et al., 2015; Natarajan
et al., 2004; Weiss et al., 2011, 2009; Zorick &
Mandelkern, 2013). Maity et al. (2015) reported a
considerable increase in alpha and theta multifractal
spectrum width and hence complexity of these
particular brain waves when subjects listen to the
Tanpura drone. Although channel-based multifractal
features provide significant measures for
distinguishing between the rest and the time
reproduction brain states, they showed weak results
for differentiating the two groups. Among the
multifractal properties, just the mean q-order
singularity exponent displayed near significant lower
values for ADHD subjects compared with controls.
In both conditions the mean_ , hence the degree of
multifractality of EEG signals for ADHD group was
lower than that for healthy control subjects.
It is well known that EEG has a limited spatial
resolution and the channel-level analysis can only
provide limited information about the cortical
regions involved in the generation and the
perturbation of these cortical regions activity
(Makeig, Bell, Jung, & Sejnowski, 1996). One
possible solution for improving the spatial resolution
of EEG is to perform source analysis by means of
source localization methods. To our knowledge, this
is the first time that MF-DFA is performed on the
source ICs of the EEG signals. Our main hypothesis
was that children with ADHD would exhibit distinct
multifractal structure during both EEG recording
conditions and this pattern is more distinguishable in
the source-based analysis. Our source-based
multifractal analysis in the time reproduction task
revealed significant differences between two groups
reaching better spatial resolution. As stated in the
results section, the prefrontal, mid-frontal and right
frontal clusters displayed a significantly different
multifractal spectrum shape for both short and long
duration reproduction conditions for both groups. To
be more precise, the multifractal spectrum of
individuals with ADHD exhibited a leftward shift
which reflects lower degree of multifractality,
consequently, less complexity and more uniformity
of ICs in these individuals compared to the control
subjects. The central tendency of the multifractal
spectrum is closely related to the monofractal Hurst
exponent.
Table 1: Classification accuracy for the channel-based and the source-based multifractal features.
Features
The channel-based
features
The source-based features
Mean- Mean_
Rest
73.5% ----- -----
Time reproduction
77.78% 86.67% 81.67%
Source-based Multifractal Detrended Fluctuation Analysis for Discrimination of ADHD Children in a Time Reproduction Paradigm
45

The central tendency between 0.5-1 reflects a time
series with long-range correlations and below 0.5
would be an index of anti-correlated structure
(Kantelhardt et al., 2002). Therefore the leftward
shift in the multifractal spectrum of participants with
ADHD indicates less long-range correlations in their
EEG signals. This suggests that IC time series in
participants with ADHD in prefrontal, mid-frontal,
and right frontal regions are more uniform and
regular than in the control group. Similarly, it might
be because of fewer small and large variations on the
time series in these areas. These results are in line
with the previous studies reporting reduced
activation in the right dorsolateral prefrontal cortex
(DLPFC) and supplementary motor area (SMA) in
individuals with ADHD during a time discrimination
task (Rubia et al., 2009; Smith, Taylor, Brammer,
Halari, & Rubia, 2008). Correspondingly, in our
previous study, the higher amplitude of the mid-
frontal P300 evoked by the onset of the encoding
phase of time reproduction for ADHD individuals
has been linked to inappropriate and insufficient
allocation of attentional resources for the encoding
of the target interval (Khoshnoud et al. 2017).
Both groups of features were separately
exploited for the classification with SVM. While the
best accuracy for the 4 channel-based multifractal
features was during time reproduction condition
with 77.78%, the source-based mean_α displayed a
significantly higher accuracy with 86.67%. Using
the source-based multifractal features not only
increased the accuracy rate but also reduced the
number of features from 76 (19 * 4) to 14 (7 * 2) for
each participant. Our results confirmed our main
hypothesis by showing greater distinguishability of
the source-based multifractal features. Nevertheless,
the present study has some limitations that should be
considered. First and foremost is that this study
utilized a clinical EEG recording system with 19
electrodes, which resulted in a limited set of ICs and
therefore restricted source clusters. We believed that
using high-resolution EEG signals will lead to more
accurate source localization and subsequently more
ICs which would lead to better classification
accuracy. The second shortcoming of this work is
the small sample size (15 ADHD and 19 controls)
which might be the main source of low statistical
power for discrepancies between the two groups.
5 CONCLUSIONS
This study conducted a multifractal detrended
fluctuation analysis on the neural activities of the
brain in individuals with ADHD and age-matched
healthy children during the eyes-open rest and time
reproduction conditions. It was found that
multifractality could quantify the fluctuation
dynamics from two different pathological EEGs
taken at these two conditions. The results showed
that the sensor-level and the source-level
multifractal features provide different information
about the brain state. According to the results, in
transition from the rest to the time reproduction, the
degree of multifractality of the EEG signals for both
groups displayed a significant increase indicating
more complex and non-uniform activity during time
reproduction. Also, the prefrontal, mid-frontal and
right frontal clusters displayed significantly different
multifractal spectrum shapes for both groups.
Independent components in these clusters for
participants with ADHD exhibited less long-range
correlations suggesting reduced activation in these
source regions.
ACKNOWLEDGEMENTS
The first author would like to thank Dr. Marc
Wittmann and Dr. Scott Makeig for their support
and their great comments on this project.
REFERENCES
American Psychiatric Association. (2013). Diagnostic and
statistical manual of mental disorders (DSM-5®).
American Psychiatric Pub.
Barkley, R. A. (1997). Attention-deficit/hyperactivity
disorder, self-regulation, and time: Toward a more
comprehensive theory. Journal of Developmental &
Behavioral Pediatrics, 18(4), 271–279.
Barkley, R. A., Edwards, G., Laneri, M., Fletcher, K., &
Metevia, L. (2001). Executive functioning, temporal
discounting, and sense of time in adolescents with
attention deficit hyperactivity disorder (ADHD) and
oppositional defiant disorder (ODD). Journal of
Abnormal Child Psychology, 29(6), 541–556.
https://doi.org/10.1023/a:1012233310098
Barkley, R. A., Koplowitz, S., Anderson, T., &
McMurray, M. B. (1997). Sense of time in children
with ADHD: Effects of duration, distraction, and
stimulant medication. Journal of the International
Neuropsychological Society, 3(04), 359–369.
Delorme, A., & Makeig, S. (2004). EEGLAB: An open
source toolbox for analysis of single-trial EEG
dynamics including independent component analysis.
Journal of Neuroscience Methods, 134(1), 9–21.
https://doi.org/10.1016/j.jneumeth.2003.10.009
BIOSIGNALS 2020 - 13th International Conference on Bio-inspired Systems and Signal Processing
46

Delorme, A., Palmer, J., Onton, J., Oostenveld, R., &
Makeig, S. (2012). Independent EEG sources are
dipolar. PLoS ONE, 7(2).
https://doi.org/10.1371/journal.pone.0030135
Dick, O. E., & Svyatogor, I. A. (2012). Potentialities of
the wavelet and multifractal techniques to evaluate
changes in the functional state of the human brain.
Neurocomputing, 82, 207–215.
https://doi.org/10.1016/j.neucom.2011.11.013
Dick, O. E., Svyatogor, I. A., Ishinova, V. A., &
Nozdrachev, A. D. (2012). Fractal characteristics of
the functional state of the brain in patients with
anxiuos phobic disorders. Human Physiology, 38(3),
249–254.
https://doi.org/10.1134/S036211971202003X
Dutta, S., Ghosh, D., Samanta, S., & Dey, S. (2014).
Multifractal parameters as an indication of different
physiological and pathological states of the human
brain. Physica A: Statistical Mechanics and Its
Applications, 396, 155–163.
https://doi.org/10.1016/j.physa.2013.11.014
Easwaramoorthy, D., & Uthayakumar, R. (2010). Analysis
of biomedical EEG signals using Wavelet Transforms
and Multifractal Analysis. Communication Control
and Computing Technologies (ICCCCT), 2010 IEEE
International Conference On.
https://doi.org/10.1109/ICCCCT.2010.5670780
Eke, A., Herman, P., Kocsis, L., & Kozak, L. R. (2002).
Fractal characterization of complexity in temporal
physiological signals. Physiological Measurement,
23(1). https://doi.org/10.1088/0967-3334/23/1/201
Figliola, A., Serrano, E., & Rosso, O. A. (2007).
Multifractal detrented fluctuation analysis of tonic-
clonic epileptic seizures. 123, 117–123.
https://doi.org/10.1140/epjst/e2007-00079-9
Ghaderi, A. H., Moradkhani, S., Haghighatfard, A.,
Akrami, F., Khayyer, Z., & Balcı, F. (2018). Time
estimation and beta segregation: An EEG study and
graph theoretical approach. PLoS ONE, 13(4), 1–16.
https://doi.org/10.1371/journal.pone.0195380
Goldberger, A. L., Amaral, L. A. N., Hausdorff, J. M.,
Ivanov, P. C., Peng, C.-K., & Stanley, H. E. (2002).
Fractal dynamics in physiology: Alterations with
disease and aging. Proceedings of the National
Academy of Sciences, 99(Supplement 1), 2466–2472.
https://doi.org/10.1073/pnas.012579499
Ihlen, E. A. F. (2012). Introduction to multifractal
detrended fluctuation analysis in Matlab. Frontiers in
Physiology, 3 JUN(June), 1–18.
https://doi.org/10.3389/fphys.2012.00141
Kantelhardt, J. W., Zschiegner, S. a., Koscielny-Bunde, E.,
Havlin, S., Bunde, A., Stanley, H. E., … Stanley, H. E.
(2002). Multifractal detrended fluctuation analysis of
nonstationary time series. Physica A: Statistical
Mechanics and Its Applications, 316(1), 87–114.
https://doi.org/10.1016/S0378-4371(02)01383-3
Khoshnoud, S., Nazari, M. A., & Shamsi, M. (2018).
Functional brain dynamic analysis of ADHD and
control children using nonlinear dynamical features of
EEG signals. Journal of Integrative Neuroscience,
17(1), 17–30. https://doi.org/10.3233/JIN-170033
Khoshnoud, S., Shamsi, M., Nazari, M. A., & Makeig, S.
(2017). Different cortical source activation patterns in
children with attention deficit hyperactivity disorder
during a time reproduction task. Journal of Clinical
and Experimental Neuropsychology, 40(7), 633–649.
https://doi.org/10.1080/13803395.2017.1406897
Kononowicz, T. W., & Rijn, H. van. (2015). Single trial
beta oscillations index time estimation.
Neuropsychologia, 75, 381–389.
https://doi.org/10.1016/j.neuropsychologia.2015.06.01
4
Ma, Q., Ning, X., Wang, J., & Bian, C. (2006). A new
measure to characterize multifractality of sleep
electroencephalogram. Chinese Science Bulletin,
51(24), 3059–3064. https://doi.org/10.1007/s11434-
006-2213-y
Maity, A. K., Pratihar, R., Mitra, A., Dey, S., Agrawal, V.,
Sanyal, S., … Ghosh, D. (2015). Multifractal
Detrended Fluctuation Analysis of alpha and theta
EEG rhythms with musical stimuli. Chaos, Solitons
and Fractals, 81, 52–67.
https://doi.org/10.1016/j.chaos.2015.08.016
Makeig, S., Bell, A. J., Jung, T.-P., & Sejnowski, T. J.
(1996). Independent component analysis of
electroencephalographic data. Advances in Neural
Information Processing Systems, 145–151.
Makeig, S., Westerfield, M., Jung, T.-P., Enghoff, S.,
Townsend, J., Courchesne, E., & Sejnowski, T. J.
(2002). Dynamic Brain Sources Visual Evoked
Response. Science, 295(January), 690–694.
Natarajan, K., Acharya U, R., Alias, F., Tiboleng, T., &
Puthusserypady, S. K. (2004). Nonlinear analysis of
EEG signals at different mental states. Biomedical
Engineering Online, 3(1), 7.
https://doi.org/10.1186/1475-925X-3-7
Noreika, V., Falter, C. M., & Rubia, K. (2013). Timing
deficits in attention-deficit/hyperactivity disorder
(ADHD): Evidence from neurocognitive and
neuroimaging studies. Neuropsychologia, 51(2), 235–
266. https://doi.org/10.1016/j.neuropsychologia.
2012.09.036
Onton, J., & Makeig, S. (2006). Chapter 7 Information-
based modeling of event-related brain dynamics.
Progress in Brain Research,
159, 99–120.
https://doi.org/10.1016/S0079-6123(06)59007-7
Palmer, J. A., Kreutz-Delgado, K., & Makeig, S. (2006).
Super-Gaussian mixture source model for ICA.
Lecture Notes in Computer Science (Including
Subseries Lecture Notes in Artificial Intelligence and
Lecture Notes in Bioinformatics), 3889 LNCS, 854–
861. https://doi.org/10.1007/11679363_106
Palmer, J. A., Kreutz-Delgado, K., & Makeig, S. (2011).
AMICA: An adaptive mixture of independent
component analyzers with shared components. San
Diego, CA: Technical report, Swartz Center for
Computational Neuroscience.
Palmer, J. A., Makeig, S., Kreutz-Delgado, K., & Rao, B.
D. (2008). Newton method for the ICA mixture model.
Source-based Multifractal Detrended Fluctuation Analysis for Discrimination of ADHD Children in a Time Reproduction Paradigm
47

IEEE International Conference on Acoustics, Speech
and Signal Processing, 2008., 1805–1808. IEEE.
Rubia, K., Halari, R., Christakou, A., & Taylor, E. (2009).
Impulsiveness as a timing disturbance: neurocognitive
abnormalities in attention-deficit hyperactivity
disorder during temporal processes and normalization
with methylphenidate. Philosophical Transactions of
the Royal Society of London B: Biological Sciences,
364(1525), 1919–1931.
Sadock, B. J., & Sadock, V. A. (2011). Kaplan and
Sadock’s synopsis of psychiatry: Behavioral
sciences/clinical psychiatry. Lippincott Williams &
Wilkins.
Smith, A. B., Taylor, E., Brammer, M., Halari, R., &
Rubia, K. (2008). Reduced activation in right lateral
prefrontal cortex and anterior cingulate gyrus in
medicationnaïve adolescents with attention deficit
hyperactivity disorder during time discrimination.
Journal of Child Psychology and Psychiatry, 49(9),
977–985.
Toplak, M. ., & Tannock, R. (2005). Tapping and
anticipation performance in attention deficit
hyperactivity disorder. Perceptual and Motor Skills,
100(3), 659–675. https://doi.org/10.2466/
PMS.100.3.659-675
Toplak, M. E., Dockstader, C., & Tannock, R. (2006).
Temporal information processing in ADHD: Findings
to date and new methods. Journal of Neuroscience
Methods, 151(1), 15–29. https://doi.org/10.1016/
j.jneumeth.2005.09.018
Vapnik, V. N., & Lerner, A. Y. (1963). Recognition of
Patterns with help of Generalized Portraits. Avtomat. i
Telemekh, 24(6), 774–780.
Weiss, B., Clemens, Z., Bódizs, R., & Halász, P. (2011).
Comparison of fractal and power spectral EEG
features: Effects of topography and sleep stages. Brain
Research Bulletin, 84(6), 359–375.
https://doi.org/10.1016/j.brainresbull.2010.12.005
Weiss, B., Clemens, Z., Bódizs, R., Vágó, Z., & Halász, P.
(2009). Spatio-temporal analysis of monofractal and
multifractal properties of the human sleep EEG.
Journal of Neuroscience Methods, 185(1), 116–124.
https://doi.org/10.1016/j.jneumeth.2009.07.027
Zorick, T., & Mandelkern, M. A. (2013). Multifractal
Detrended Fluctuation Analysis of Human EEG:
Preliminary Investigation and Comparison with the
Wavelet Transform Modulus Maxima Technique.
PLoS ONE, 8(7), 1–7. https://doi.org/
10.1371/journal.pone.0068360
BIOSIGNALS 2020 - 13th International Conference on Bio-inspired Systems and Signal Processing
48
