
A Study on Variation in EMG Trends under Different Muscular
Energy Condition for Repeated Isokinetic Dumbbell Curl Exercise
Rushda Basir Ahmad, Nadeem Ahmad Khan and Muhammad Usama Rizwan
Department of Electrical Engineering, Lahore University of Management Sciences, Lahore, Pakistan
Keywords: EMG, Fatigue, Mean Power Frequency, Time Analysis, Muscle Condition.
Abstract: Quantification and detection of accumulated muscle fatigue to assess muscle condition is of pivotal
importance in sports and injury prevention. Existing research on assessment of exercise-induced muscle
fatigue provides information regarding change in EMG waveform of the muscle during a single set of exercise
performed. However, currently there is no study which discusses the variation in EMG activity of same subject
under different muscle conditions when the exercise is repeated at constant force level. This paper investigates
the changes in muscular energy under different conditions using endurance time, mean power frequency
(MPF) and integrated EMG (IEMG) as metrics. This paper presents an initial study on EMG data acquired
from subjects subjected to repeated isokinetic contractions. The aim of the study is to focus on inter-subject
and intra-subject variations in EMG data. Such studies are very limited. Most of the studies focus on isometric
contraction and make use of average data of the subjects from which data is collected once per protocol. Such
reports do not bring forward the inter-subject and intra-subject variability. Because of huge variability, this
study does not validate use of Global Fatigue Index for determination of muscle force and fatigue. Study of
this variability is important if any autonomous system is developed for individuals using the EMG data that
can accurately make detection and prediction on individual basis. Moreover this study suggests, peak MPF
value and average slope of MPF curve during transition to fatigue stage as useful features to predict remaining
time to fatigue till failure point.
1 INTRODUCTION
Fatigue accumulation in muscles and subsequent
recovery has special significance in sports activities
and rehabilitation. As fatigue sets in, the muscle
capacity to perform a physical action decreases.
Accumulation of muscle fatigue causes muscle
stiffness, tension and myalgia. Generated fatigue
depends on multiple factors including intensity,
duration, physical fitness and type of task being
performed which may be static or dynamic in nature
(Yates et al., 1987; Cornwall et al., 1994; Singh et al.,
2004).
Recovery following fatigue accumulation is
broadly characterized into two categories. Strength
recovery deals with the ability of muscle to restore its
strength after physical exertion to its original
capacity. Muscular endurance is the ability of a
muscle to persist a task for an extended period of
time, referred to as endurance time. Reported rate of
strength recovery is nearly five minutes, whereas the
recovery to persist an isometric task is reported to
take longer time (Yates et al., 1987).
Surface EMG is an effective non–invasive
technique for fatigue detection and quantifies the
underlying electrical activity of motor neurons
responsible for generating the requisite force in
muscle to sustain a particular activity. Analysis of
changes in the time and frequency domain features of
this myoelectric signal indicate the fatigue generated
in muscle. The time domain analysis of EMG
provides information regarding muscle activation
while in frequency domain fatigue is observed as
frequency shift towards lower frequency in EMG data
(Hwaang et al., 2016). These parameters of s-EMG
give a measure of muscle fatigue in a localised area.
While several studies exist which discuss the
variation in s-EMG amplitude and frequency during
continuous isometric exercises, relatively fewer
studies are present on isokinetic exercises. Moreover,
there is currently no study which provides an
adequate method for prediction of time to fatigue and
discusses changes in EMG activity of a muscle at
same force level under different muscle conditions.
Muscle condition while performing exercise at
different time intervals with varying periods of rest in
Ahmad, R., Khan, N. and Rizwan, M.
A Study on Variation in EMG Trends under Different Muscular Energy Condition for Repeated Isokinetic Dumbbell Curl Exercise.
DOI: 10.5220/0008853001410148
In Proceedings of the 13th International Joint Conference on Biomedical Engineering Systems and Technologies (BIOSTEC 2020) - Volume 4: BIOSIGNALS, pages 141-148
ISBN: 978-989-758-398-8; ISSN: 2184-4305
Copyright
c
2022 by SCITEPRESS – Science and Technology Publications, Lda. All rights reserved
141

between exercises represent different muscle
conditions. This paper presents an initial study based
on changes in both time and frequency domain
features of EMG signal for subjects under different
muscular energy conditions for an isokinetic exercise
of repeated dumbbell curls. Such a study can yield
insight regarding modelling of different trends of time
domain and frequency domain features of EMG
signals for the purpose of reliable evaluation of
fatigue levels incurred and prediction of upcoming
failure point. Studies conducted earlier most of the
time suffice on presenting generalized group results
or average trends at individual level. However,
diversity in trends depicted under varying muscle
energy conditions needs to be studied and robustness
of proposed evaluation and prediction methods
against this diversity needs to be tested. Our study on
subjects with very low level training indicate wide
variation in performance trends of EMG features.
This study is designed to bring forward the inter-
subject and intra-subject variability that exists from
individuals to individuals. Moreover, this also brings
to challenges some of the claims or propositions
found in the literature. Some initial findings and
conclusions are being shared in this paper which can
be used to devise new methods of evaluation of
fatigue level and prediction of time to fatigue.
Traditionally two muscle states have been studied
Non-fatigue and Fatigue. Recently in literature a three
stage division has been proposed which include the
Non-fatigue (or Pre-fatigue) stage, Transition-to-
Fatigue stage and the Fatigue stage. The onset of
fatigue in the fatigue stage leads to inability of the
muscle to maintain a desired force or power which
leads to the total fatigue state (failure point) where it
is impossible for the subject to continue performing
the task. This last phase is generally very short.
Transition to fatigue stage signifies a phase where a
fresh muscle starts to fatigue and where the remaining
time to fatigue can be estimated with good accuracy.
The rest of the paper is organized as follows:
Section II discusses experimental protocol. Section
III presents processing scheme; Section IV presents
the experimental results; Section V gives the
conclusion.
2 EXPERIMENTAL METHODS
2.1 Subject
Four right–handed healthy 16 - 18 year old subjects
with no prior reported neuromuscular injury
participated in this project. Subject 1 and 2 had
minimal prior training and exercise history while
subject 3 and 4 were novice with no prior experience.
Before the experiment the subjects were informed
about the experimental protocol and asked to sign a
written consent. The experiment consisted of two
phases and was conducted on two consecutive days.
First phase of the experiment was concerned with the
determination of maximum voluntary contraction
(MVC), while in the second phase subjects performed
continuous isokinetic dumbbell curls.
2.2 Exercise Protocol
The endurance task was designed to fatigue the
muscle and observe the effect of accumulated fatigue
in muscle. After determination of MVC, each subject
was asked to perform four sets of continuous
exhaustive dumbbell curls at 35% of their MVC level.
Generally, recommended rest interval for recovery
during strength training is 2 to 5 minutes (
Willardson,
2006)
. However, full recovery which depends on
strength recovery as well as the ability to sustain any
physical activity for same amount of time as the stage
of pre-exhaustion, requires longer period of rest and
is subject dependent. Set 1 and Set 2 were performed
on Day 1 with an inter-set recovery period of 10
minutes whereas Set 3 and Set 4 were performed on
Day 2 with an inter-set rest period of 2 minutes. Each
subject was asked to perform continuous exhaustive
dumbbell curls till failure in each set. Exhaustion was
defined as the point where the subject could no longer
perform curls. The subject stood erect with their
upper arm fixed, and was directed to move their lower
arm through a full range of motion at a speed of 20
repetitions per minute (3 sec/cycle). In order to
regulate the time taken for one contraction the subject
matched the speed for one complete repetition i.e. 3
sec with the visual cue played on screen. EMG signals
were recorded from the bicep brachii using bipolar
surface electrodes placed 2 cm apart. Prior to
electrode placement, the skin was shaved, cleansed
and abraded with skin cleaning gel. A conductive
adhesive gel was applied at electrode skin contact
point to increase conductivity of electrodes.
Existing literature suggests that lateral and medial
positions on bicep muscle are adequate for data
acquisition. Physical placement of channel markers
on the surface of the skin is dependent on the
identification of the localized sites with maximum
motor unit activity. Electrodes were placed on
proximal end from the muscle belly for medial bicep
brachii and distal end from the centre of muscle for
lateral head of bicep as they are preferred sensor sites
(
Zaheer et al., 2012).
BIOSIGNALS 2020 - 13th International Conference on Bio-inspired Systems and Signal Processing
142

3 PROCESSING SCHEME
The EMG data was collected through Shimmer EMG
development kit, sampled at 1000 Hz and processed
in Matlab. In this study, we concomitantly conducted
a time domain and frequency domain analysis of
EMG to assess fatigue accumulation in muscle over
four sets performed by the subject on two consecutive
days. The processing scheme used for EMG data
analysis is discussed in detail in following steps.
3.1 Pre-processing
EMG signal is a non-stationary signal and is affected
by noise (Singh et al., 2004).A non-causal moving
average filter (MAF) was used for DC offset removal.
The formula for moving average filter coefficient is
given by (1).
∑
(1)
(2)
In (1), x (n) represents the time domain signal, w
represents the window size and mav (n) represents the
averaged value which is subtracted from time signal.
Equation (2) represents the resultant signal after
application of moving average filter. The window size
used in our experiment was 100 samples. After DC
offset removal, the data was segmented in to multiple
repetitions. The average time taken for completion of
one repetition was approximately three seconds (3
sec) in-accordance with the protocol followed for data
acquisition. However, as the time taken for
completing a repetition exceeded the requisite time
i.e. 3 seconds in later repetitions, data was segmented
through visual inspection.
It is a well-established fact that useful EMG data
lies in frequency range of 10 Hz to 500 Hz (
Allison et
al., 2002)
and therefore a band pass filter of 5 Hz – 400
Hz was applied on data in frequency domain on each
repetition separately. 1000 samples corresponding to
the region of maximum activation for each repetition
were selected. Region of maximum activation in
EMG signal comprised of 1000 samples which had
the largest cumulative EMG value.
3.2 Data Analysis
Time domain metrics including root mean square
(RMS) and integrated EMG (IEMG) are generally
used for EMG fatigue analysis. According to existing
literature, both RMS and IEMG exhibit an increase in
value as fatigue onsets in muscle. To predict muscle
fatigue in time domain we observed changes in mean
and normalized IEMG for each bicep curl. IEMG
gives a measure of area under the curve and account
for the number of the recruited motor units providing
the requisite muscle force while performing an
activity. Usually, the increase in IEMG value is linear
in nature. The formula for Integrated EMG is given
by (3)
IEMG
|
|
(3)
The T represents the time taken to complete one
complete cycle. The formula shows that the value of
IEMG varies as a function of time (Hwaang et al.,
2016). IEMG value determined for each repetition
was time normalized over the time taken in seconds
for its completion to compute IEMG per second
(IEMG/s).
The notion that the mean power frequency (MPF)
and median frequency (MDF) decrease in effect to
fatigue generation in muscle is well accepted in
scientific society (
Hotta and Ito, 2013). As fatigue
develops EMG spectrum shifts towards lower
frequency. It is well established in literature that the
mean frequency of the power spectrum is proportional
to propagation velocity. MPF is by given by (4).
MPF
∑
∑
(4)
Here f represents frequency vector, and P
represents power spectrum. Power spectrum is
determined by taking square of spectrum of a time
domain signal.
denotes lower frequency bin
whereas
denotes higher frequency bin. Frequency
range varies from 5 to Fs/2, where Fs is the sampling
frequency. In our scheme MPF is determined on best
window EMG data for each repetition.
4 RESULTS AND DISCUSSIONS
In this section we discuss fatiguing trends during
different muscular conditions. This study is designed
to bring forward the intra-subject and inter-subject
variability that exists from individual to individual.
Also changes observed in IEMG curves and MPF
under different states of muscle capacity and fatigue
conditions are reported.
The trends obtained for medial and lateral position
of bicep muscle were similar. However, EMG activity
was found to be more prominent on lateral position of
bicep muscle and its results are discussed in this
paper. It is to be noted that the fatiguing trends for
other muscles will be somewhat different and
dependent on subject’s training or exercise regime.
The observation yields that there exists quite some
variability in the nature of the IEMG and MPF curves
of the subjects with different training levels. The
A Study on Variation in EMG Trends under Different Muscular Energy Condition for Repeated Isokinetic Dumbbell Curl Exercise
143
subjects used in our study are male unexperienced
teen agers with only limited exposure to prior
dumbbell training. These could be divided in two
categories: one with some prior training (Subject 1
and 2) and other initial beginners (Subject 3 and 4).
Fig. 1 shows the superimposed plot of IEMG
values for each subject while Fig. 2 represents the
IEMG best fit curves on four sets of subject 1. Fig. 3
shows the superimposed MPF plot of all the sets
performed by subjects 1, 2, 3 and 4 respectively. Fig.
4 shows the graph to predict time to fatigue using
slope of the MPF curve of Set 1 for subject 1. Fig. 5
shows the simultaneous time and frequency
information of EMG signal as MPF vs. IEMG graph
for all four subjects, analogous to the global fatigue
index proposed in (Hwaang et al., 2016). In Fig.5 the
IEMG values for each set are percentage normalized
with respect to the initial value while MPF values are
percentage normalised with respect to the maximum
value of each individual set respectively. Table 1
shows the values for threshold factor and average
slope across all four sets for each subject, explained
later in the paper.
Endurance time (ET) is the time taken by the
subject to reach failure while performing an activity.
ET provides information regarding the energy
condition of the muscle. If muscular strength is
greater, the subject is likely to sustain a fatiguing
activity for greater amount of time, which is labelled
as endurance time.
A general trend observed in the endurance time
for each subject showed that 75% – 100% strength
recovery occurred during the first two consecutive
sets having a rest period of 10 minutes in-between the
sets whereas 50%-60% recovery occurred between
consecutive sets performed on Day2, having an inter-
set rest period of 2 minutes. After 100% strength
recovery the repetitions performed by the subject
were either equal to or exceeded the number of
repetitions performed in the preceding set.
Consistent with the results in earlier literature (Yates
et al., 1987) for isotonic exercise, percentage recovery
in isokinetic exercise is also found to be proportional
to the rest period between consecutive sets.
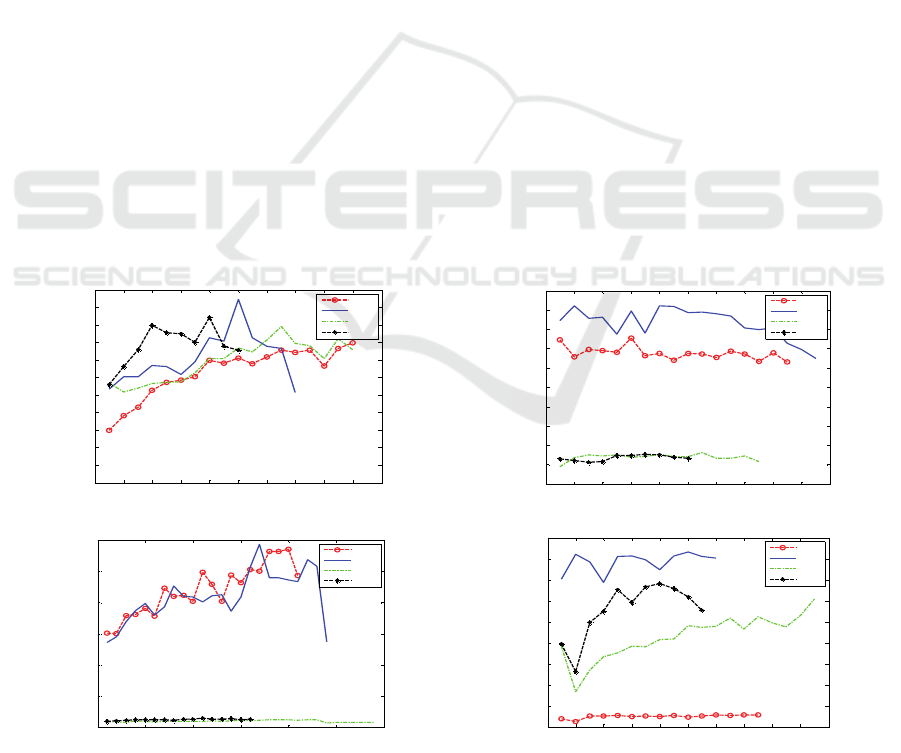
4.1 Integrated EMG (IEMG) Trends
IEMG curves show considerable inter-subject
variation in EMG data collected in different trails
from individuals, however intra-set analysis for each
subject represented a dominant trend.
Fig. 1 clearly shows an initial increase in
amplitude of IEMG in each individual set for subject
1, 3 and 4. This increase in IEMG amplitude is
attributed to activation of additional motor units to
maintain strength during submaximal fatiguing
contractions (
Conwit et al., 2000). However, in case of
subject 2, the IEMG trends do not show an increase
in the value but maintain a constant linear level in the
beginning and then exhibit slightly decreasing trends
SUBJECT 1 SUBJECT 2
SUBJECT 3 SUBJECT 4
Figure 1: Superimposed IEMG (mV) graphs of four different sets under different muscle rest conditions for subject 1, 2, 3
and 4 respectively.
0 2 4 6 8 10 12 14 16 18 20
0
10
20
30
40
50
60
70
80
90
100
110
Repetition
IEMG/s
SET1
SET2
SET3
SET4
0 2 4 6 8 10 12 14 16 18 20
0
50
100
150
200
250
300
350
400
450
500
Re
p
etition
IEMG/s
SET1
SET2
SET3
SET4
0 5 10 15 20 25 3
0
0
20
40
60
80
100
120
Repetition
IEMG/s
SET1
SET2
SET3
SET4
0 2 4 6 8 10 12 14 16 18 20
0
20
40
60
80
100
120
140
160
180
Repetition
IEMG/s
SET1
SET2
SET3
SET4
BIOSIGNALS 2020 - 13th International Conference on Bio-inspired Systems and Signal Processing
144

near exhaustion. Is has been reported in earlier studies
that during continuous isometric exercise, the EMG
amplitude increases for 70% of the total endurance
time. After this point the amplitude tends to level off
(
Allison and Fujiwara, 2002). The trends obtained for
isokinetic exercise in (Hwaang et al., 2016) shows an
abrupt increase in the value of IEMG at onset to
fatigue. However, in contrast to results reported
earlier in (Hwaang et al., 2016) and (
Allison and
Fujiwara, 2002), we have observed that the IEMG
amplitude may increase or decrease abruptly for
different subjects, after 70% of the endurance time
has passed. We can clearly observe these trends in best
fit superimposed IEMG graph for subject 1. The
maximum number of repetitions carried out by the
subject were 18, 14, 18 and 10 in Set 1, 2, 3 and 4
respectively, with average completion time for each
repetition approximately around 3 seconds. An instant
decay can be seen in IEMG amplitude after repetition
12 in Set 1. Similar decay can be observed in IEMG
graph for Set 2, 3 and 4 at repetition 10, 12 and 7
respectively which accounts for approximately 70% of
the total number of repetitions in each set respectively.
It shows that onset to fatigue takes place after about
70% of endurance time has passed, and the subject can
sustain the activity for an additional time of 42.9% of
the elapsed time before the subject reaches the failure
point. This can be observed in Fig. 2.
However, in-contrast to the IEMG trends
observed for subject 1, subject 4 exhibits a rise in the
value of IEMG in Set 3 after onset of fatigue during
fatigue stage as shown in Fig. 1. So we conclude that
the IEMG graphs show considerable variation in
shape from subject to subject. Intra-subject variation
also exist which could be considerable. However,
general shape of the intra-subject graphs shows
similar trend. In most of the subjects IEMG shows an
increase during a set before levelling off or in some
subjects may remain roughly flat. In our exercise we
asked to subject to continue the exercise a further into
the fatigue period till the subject was clearly inclined
to discontinue the activity. It was found that this
fatigue stage showed up in the IEMG graphs in terms
of either rapid rise or fall. Our study shows that even
in the case of the same subject both fast rise or decline
are possible during isokinetic exercises.
Figure 2: Superimposed IEMG (mV) best fit curves for
different sets for Subject 1.
4.2 Mean Power Frequency (MPF)
Trends
Fig. 3 shows the superimposed mean power
frequency graphs (MPF) for each subject. Usual
statistical parameters used to describe the frequency
shift in data are median frequency and mean power
frequency. Consistent with the previous studies
(
Hwaang et al., 2106; Allison and Fujiwara, 2002; Zaman
et al., 2007) the mean power frequency determined for
each set in our study decreased in a non-linear fashion
as fatigue set in the muscle. Congruent to the results
obtained from time analysis of data, the MPF value
for each set shows either a sharper decline or an
abrupt increase in its value after 70% of the total
endurance time has passed and this indicates onset to
fatigue.
We observed that the MPF value varied from
subject to subject. However, for an individual set it
was observed that the MPF at the failure point tends
to fall to a value that lie in close range of a fraction of
the maximum MPF value. This ratio varies in the
range of 0.6 to 0.7 depending on the individual. This
is concurrent to the observation stated in (Hwaang et
al., 2016) that the MPF falls to 60% of its initial value
as 100% fatigue sets in the muscle. This can be
determined using the following equation.
/
(5)
Here n is the threshold factor,
is the peak
MPF value and
is the MPF value at the failure
point.This is fairly stable for an individual and hence
can be used for prediction of failure point.
0 2 4 6 8 10 12 14 16 18
20
30
40
50
60
70
80
90
100
Time Normalised IEMG across all repetitions
Repetitions
Ampli t ude (mV)
SET1
SET2
SET3
SET4
A Study on Variation in EMG Trends under Different Muscular Energy Condition for Repeated Isokinetic Dumbbell Curl Exercise
145
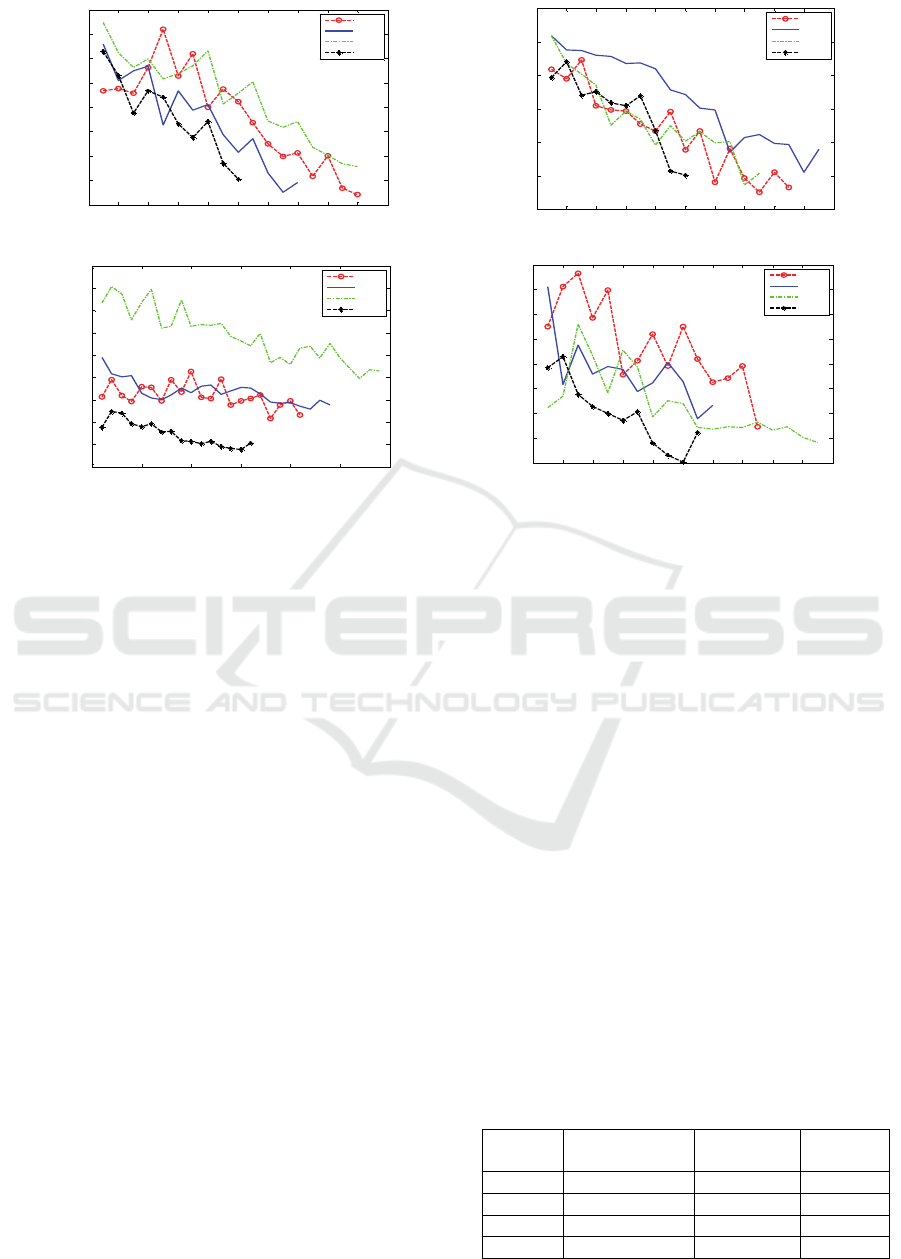
SUBJECT 1 SUBJECT 2
SUBJECT 3 SUBJECT 4
Figure 3: Superimposed MPF graphs of four different sets at different muscle rest condition for subject 1, 2, 3 and 4
respectively.
The variation in the initial starting values of each
set for the subjects was observed to be less for
relatively trained subjects i.e. subject 1 and subject 2
which lie in the range of 10-13 Hz as compared to
novice subjects .i.e. subject 3 and subject 4 in which
the variation amongst the starting values of performed
sets lie in the range of 22-44 Hz. This indicates that
the variation in trends of MPF tends to become more
predictable and easier to model with the increase in
performance training. The variation in the shape of
the curves and absolute values under different muscle
conditions becomes less fluctuating with training.
The trend observed in the MPF graphs is pre-
dominantly that of progressive decline. However,
initial rise in the MPF value was also observed in
some trails. It is proposed that progressively declining
stage of the graph be regarded as the transition to
fatigue phase. Portion of the graph before the MPF
peaks off can be regarded as non-fatigue phase.
Using this definition of transition to fatigue, it is
proposed that prediction of time to fatigue (number of
repetitions left to total fatigue) can be done after the
onset of transition to fatigue. This can be done by
estimating the MPF value at the failure point and the
average slope of the MPF curve during the transition
to fatigue stage. This is shown in Fig. 4. At any time
after entering the transition to fatigue stage, the
decreasing trend in the MPF curve may be
extrapolated using the estimated slope of the
transition to fatigue phase to the estimated failure
point MPF level. The failure point MPF can be
estimated using the peak of MPF curve in a set and
threshold factor. A rough first estimate of the average
slope may be obtained by evaluating the average
instantaneous slope till the current point. As the
transition to fatigue stage will progress the average
instantaneous slope will come closer in value to final
average slope of this phase and the accuracy of
prediction is expected to improve. Table. 1 shows the
average threshold factor n determined for each
subject, the standard deviation and the average slope.
Our method is expected to yield better
prediction than in (Al-Mulla et al., 2012) because the
time to failure in (Al-Mulla et al., 2012) is assumed to
remain the same for a given subject. However, our
study confirm that depending on the energy condition
this time to failure varies in reality and can be observed
from the graphs. Our approach being more adaptive to
the ongoing trend is expected to be more accurate.
Table 1: Calculated threshold factor and average slope for
each subject.
Subject Average
Threshold (n)
St. dev in
(n)
Average
Slope
1 0.6035 0.0199 -2.4421
2 0.5443 0.0313 -3.3943
3 0.6440 0.0564 -1.3225
4 0.7073 0.0194 -2.2975
0 2 4 6 8 10 12 14 16 18 20
40
45
50
55
60
65
70
75
80
Repetition
MPF (Hz )
SET1
SET2
SET3
SET4
0 2 4 6 8 10 12 14 16 18 20
40
50
60
70
80
90
100
Repetition
MPF (Hz)
SET1
SET2
SET3
SET4
0 5 10 15 20 25 30
20
30
40
50
60
70
80
90
100
110
Repetition
MPF (Hz )
SET1
SET2
SET3
SET4
0 2 4 6 8 10 12 14 16 18 20
50
55
60
65
70
75
80
85
90
Repetition
MPF ( Hz)
SET1
SET2
SET3
SET4
BIOSIGNALS 2020 - 13th International Conference on Bio-inspired Systems and Signal Processing
146
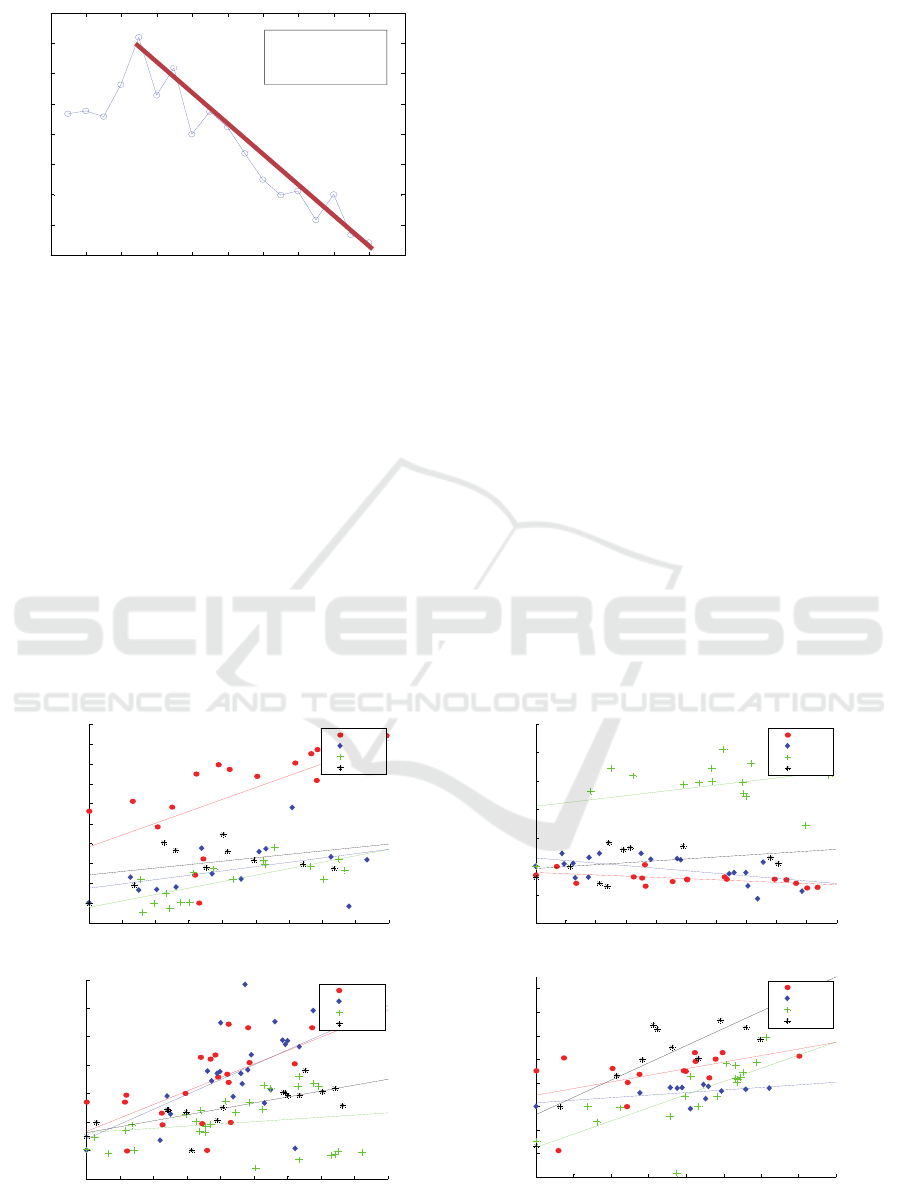
Figure 4: Slope of MPF curve to predict time to fatigue.
In order to predict the transition to fatigue in EMG
waveform (Ullah et al., 2012) has used just the
instantaneous slope of MPF to identify transition to
fatigue stage. The onset of this stage is indicated if the
slope exceeds a certain threshold. Looking to the
fluctuations in slope in EMG real-life data overall only
using the instantaneous slope criteria may not be
enough to reliably detect the transition to fatigue
stage.
With regard to detection of transition to fatigue and
prediction of time to failure point training a classifier
with machine learning approach for prediction is more
suitable rather than using a deterministic approach
evaluating one or two features.
(Hwaang et al., 2016) proposed a method of
making a global EMG index map to simultaneously
predict muscle fatigue and force from real-time EMG
signal with arbitrary MVC levels for repeated
isokinetic dumbbell curls. The mean IEMG value and
mean frequency values were co-plotted for this
purpose. In our case IEMG vs MPF plots for our four
subjects only for a 35% MVC are shown in Fig. 5.
Linear curve has been fit over points corresponding
to transition to fatigue stage. Looking at the spread of
these points and different slopes of the best-fit lines
for each fatigue bout, it can be concluded from our
results that defining an accurate global-index curves
even for individual subjects would be not be realistic
given the non-stationary nature of EMG signal. Such
curves can only be used describe a very coarse and
general trend of MPF vs IEMG values at different
force levels but predicting the force levels can yield
inaccurate results.
5 CONCLUSIONS
The conclusion of this study is that IEMG and MPF
curves show considerable inter-subject variation
through EMG data collected in different trails from an
individual as well as some repeatable characteristics.
Hence the scope of person-specific autonomous
systems only trained on individual person data is
advocated for attaining accuracy than a generally-
trained system based on these characteristics. The
study indicate that MPF frequency trend starts showing
SUBJECT 1 SUBJECT 2
SUBJECT 3 SUBJECT 4
Figure 5: MPF vs. IEMG graphs of four different sets at different muscle condition for subject 1, 2, 3 and 4 respectively.
556065707580859095100
80
100
120
140
160
180
200
220
240
260
280
% Normalised MPF
% Normalised IEMG / s
SET1
SET2
SET3
SET4
50556065707580859095100
60
80
100
120
140
160
180
200
% Normalised MPF
% Normalised IEMG / s
SET1
SET2
SET3
SET4
556065707580859095100
80
100
120
140
160
180
200
220
% Normalis ed MPF
% Normalised IEMG / s
SET1
SET2
SET3
SET4
6065707580859095100
40
60
80
100
120
140
160
180
200
% Normalised MPF
% Normali sed I EMG / s
SET1
SET2
SET3
SET4
0 2 4 6 8 10 12 14 16 18 20
40
45
50
55
60
65
70
75
80
Repititions
MPF (Hz)
Peak MPF
Failure point MPF
Set1
Slope: -
2.54
A Study on Variation in EMG Trends under Different Muscular Energy Condition for Repeated Isokinetic Dumbbell Curl Exercise
147

predictability earlier with little training compared to
mean EMG and IEMG in which the effect of fatigue
and unpredictability of trends remain dominant till
later stage of training. Thus MPF values (frequency
analysis) are more sensitive to intra-subject variation
than time domain metrics like mean and IEMG and
hence carry more scope in developing an autonomous
system.
We have pointed that features like slope during
transition-to-fatigue stage can be used to predict time-
to-failure as the final failure point is about 60%-70%
of the maximum MPF frequency. The recovery of
starting frequency from fatigue even in case of
somewhat experienced subject is very fast and is
complete in almost 10 minutes. Moreover, our study
does not verify the utility of a general global fatigue
index as they have not taken in to consideration the
intra-subject and inter-subject variations.
REFERENCES
J. W. Yates, J. T. Kearney, M. P. Noland, W. M. Felts,
1987. Recovery of dynamic muscular endurance,
European Journal of Applied Physiology, 56: 662-667.
M. W. Cornwall, L. P. Krock, L. M. Wagner, 1994.
Muscular fatigue and recovery following alternating
isometric contractions at different levels of force, Aviat.
Space Environ. Med, 65: 309 -14.
V. P. Singh; D. K. Kumar; D. Djuwari; B. Polus; S. Fraser;
J. Hawley; S. L. Giudice, 2004, Strategies to identify
muscle fatigue from SEMG during cycling, Proceedings
of the 2004 Intelligent Sensors, Sensor Networks and
Information Processing Conference.
H. J Hwaang, W. H Chung, J. H Song, J. K Lim and H. S
Kim, 2016. Prediction of biceps muscle fatigue and
force using electromyography signal analysis for
repeated isokinetic dumbbell curl exercise. Journal of
Mechanical Science and Technology, 30(11), Pp.
5329~5336.
F. Zaheer, S.H. Roy, C. J De Luca, 2012. Preferred sensor
sites for surface EMG signal decomposition, Physiol
Meas; 33(2): 195–206
G. T. Allison, T. Fujiwara, 2002. The relationship between
EMG median frequency and low frequency band
amplitude changes at different levels of muscle
capacity. Clinical Biomechanics 17/:464–469
Y. Hotta, K. Ito, 2013. Detection of EMG-based muscle
fatigue during cyclic dynamic contraction using a
monopolar configuration. 35th Annual International
Conference of the IEEE Engineering in Medicine and
Biology Society (EMBC) .
J. M Willardson, 2006. A Brief Review: How Much Rest
between Sets?, Kinesiology and Sports Studies
Department, Eastern Illinois University, Charleston,
Illinois.
R. A. Conwit, D.Stashuk, H. Suzuki , N. Lynch, M.
Schrager, E. J. Metter, 2000. Fatigue Effects on Motor
Unit Activity During Submaximal Contractions, Arch
Phys Med Rehabil, 81:1211-6.
A. A. Zaman, T. Sharmin, M. A. A Khan, M. Ferdjallah,
2007. Muscle fatigue analysis in young adults at
different MVC levels using EMG metrics, Proceedings
2007 IEEE SoutheastCon, Richmond, VA, pp. 390-394.
M. R. Al-Mulla, F. Sepulveda and M. Colley, 2012. sEMG
Techniques to Detect and Predict Localised Muscle
Fatigue, EMG Methods for Evaluating Muscle and
Nerve Function, Mark Schwartz, IntechOpen.
J. G. Ullah, H. Yu, S. Gyan, P. Rangel, O. Adeoye, N. V.
Hernandez, 2012. A mathematical Model to Predict
Transition-to-Fatigue During Isometric Exercise on
Muscles of the Lower Extremities. Engineering, Vol. 4,
No. 10, pp. 16-19.
BIOSIGNALS 2020 - 13th International Conference on Bio-inspired Systems and Signal Processing
148
