
Photoluminescent Imaging for an Effective Cancer Diagnosis using
Upconversion Nanoparticles
Rafia Rafique and Tae Jung Park
Department of Chemistry, Chung-Ang University, Seoul 06974, Republic of Korea
Keywords: Upconversion Nanoparticle, Photoluminescence, Cytotoxicity, Live Cell Imaging.
Abstract: Advancements in the synthesis of upconversion nanoparticles (UCNP) can enable a broad range of biomedical
applications. Herein, we fabricated NaYF
4
:Yb
3+
/Er
3+
UCNP and polyacrylic acid conjugated UCNPs
(UCNP@PAA). Characterizations of the resulting particles were conducted using electron microscopy and
spectroscopy, X-ray diffraction (XRD), and upconversion luminescence (UCL) analysis. We demonstrated
that particles were synthesized with good homogeneity, hexagonal phase, and UCL efficiency. The
UCNP@PAA maintained their original particle size and luminescence properties, cellular nontoxicity, in vitro
bioimaging, and biocompatibility. Based on these results, we suggest that these particles can be applied in
drug-delivery systems and as bioimaging agents in the future.
1 INTRODUCTION
Photon upconversion (UC) is a distinct process in
which low energy light is converted to higher energy
light via absorption of photons consecutively to
generate anti-Stokes emission (Zhou et al., 2014).
Near-infrared (NIR) light has attracted a great interest
due to their deep tissue penetration capacity with less
light scattering and photodamage. Recently,
lanthanide-doped upconversion nanoparticles (UCNP)
have been extensively employed for bioimaging, and
cancer diagnostics (Zhou et al., 2012; Zhang et al.,
2018). UCNP can absorb NIR light, which results in
negligible photodamage to cells in comparison with
UV light exposure. UCNP generally prepared using
three precursors—an inorganic host matrix, sensitizer
ion, and activator ion—that show distinctive emission
and UC photoluminescence (PL). Rare earth elements
with inorganic composition (e.g., NaYF
4
) have shown
promise as host nanocomposite because of their
outstanding properties such as low phonon energy,
high transparency, and high stability (chemical and
thermal) (Chen et al., 2014). Moreover, Yb
3+
ions,
which show high two-photon absorption (~980 nm,
2
F
7/2
→
2
F
5/2
) as sensitizer, and other rare earth element
(Er
3+
) have been effectively used as an efficient
activator for the fabrication of UCNP (Wen et al.,
2018). The photon energy is effectively transferred
from Yb
3+
ions to activator ions after exposure with a
980-nm laser excitation (Zhou t al., 2015). The degree
of energy transfer can be optimized by precisely
controlling the fabrication of UCNP such as
hydrothermal reaction time and temperature,
concentration of sensitizer, activator and precursors
(Rafique et al., 2019a; Rafique et al., 2018). A recent
study briefly explained the current developments in the
functionalization of the UCNP with different
molecules such as polymers, silica, photosensitizers,
inorganic nanoparticles, and anticancer drugs, which
make them more biocompatible diagnostic and
bioimaging agents with high tumor targeting efficiency
(Rafique et al., 2019b). These excellent optical and
structural features render the UCNP well-suited
candidates for various biomedical applications such as
cancer therapy.
In this proceeding, we have synthesized water
dispersible NaYF
4
:Yb
3+
/Er
3+
UCNP using a facile
hydrothermal method (Choi et al., 2017). UCNP was
further functionalized with polyacrylic acid (PAA) to
increase their biocompatibility and stability. Finally,
the UCNP potential for use in practical bioapplications
has been verified through the cytotoxicity and in vitro
live cells imaging.
Rafique, R. and Park, T.
Photoluminescent Imaging for an Effective Cancer Diagnosis using Upconversion Nanoparticles.
DOI: 10.5220/0008691800230027
In Proceedings of the 13th International Joint Conference on Biomedical Engineering Systems and Technologies (BIOSTEC 2020) - Volume 2: BIOIMAGING, pages 23-27
ISBN: 978-989-758-398-8; ISSN: 2184-4305
Copyright
c
2022 by SCITEPRESS – Science and Technology Publications, Lda. All rights reserved
23
2 MATERIALS AND METHODS
2.1 Preparation of Nayf
4
:YB
3+
/Er
3+
UCNPs
The NaYF
4
:Yb
3+
/Er
3+
UCNPs were fabricated
according to the hydrothermal method previously
reported (Choi et al., 2017). Typically, Y(NO
3
)
3
∙6H
2
O
(1.66 mmol), Yb(NO
3
)
3
∙5H
2
O (0.46 mmol), and
Er(NO
3
)
3
∙5H
2
O (0.08 mmol) were added in a beaker,
and then sodium citrate (1.2 mmol) was mixed into the
above solution at room temperature for 30 min under
vigorous stirring to form a white citrate complex.
Subsequently, DI water (3 ml), ethanol (22.5 ml), and
CTAB (150 mg) were mixed into the citrate solution
while stirring continuously. After that, sodium fluoride
(16.0 mmol) was added dropwise to the solution, and
then magnetically stirred for another 2 h at room
temperature to form the crystal nuclei. Shortly
thereafter, nitric acid (1.5 ml) was added, and the final
solution was transferred to a Teflon-lined autoclave
and incubated for 8 h at 180 °C. The resulting particles
were collected by centrifugation (3,172 ×g) and
washed with DI water and ethanol. Next, the particles
were dried in a dry air oven at 60 °C.
2.2 Preparation of UCNP@PAA
The PAA-coated UCNPs were synthesized according
to a previously reported protocol (Kong et al., 2017).
Briefly, PAA (50 mg, MW=1800) was added to DI
water (9 ml), and the pH was adjusted to 8 using 0.2 M
NaOH at room temperature under vigorous stirring.
After that, UCNP dispersion (1 ml) was added
dropwise, and the final solution was stirred for another
5 h. Next, the water dispersion was dissolved in DEG
(10 ml), and the mixture was stirred at 105 °C for 1 h
to remove the water. Finally, the mixture was
transferred to the Teflon-lined autoclave and incubated
at 160 °C for 2 h. The particles were obtained by
centrifugation (20,138 ×g) and washed with DI water
and ethanol. Thereafter, the particles were dried in a
dry air oven at 60 °C.
2.3 Characterization
The size analysis of the synthesized particles was
carried out by FE-SEM (SIGMA, Carl Zeiss,
Cambridge, UK) at 5 kV accelerating voltage. XRD
patterns were measured with a Cu Kα radiation source
on a D8-Advance instrument at λ=1.54 Å (Bruker
AXS, Berlin Germany). The UV/Vis/NIR absorbance
spectrum was recorded on a Jasco instrument (V-670,
Tokyo, Japan). The UC luminescence spectra were
recorded under 980-nm irradiation by an Ocean Optics
spectrophotometer (FLAME-UV-Vis, Shanghai,
China). The UCNP solution samples (60 μg/ml in DI
water) were excited with 7 ns pulse width to get time-
resolved spectra from an optical parametric oscillator
(OPO) system pumped by Nd:YAG laser (GCR-150,
355 nm). The green and red emissions were detected at
540 and 655 nm, respectively with a photomultiplier
tube. The surface charge of the synthesized particles
was recorded using ELSZ-1000 zeta potential analyzer
(Otsuka, Japan). FTIR spectra of the resulting particles
were examined from 4000-500 cm
-1
on a FTIR
spectrometer (6600-FV, Jasco, Tokyo, Japan). Unless
otherwise stated, materials characterizations were
carried out at room temperature.
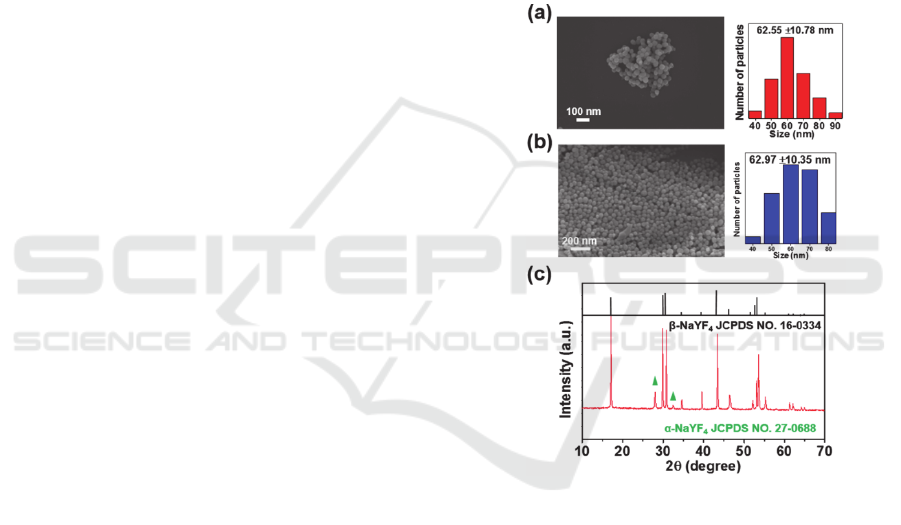
Figure 1: SEM images and size distribution analysis of (a)
NaYF
4
:Yb
3+
/Er
3+
UCNP (b) UCNP@PAA, and (c) XRD
analysis of the UCNP.
2.4 Cytotoxicity Assay of Particles
The toxicity effect of the UCNP and UCNP@PAA on
cell viability were examined in vitro using a MTT (3-
(4, 5-dimethylthiazolyl-2)-2, 5-diphenyltetrazolium
bromide) assay. The RWPE-1 (human prostate non-
tumorigenic cell lines) and LnCAP (human prostate
cancer cell lines) cells were grown in Roswell Park
Memorial Institute (RPMI) 1640 and Dulbecco's
Modified Eagle's Medium (DMEM), respectively,
supplemented with 1% antibiotics and 10% (v/v) fetal
bovine serum at 37°C in humidified conditions
maintained by passing 95% air and 5% CO
2
. The cells
were cultured onto a 96-well plate with 4×10
3
cells per
BIOIMAGING 2020 - 7th International Conference on Bioimaging
24
well. The plates were then incubated for 24 h at 37 °C
in the presence of 5% CO
2
to allow the cells to spread
and attach to the wells. The culture media were
removed and fresh media containing different
concentrations of UCNP and UCNP@PAA; each
concentration was set in triplicate for each cell line.
After different incubation times, MTT solution (1
mg/ml, 150 μl) was added to each well, and then cells
were kept at 37 °C under 5% CO
2
for another 4 h.
After, the color development was measured using a
UV-Vis-IR microplate reader (BioTek Synergy H1,
Winooski, VT, USA) at a detection wavelength of 540
nm.
2.5 In Vitro Cellular Imaging
To observe cell morphology, the HeLa cells (1 × 10
4
cells/ml) were treated with 100 μg of UCNP@PAA for
fluorescence imaging and incubated at 37 °C
for
various incubation times in a 5.0% CO
2
atmosphere.
After incubation, the cells were washed three times
with phosphate-buffered saline (PBS) to remove
unbound cells and particles. Fluorescence imaging of
the cells was performed using a bright-field
microscope (Jenoptik, Germany) under 980-nm laser
diode excitation (0.4 W/cm
2
).
3 RESULTS AND DISCUSSION
3.1 Characterization of UCNP and
UCNP@PAA
The surface morphology of UCNP and UCNP@PAA
was confirmed by SEM as can be seen by Fig. 1a and
b, respectively. The size distribution of the prepared
particles was analysed by counting 100 particles,
which demonstrated the uniformity and minimal
increase in the particle size after PAA coating (Fig. 1a
and b). The XRD analysis (Fig. 1c) shows high
intensity peaks of β-NaYF
4
(JCPDS no. 16-0334) and
two low intensity peaks of α-NaYF
4
(JCPDS no. 27-
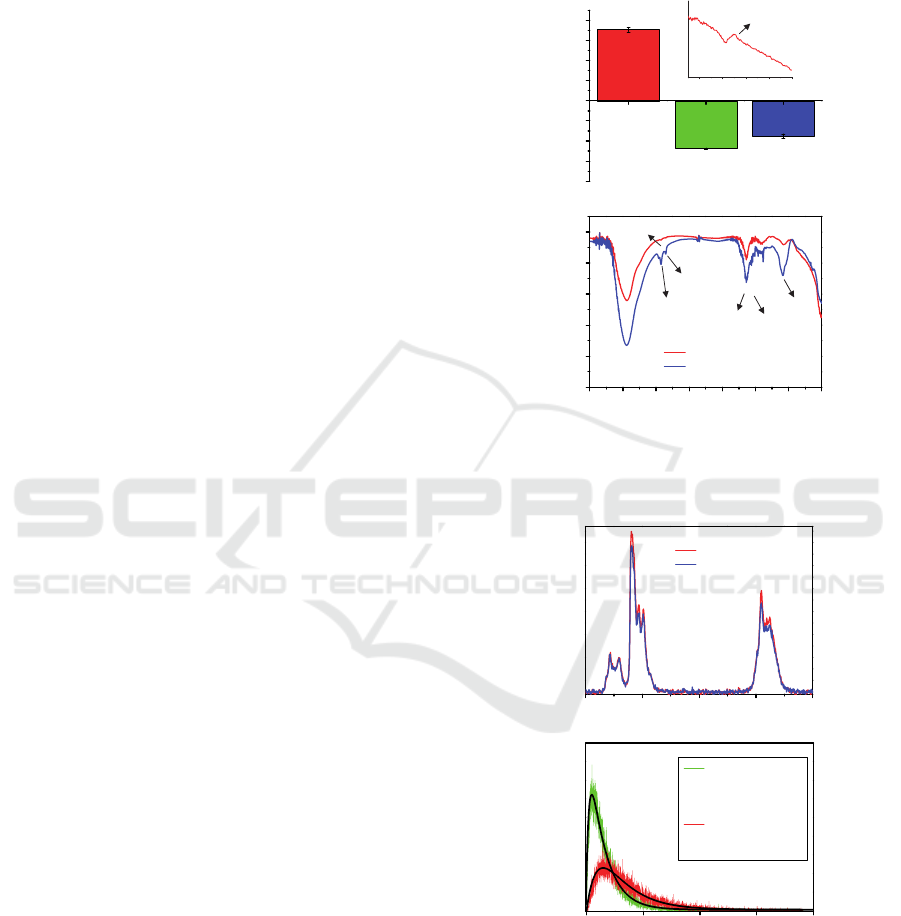
0688). The functionalization of PAA on the surface of
UCNP was further analysed by zeta potential (Fig. 2a).
The surface charge of the UCNPs was +36 mV, while
that of the UCNP@PAA was shifted to -18 mV (Fig.
2a). The UV/Visible spectrum of UCNP demonstrated
the absorbance of NIR light at 980 nm (Fig. 2a, inset).
Fig. 2b shown the FTIR spectra of the UCNP@PAA,
which confirmed the absorption bands of CH
2
, C=O,
and C-O originating from PAA at 2957, 1638, and
1563 cm
−1
, respectively (Kong et al., 2017).
The UC luminescence spectra exhibited strong
emission bands under 980 nm excitation wavelength
with 0.3 W/cm
2
laser power density (Fig 3a). The
emission wavelengths were examined from 400-800
nm. However, the prominent emission bands can be
allocated to the
2
H
11/2
→
4
I
15/2
(~527 nm), the
4
S
3/2
→
Figure 2: Characterization of the UCNP after
functionalization with PAA. (a) Zeta potential values; inset
shows the UV/Vis spectra of the UCNP, and (b) FTIR.
Figure 3: (a) NIR to visible UC luminescence spectra of
NaYF
4
: Yb
3+
/Er
3+
UCNP and UCNP@PAA, and (b) Time-
resolved emission spectra of UCNP at 540 nm and 655 nm
under 980 nm laser excitation.
4
I
15/2
(~540 nm), and the
4
F
9/2
→
4
I
15/2
(655 nm)
transitions in the Er
3+
ions (Dong et al., 2017; Shao et
al., 2014), as can be seen in Fig. 3a. The stronger
4000 3500 3000 2500 2000 1500 1000 500
50
60
70
80
90
100
T(%)
Wavenumber (cm
-1
)
UCNP
UCNP@PAA
(CH
2
)
(C-O)
(C=O)
(C-O)
(CH
2
)
(C-H)
-40
-30
-20
-10
0
10
20
30
40
Zeta potential (mV)
(b)
UCNP
PAA UCNP@PAA
900 1000 1100
Absorbance (a.u.)
980 nm
Wavelength (nm)
(a)
500 550 600 650 700
Intensity (a.u.)
Wavelength (nm)
UCNP
UCNP@PAA
(a)
0 1000 2000 3000 4000
Photolumeniscence intensity (a.u.)
Time (μs)
Green emission
τ(rise) = 49.275 μs
τ(decay) = 281.131 μs
Red emission
τ(rise) = 197.870 μs
τ(decay) = 448.924 μs
(b)
Photoluminescent Imaging for an Effective Cancer Diagnosis using Upconversion Nanoparticles
25
luminescence emissions may be due to the UCNP with
good morphology and β-NaYF
4
phase (Lin et al., 2014;
Wang et al., 2010). Fig. 3a (blue line) shows that the
UCNP maintained their UC luminescence intensity
even after being functionalized with PAA. Time-
resolved green and red emission spectra of UCNP were
analyzed at the prominent peaks 540 and 655 nm,
respectively under 980-nm laser excitation and with
0.05 W/cm
2
power density (Fig. 3b). The PL spectra
contained both decay and rise components indicating
photons of the emitting
4
S
3/2,
4
F
9/2
and
emitted
4
I
15/2
states,
respectively. The red emission states are
decayed slower as compared to green emitting states.
This might be the result of differences in the red and
green UC emission pathways (Jung et al., 2015).
3.2 Effect of Particles on Prostate Cells
Viability
The UCNP@PAA has potential as a bioimaging agent
because of their good UC luminescence efficiency and
morphology. Being functionalized with a natural
polymer, PAA, the particles posed the high
biocompatibility in biological environment (Rafique et
al., 2018). However, the assessment of cytotoxicity of
the nanomaterials is an important matter of interest in
bioimaging systems. For this purpose, the viability of
RWPE-1 and LnCAP cells after treatment with
different concentrations of UCNP and UCNP@PAA
(0-800 μg/ml) was observed using a standard MTT
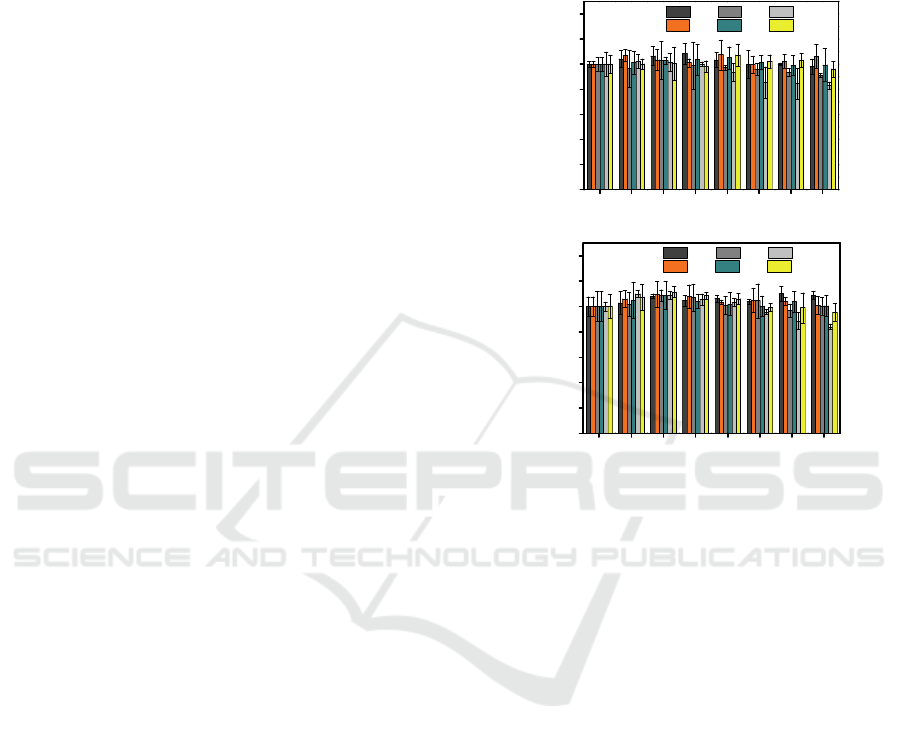
assay (Fig. 4). Interestingly, the incubation of UCNP
for 12 h showed negligible cytotoxicity (≈ 100%)
towards both RWPE-1 and LnCAP cell lines at all
concentration levels as compared to the control (Fig.
4). However, the cytotoxicity of both cell lines
decreased to ≈80% after treatment with higher dosages
of UCNP (> 200 μg/ml) for 24 and 48 h. On the other
hand, using UCNP@PAA, the viability of the RWPE-
1 and LnCAP cells was remained ≈100% even after
being exposed to 800 μg/ml UCNP@PAA for 12, 24
and 48 h, compared with the control. Hence, the
UCNP@PAA are more tolerated than the UCNP in
terms of cytotoxicity. The results suggested that
UCNP@PAA can be applied as imaging agents to
diagnose cancer.
3.3 UCNP@PAA as Bioimaging Agent
The HeLa cells were incubated for different reaction
times (1, 3, 5 h) with 100 μg/ml of UCNP@PAA, and
then visualized by fluorescence microscopy under 980
nm laser diode excitation (Fig. 5). The images showed
the successful internalization of the synthesized
UCNP@PAA through endocytosis process; bright
field green UC luminescence spots are mainly
observed in the cytoplasm of the HeLa cell lines
(
Gerelkhuu et al., 2018; Rafique et al., 2019a). Hence, the
UCNP@PAA has been promising as the live cell
imaging agents.
Figure 4: In vitro cytotoxicity of UCNP and UCNP@PAA
with different concentrations in (a) RWPE-1, and (b) LnCAP
after 12, 24 and 48 h incubation time.
4 CONCLUSIONS
In this study, NaYF
4
:Yb
3+
/Er
3+
UCNPs were fabricated
via a facile hydrothermal method with uniform
morphology, strong UC luminescence, and good
hexagonal phase for further application. Next, UCNP
were functionalized with PAA, the resulting
UCNP@PAA exhibited good UC luminescence and
improved cytotoxicity in RWPW-1 and LnCAP cells
compared to UCNP only, with the cell viabilities of
approximately 100% even at the high dosage of 800
μg/ml. We anticipated that UCNP with high hexagonal
phase intensity was responsible for their UC
luminescence efficiency, which proves them a
promising bioimaging agent for in vitro experiments.
In RWPW-1 and LnCAP cells, the UCNP@PAA
showed negligible toxicity and bioimaging capability.
Thus, this nanocomposite can be an excellent candidate
for drug delivery systems to cure the prostate cancer,
in future. Our results may lead to a major step forward
for use of the as-prepared particles in in vivo live cell
experiments and anti-cancer theranostic studies.
25 5012.5 100 200 4000800
25 5012.5 100 200 4000800
(a)
(b)
0
20
40
60
80
100
120
140
Cell Viability (%)
Concentration of nanoparticles
(
μ
g/ml
)
UCNP 12 h 24 h 48 h
UCNP@PAA
12 h 24 h 48 h
0
20
40
60
80
100
120
140
Cell Viability (%)
Concentration of nanoparticles
(
μg/ml
)
UCNP 12 h 24 h 48 h
UCNP@PAA
12 h 24 h 48 h
BIOIMAGING 2020 - 7th International Conference on Bioimaging
26
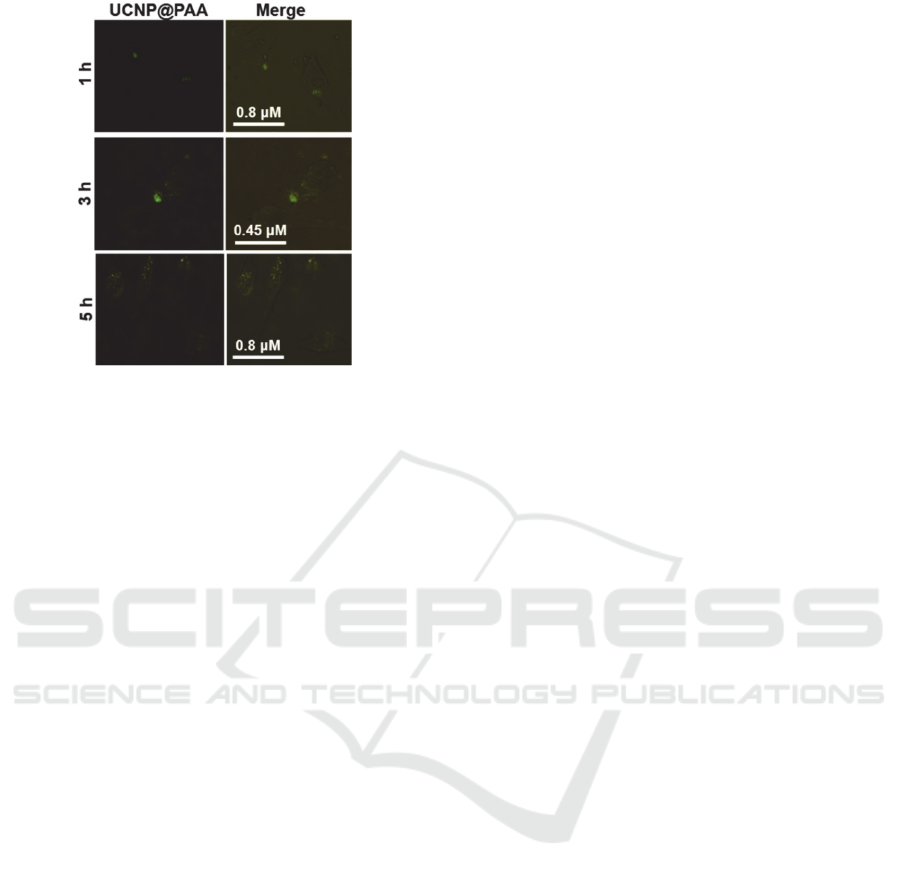
Figure 5: Fluorescence images of HeLa cells after incubation
with 100 μg/ml of UCNP@PAA for 1, 3, and 5 h under 980-
nm laser diode excitation (0.4 W/cm
2
). Left and right
columns represent the UC luminescence images of
UCNP@PAA and merged fluorescence images (bright field
and UC luminescence image), respectively.
ACKNOWLEDGEMENTS
This work was supported by Basic Science Research
Program through the National Research Foundation of
Korea (NRF) funded by the Ministry of Science and
ICT (MSI) (NRF-2017R1A2B4009581;
2018R1A4A1022647).
REFERENCES
Chen, G., Qiu, H., Prasad, P. N., Chen X., 2014.
“Upconversion nanoparticles: design, nanochemistry,
and applications in theranostics”. Chemical Reviews,
114(10), 5161-5214.
Choi, S. Y., Baek, S. H., Chang, S. -J., Song, Y., Rafique, R.,
Lee, K. T., Park, T. J., 2017. “Synthesis of upconversion
nanoparticles conjugated with graphene oxide quantum
dots and their use against cancer cell imaging and
photodynamic therapy”. Biosensors and Bioelectronics,
93, 267-273.
Dong, H., Sun, L. -D., Feng, W., Gu, Y., Li, F., Yan, C. -H.,
2017. “Versatile spectral and lifetime multiplexing
nanoplatform with excitation orthogonalized
upconversion luminescence”. ACS Nano, 11(3), 3289-
3297 (2017).
Gerelkhuu, Z., Huy, B. T., Sharipov, M., Jung, D., Phan, T.
L., Conte, E. D., Lee, Y. I., (2018). “One-step synthesis
of NaLu
80
−xGdxF
4
:Yb
18
3+
/Er
23
+
(Tm
3+
) upconversion
nanoparticles for in vitro cell imaging”. Materials
Science and Engineering: C, 86, 56-61.
Jung, T., Jo, H. L., Nam, S. H., Yoo, B., Cho, Y., Kim, J.,
Kim, H. M., Hyeon, T., Suh, Y. D., Lee, H., Lee, K. T.,
2015. “The preferred upconversion pathway for the red
emission of lanthanide-doped upconverting
nanoparticles, NaYF
4
:Yb
3+
, Er
3+
”. Physical Chemistry
Chemical Physics, 17(20), 13201-13205.
Kong, W., Sun, T., Chen, B., Chen, X., Ai, F., Zhu, X., Li,
M., Zhang, W., Zhu, G., Wang, F., 2017. “A general
strategy for ligand exchange on upconversion
nanoparticles”. Inorganic Chemistry, 56(2), 872-877.
Lin, M., Zhao, Y., Liu, M., Qiu, M., Dong, Y., Duan, Z., Li,
Y. H., Pingguan-Murphy, B., Lu, T. J., Xu, F., 2014.
“Synthesis of upconversion NaYF
4
:Yb
3+
,Er
3+
particles
with enhanced luminescent intensity through control of
morphology and phase”. Journal of Materials Chemistry
C, 2(19), 3671-3676.
Rafique, R., Baek, S. H., Chang, S. -J., Gul, A. R., Park, T.
J., 2019a. “A facile hydrothermal synthesis of highly
luminescent NaYF
4
:Yb
3+
/Er
3+
upconversion
nanoparticles and their biomonitoring capability”.
Materials Science and Engineering: C, 99, 1067-1074.
Rafique, R., Baek, S. H., Park, C. Y., Chang, S. -J., Gul, A.
R., Ha, S., Nguyen, T. P., Oh, H., Ham, S., Arshad, M.,
2018. “Morphological evolution of upconversion
nanoparticles and their biomedical signal generation”.
Scientific Reports, 8(1), 17101.
Rafique, R., Kailasa, S.K., Park, T.J., 2019b. “Recent
advances of upconversion nanoparticles in theranostics
and bioimaging applications”. Trends in Analytical
Chemistry, 120, 115646.
Shao, B., Zhao, Q., Jia, Y., Lv, W., Jiao, M., Lü, W., You,
H., 2014. “A novel synthetic route towards monodisperse
β-NaYF
4
:Ln
3+
micro/nanocrystals from layered rare-
earth hydroxides at ultra low temperature”. Chemical
Communications, 50(84), 12706-12709.
Wang, F., Wang, J., Liu, X., 2010. “Direct evidence of a
surface quenching effect on size-dependent
luminescence of upconversion nanoparticles”.
Angewandte Chemie International Edition, 49(41),
7456-7460.
Wen, S., Zhou, J., Zheng, K., Bednarkiewicz, A., Liu, X., Jin,
D., 2018. “Advances in highly doped upconversion
nanoparticles”. Nature Communications, 9(1), 2415.
Zhang, K. Y., Yu, Q., Wei, H., Liu, S., Zhao, Q., Huang, W.,
2018. “Long-lived emissive probes for time-resolved
photoluminescence bioimaging and biosensing”.
Chemical Reviews, 118(4), 1770-1839.
Zhou, B., Shi, B., Jin, D., Liu, X., 2015. “Controlling
upconversion nanocrystals for emerging applications”.
Nature Nanotechnology, 10(11), 924.
Zhou, J., Liu, Q., Feng, W., Sun, Y., Li, F., 2014.
“Upconversion luminescent materials: advances and
applications”. Chemical Reviews, 115(1), 395-465.
Zhou, J., Liu, Z., Li F., (2012). “Upconversion
nanophosphors for small-animal imaging”. Chemical
Society Reviews, 41(3), 1323-1349.
Photoluminescent Imaging for an Effective Cancer Diagnosis using Upconversion Nanoparticles
27
