
Analysis and Application of Semantic Networks in Education
Arnold E. Kiv
1,3 a
, Vladimir N. Soloviev
2 b
, Elena Yu. Tarasova
2 c
, Tetyana I. Koycheva
3 d
and
Katrina V. Kolesnykova
3 e
1
Ben-Gurion University of the Negev, P.O.B. 653, Beer Sheva, 8410501, Israel
2
Kryvyi Rih State Pedagogical University, 54 Gagarin Ave., Kryvyi Rih, 50086, Ukraine
3
South Ukrainian National Pedagogical University named after K. D. Ushinsky, 26 Staroportofrankivska Str., Odessa,
65020, Ukraine
Keywords:
Semantic Knowledge Network, Course Concept, Topic Adjacency Matrix, Gephi.
Abstract:
The basis of any discipline is a set of didactic units. The task of the educational process management apparatus
is to ensure compliance with the requirements for the order of the didactic units and their full implementation
within the framework of the formation of the curriculum while minimizing its duration. A significant difficulty
is the logical linking of didactic units with each other, since it is impossible to break the logic of presentation of
materials of one discipline and there is a relationship between didactic units of different disciplines. The paper
compares the topological characteristics of the concept graphs related to various disciplines. We develop the
algorithm to implement the subject area model in the form of a semantic knowledge network. 125 concepts are
analyzed that provide optimal mastering disciplines and establish the connection between them. A survey of
the dynamics of the popularity of the term “network science” from 2004 to 2020 using Google Trends showed
a steady trend of user interest. On average, 80 requests are executed (calculated in arbitrary units), with the
largest volume of requests being 100.
1 INTRODUCTION
Education is the foundation of sustainable develop-
ment and the main tool for creating a humane, equal
and attentive society to human problems, in which
each individual should have his or her human dignity.
Obviously, the main reason for the emergence of ed-
ucation for sustainable development is the awareness
of the need for changes in the educational paradigm
in order to further sustainable development of soci-
ety, the economy and preservation of the environment.
Sustainable development education involves a transi-
tion to an economically and socially oriented learning
model. This model should be based on broad interdis-
ciplinary knowledge, which is based on an integrated
approach to the development of society, and allows
making and implementing decisions at the local and
global levels. All these steps are aimed at improving
the quality of life and do not threaten the ability of
a
https://orcid.org/0000-0002-0991-2343
b
https://orcid.org/0000-0002-4945-202X
c
https://orcid.org/0000-0002-6001-5672
d
https://orcid.org/0000-0002-5518-4260
e
https://orcid.org/0000-0002-4818-5580
future generations to meet their needs.
Many researchers consider the problems of edu-
cation modernization in the framework of sustainable
development. In recent years, the interest in research
concerning Education for Sustainable Development
(ESD) has grown considerably. In research (Grosseck
et al., 2019) using a bibliometric approach, analyzed
1813 papers on the subject, indexed by the Web of
Science, between 1992 and 2018. The number of pub-
lications, authors, and journals has increased, proving
that ESD has gained momentum over the period ex-
amined in the study. In study (Grosseck et al., 2019)
illustrates two main research directions for the entire
time span: integration of education into sustainable
development and of sustainable development into ed-
ucation. In study (Holfelder, 2019) is to show that
education must be thought of as something other than
just training: considering education predominantly as
subjectification holds the possibility for open and al-
ternative futures. that education is more than train-
ing. The main message – education is more than
training. Evaluation case studies in (Eilks, 2015)
show that thoroughly combining the ESD framework
with science teaching that follows a socio-scientific
416
Kiv, A., Soloviev, V., Tarasova, E., Koycheva, T. and Kolesnykova, K.
Analysis and Application of Semantic Networks in Education.
DOI: 10.5220/0010924800003364
In Proceedings of the 1st Symposium on Advances in Educational Technology (AET 2020) - Volume 1, pages 416-431
ISBN: 978-989-758-558-6
Copyright
c
2022 by SCITEPRESS – Science and Technology Publications, Lda. All rights reserved

issues-based approach to education has great poten-
tial for helping students develop many general educa-
tional skills. In articles (Byrch et al., 2015; Morioka
et al., 2006) has laid out the initiatives to contribute
to global sustainability through reform and streamlin-
ing of the current technological paradigm and busi-
ness. This reform is based on a future-oriented and
global approach. In this initiative, industry and busi-
ness plays a critical role as a link between technol-
ogy, business and society. Leicht et al. (Leicht et al.,
2018) presents an overview of ESD and highlights
key issues related to ESD policy and practice. Topics
include key ESD competencies and themes, policy,
changes in the learning environment, teacher training,
youth as lead actors, scaling-up action, and the moni-
toring of progress.
The epidemics, the destruction of the natural en-
vironment and climate change, the depletion of ma-
terial and energy resources, the population explosion
and lack of food, as well as the civilization crisis as
a whole, are complex interdisciplinary problems of
the humankind. New directions of science appear for
their solution. The convergence of methods and inter-
disciplinary approaches is the main characteristic of
these advanced scientific communities.
Supra-sectorial technologies (information, cogni-
tive, nano-, bio-, social technologies) are currently
actively developing. Thanks to them, new branches
of science appear and serve as a new methodologi-
cal basis for studying nature (Arshinov et al., 2011;
Ahromeeva et al., 2013; Kovalchuk, 2011). Such in-
terdisciplinary scientific fields lead to new directions
in science such as risk management, sustainable de-
velopment, new nature management, etc.
The quality of professional training of students in
the modern sense determines their readiness and abil-
ity to use the acquired professional competencies to
solve not only professional tasks, but also multidisci-
plinary tasks. Solving such problems contributes to
sustainable development at the level of the country,
region and the world as a whole. This implies updat-
ing the content and methods of professional training
of specialists at a modern university taking into ac-
count the requirements of interdisciplinary integration
and the implementation of sustainable development
ideas (Shults and Tsyiganov, 2010; Solodova and Ma-
linetskiy, 2013).
The work (Chekmarev, 2014) emphasizes that the
competitive professional competence of university
graduates in the labor market in the light of inter-
national requirements can be achieved subject to sig-
nificant changes in the system of higher professional
school. The articles (Sirenko, 2014, 2013) presents
the ways of enriching the content of the academic dis-
cipline “Fundamentals of Information Technologies”
with interdisciplinary components. The diffuse prin-
ciple of penetration of general scientific and philo-
sophical knowledge into the content of the academic
discipline is substantiated. The characteristics of gen-
eralized tasks as a means of interdisciplinary integra-
tion are given. The results of experimental work on
checking the effectiveness of the method of using gen-
eralized problems are analyzed.
Interdisciplinary integration in higher education
institutions has to be an important component of
introducing sustainable development ideas into the
training of modern specialists. The problems of sus-
tainable development itself are multidisciplinary.
Such integration will solve the significant contra-
dictions of education, namely the contradiction be-
tween the vast knowledge and limited human possi-
bilities. The optimal combination of computer sci-
ence and other academic disciplines within the same
topic will provide conditions for a significant increase
of the level of the educational process.
Jurgena and Cedere (Jurgena and Cedere, 2018)
concluded that students have a large non-used po-
tential to understand more deeply the nature of sci-
ence and acquire the knowledge important for their
future lives and work. Recently, a lot of talk has
been going on about the transition to a knowledge-
based society. Knowledge management systems are
evolving and knowledge management professionals
are employed in large corporations. Unfortunately,
in the discussions of this topic higher education is
not considered (Kumar and Agrawal, 2011; Boca and
Mukaj, 2016). This is unacceptable, because knowl-
edge is created, systematized and accumulated in uni-
versities, and then passed on to the next generation of
people.
The learning process is the management of the
process of student’s knowledge accumulation and sys-
tematization. Only a few researchers focus their at-
tention on this fact (Martins et al., 2019; Fazey et al.,
2013; Sanguankaew and Ractham, 2019; Vlasenko
et al., 2021). An automated learning environment
based on semantic knowledge networks is largely ca-
pable of solving a wide range of knowledge manage-
ment tasks at the university. A feature of the mod-
ern stage in the development of educational systems is
the necessity of expending the use of formal methods
for presenting knowledge and organizing the learning
process. The achievements of cybernetic, synergetic
and the theory of artificial intelligence are the basis of
these scientific directions. Many objects of cognitive
research are networks. Alternatively, you can imagine
them like that.
In the 1940s, scientists who study the human brain
Analysis and Application of Semantic Networks in Education
417

hypothesized that its unique properties are due not
to the characteristics of individual nerve cells, but to
the structure of the connections between them (Se-
merikov et al., 2018). To date, research on networks
of a very different nature – biological, physical, social
and economic – has been collectively called network
science, or the science of networks.
Over the past two decades, many studies have
focused on the network science methodology as an
extensive scientific field of studying complex sys-
tems (for example, (Malineckiy, 2013; Barrat, 2008;
Soloviev et al., 2016; Liu et al., 2010)). Complex
systems contain several components that interact with
each other, producing complex behaviour.
The human brain and the cognitive processes oc-
curring in it are an example of a complex system.
These processes provide memory and language (for
example, (Sporns, 2011; Baronchelli et al., 2013;
Beckage and Colunga, 2015; Jones, 2016; Sol
´
e et al.,
2010; Wulff et al., 2019; Boccaletti et al., 2006;
Borge-Holthoefer and Arenas, 2010)). The founda-
tion of network science is mathematical graph theory.
It is contains powerful quantitative methods for study-
ing systems such as networks (for example, (Carring-
ton et al., 2015)).
At this stage in the development of the educa-
tion system, the priority is to find ways to improve
the learning process, its content and structure. Re-
ceiving a fundamental and holistic education can be
only as result of the learning process at the level of
new quality. In this case, the content of various disci-
plines should reflect the logic and structure of knowl-
edge ties between disciplines. In the absence of inter-
subjective communications, the knowledge will be
fragmentary, unsystematic. Cognitive networks are
not only a tool for cognition, but can also a basis for
controlling student’s knowledge.
In different historical periods, many variants of
semantic knowledge networks that take into account
the specifics of intellectual activity have been cre-
ated. In the “precomputer era” the prototype of se-
mantic knowledge networks was used to formalize
logical reasoning. At the beginning of the twentieth
century, in psychology, graphs were first used to rep-
resent hierarchies of concepts and inherit properties,
model human memory and intellectual activity. In the
early 60-s the first machine implementations of se-
mantic networks were made. One of the first systems
of practical importance (Masterman, 1961) contained
100 primitive types of concepts for solving the prob-
lem of automatic translation. Dictionary of 15 000
concepts was defined.
At present, semantic knowledge networks are
widely used in solving many different problems, in
particular when building knowledge bases, in prob-
lems of machine translation and processing of text in
a natural language. Due to the wide range of use of
such graphs, there is a need for their refinement – an
increase in the number of nodes and an increase in the
connectivity between them.
Actual modern studies are devoted to the use of se-
mantic networks in the field of education. For exam-
ple, in the work (Xie et al., 2015) the interdisciplinary
of applied mathematics is quantitatively analyzed by
using statistical and network methods on the corpus
PNAS 1999–2013. Czerkawski (Czerkawski, 2014)
discusses the potential Semantic Web for teacher ed-
ucation.
Dunn (Dunn, 2013) presents a theoretical method
for the integration of semantic knowledge network
utilization into the classroom. This paper will also in-
troduce insights from Cognitive Linguistics as to how
the brain best learns vocabulary. The method of Dunn
(Dunn, 2013) springs from the fields of psychology
and neuroscience as well as inspiration from educa-
tors who are building new teaching styles. The pur-
pose of the method detailed in this paper is to inspire
other educators to incorporate cognitive linguistic in-
sights into their classes as well as further the discourse
on integrating this field into the teaching of English as
a second or foreign language.
Teng et al. (Teng et al., 2012) formulate recipe
recommendations using ingredient networks. Re-
searchers have shown how information about cooking
can be used to glean insights about regional prefer-
ence sand modifiability of individual ingredients, and
also how it can be used to construct two kinds of net-
works, one of ingredient complements, the other of
ingredient substitutes. These networks test which in-
gredients work well with each other and which ones
are better to replace. Allows you to predict which of
a pair of related recipes will work best for the user.
Traditionally, researchers formed networks of se-
mantic knowledge manually. This is labour intensive.
Such networks contain a small number of nodes, but
they have an important advantage - they are checked
manually. An alternative approach is the automatic
construction of a semantic network based on an exter-
nal source generated by Internet users (Zesch et al.,
2008). A striking example of such a source is the
Wiktionary (Wiktionary Statistics, 2020).
In (Kiv et al., 2014) a new stylistic-mathematical
approach (SMA) for analysis of translation works was
introduced. It was postulated that the important re-
quirement to translation is its compliance with the
language in which the translation was done from the
point of view of Zipf’s laws and information charac-
teristics. According to SMA any translation should
AET 2020 - Symposium on Advances in Educational Technology
418
satisfy at least to the following requirements:
• The sense of the translation version must exactly
reflect the intention of the author of original text.
• It is necessary to find the equivalent constructions
in the translation version for idioms and other spe-
cific expressions in the original text.
• The translator should reach the appropriate differ-
ence between Zipf’s constants for the original text
and for the translation.
A computer program for application of Zipf’s
Laws was developed for analysis of English and Rus-
sian literary texts. This program uses the algorithms
of texts data processing from the Microsoft products,
such as Microsoft C#, Microsoft SQL 2008. The Mi-
crosoft SQL 2008 was chosen because it is enough
powerful full-text modules, realized on more than
10 languages, The algorithm realized in the devel-
oped program allows processing any texts in order to
present them as tables of database with necessary pa-
rameters. As a result of uniting capabilities of these
products, the client-server structure of the program,
where the program is a client and Microsoft SQL2008
is a server was obtained. The user enables to specify
a set of search criteria. The program gets the answers
and outputs from the server in the comfortable to user
form.
This program was applied to compare different
translations of the famous play of William Shake-
speare “Hamlet. Prince of Denmark” (Shakespeare,
1985). Various characteristics of this work given by
critics were accounted. They analyzed these trans-
lations from the point of view of the exact reflec-
tion of Shakespeare’s ideas, preservations of original
thoughts, and the quality of the translation language.
Then Zipf’s constants were estimated for the original
text and translations taken from (Shakespeare, 1985)
(Edition of 1828). In table 1 one can see the obtained
results.
We see that table 1 Zipf’s constants are varied
from 0.0954 (that is close to English language) to
0.0684 (that is close to Russian language). On the ba-
sis of these results and semantic analysis performed
by other researchers it was come to conclusion that
the translation of Pasternak satisfied the conditions of
the high level translation described above. His trans-
lation is the most closely to the native Russian lan-
guage. At the same time in this translation Pasternak
reproduced the music and the spirit of Shakespeare’s
masterpiece (Shakespeare, 1985). The opposite trans-
lation approach we see in the Radlova’s translation.
She tried do not omit any word in the original text.
As a result she did not reproduce in Russian version
the sense of Shakespeare’s work and her text is closer
to the structure of English language.
Thus, all of these works are devoted to the in-
tegration of semantic knowledge networks in teach-
ing. The increasing information volumes of the edu-
cational material of the disciplines dictate the need to
use cognitive modelling to solve complex problems of
training and teaching.
2 MATERIALS AND METHODS
There are various ways of representing knowledge, in
particular, such visual methods for describing knowl-
edge in the subject field: semantic networks, graphs
of conceptual dependencies, scripts, frames, concep-
tual graphics and ontology.
Ontologies are an effective means of representing
and organizing knowledge. For the formal specifi-
cation of concepts and relationships, researchers use
ontologies. Ontologies characterize a specific subject
area. Ontology consists of terms (concepts), their def-
initions and attributes, as well as associated axioms
and inference rules.
Formally, ontology is a relation:
O =< T, R,F >,
where T – concepts (terms) of the subject area de-
scribed by the ontology O, R – relationship between
terms of the subject area, F – functions of interpreta-
tion, given on terms and relations of the ontology.
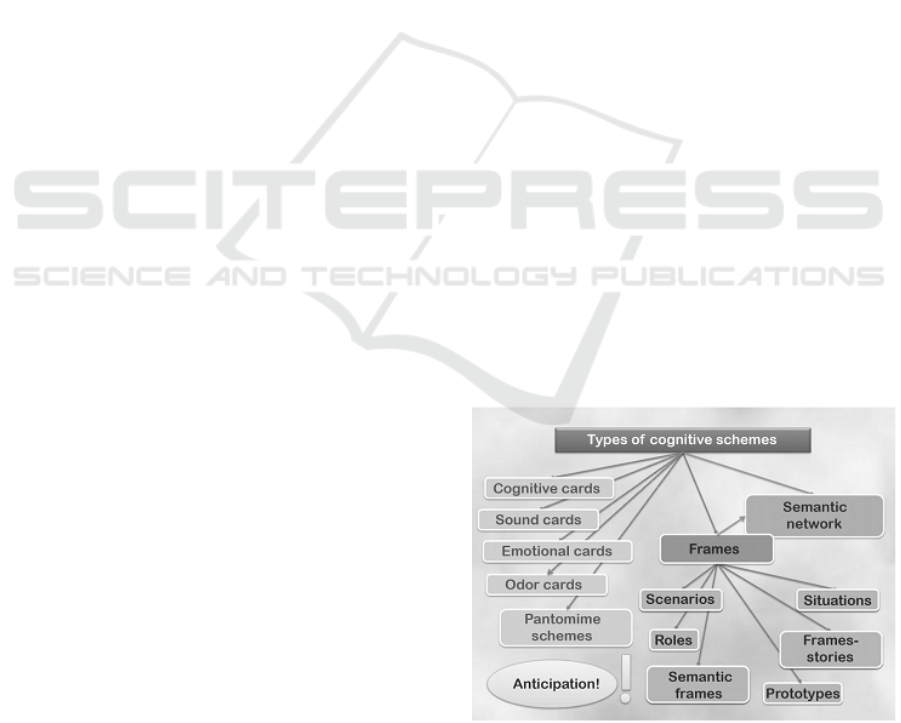
Let us determine the definitions that are important
for this work: “semantic knowledge network”, “se-
mantic network”, “network model”, “cognitive map”,
“cognitive network”, “cognitive scheme”. Figure 1
shows a diagram of the types of cognitive schema.
Figure 1: Cognitive scheme type chart.
Cognitive maps are a concept of cognitive psy-
chology pioneered by Tolman (Tolman, 1948). A cog-
nitive map is an active, information-seeking structure.
Analysis and Application of Semantic Networks in Education
419
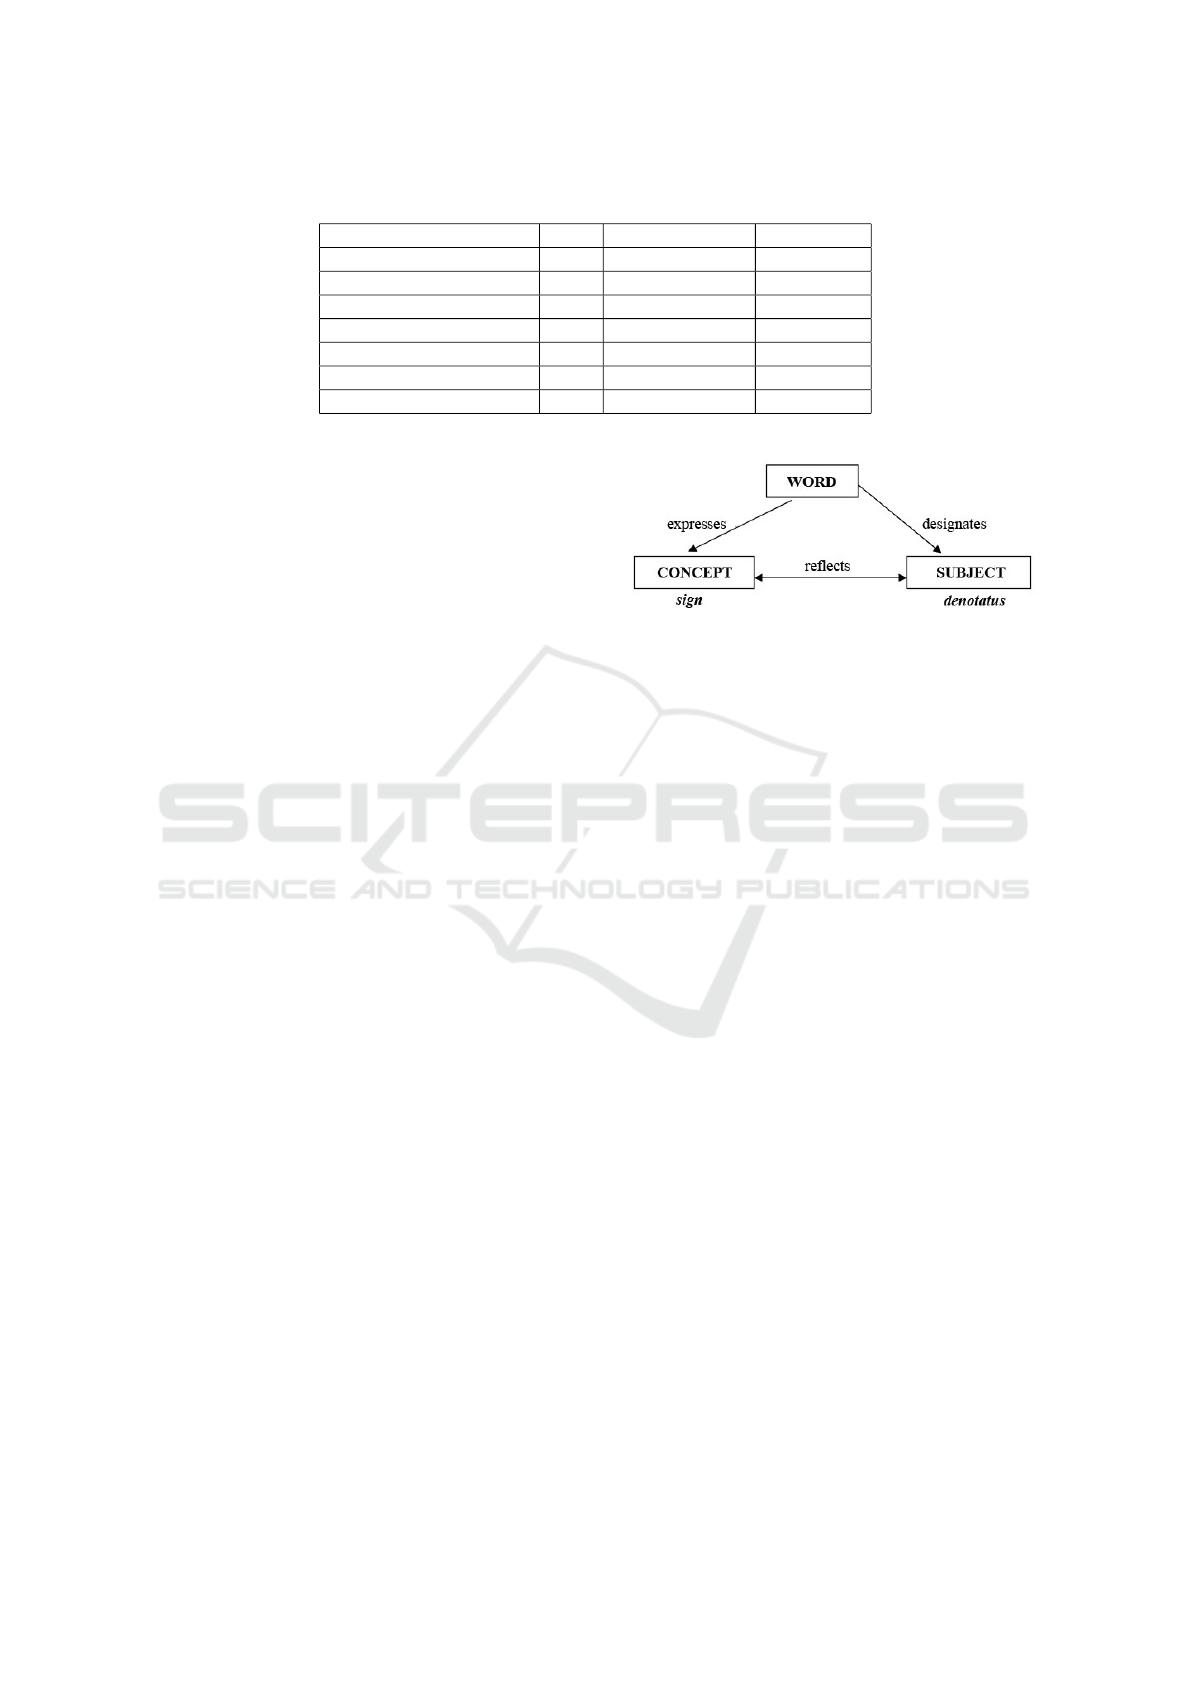
Table 1: Zipf’s constants for different translations of “Hamlet. Prince of Denmark”.
Author and translators Year Zipf’s constant Comments
Shakespeare 1603 0.1191 Original
Pasternak 1940 0.0684 Translation
Romanov 1899 0.0882 Translation
Averkiev 1895 0.0827 Translation
Kroneberg 1925 0.0837 Translation
Lozinski 1933 0.0877 Translation
Radlova 1937 0.0954 Translation
In our work, the concepts of “semantic knowledge
network” and “semantic network” are identical.
In cognitive science, the network is one of the
most common types of information models. Typi-
cally, a network consists of two components – nodes
as network elements and edges, reflecting the interac-
tion between the elements. Using these simple com-
ponents, you can describe a wide range of objects of
different nature and complexity. The network concept
is the foundation of network models. In such mod-
els, all relationships are clearly distinguished. These
relations constitute the framework of knowledge of
the subject area, the model of which must be cre-
ated. This class of models includes semantic net-
works, functional networks, and frames (frame rep-
resentation).
Although the terminology and structure are differ-
ent, there are similarities inherent in almost all seman-
tic networks:
• Different nodes of one concept belong to different
values, if not it is marked that they relate to one
concept.
• Edges of semantic networks create relationships
between concept nodes (marks above arcs indicate
the type of relationship).
• Relations between concepts can be linguistic
cases, such as “agent”, “object”, “recipient” and
“instrument” (others mean temporal, spatial, logi-
cal relations).
• The concepts are organized by level in accordance
with the degree of generalization.
An associative approach to knowledge represen-
tation defines an object value in terms of its connec-
tions (associations) with other objects. Thus, when a
person perceives an object and discusses it. At this
time, the brain maps the object of perception into a
certain concept (figure 2 (Babkin et al., 2006)). This
concept is part of general knowledge about the world.
Therefore, it is associated with various associations
with other concepts. Associations define properties
and behaviour of the perceived object.
Figure 2: The relationship of the concept, subject and word
denoting this subject (Babkin et al., 2006).
Scientists have developed semantic networks
within a scientific field that relates to the represen-
tation of knowledge to model human thinking. This
area of research has arisen within the general prob-
lem of artificial intelligence. It focuses on the devel-
opment of specialized languages and graphical tools
for representing declarative or static domain knowl-
edge. The results of research in the field of semantic
networks have been refined and successfully used in
the construction of conceptual models and relational
database schemes.
Semantic networks are the most powerful math-
ematical model for representing knowledge about a
subject area, one of the most important areas of arti-
ficial intelligence. Currently, the scientific literature
describes many alternative representations of seman-
tic network models. Researchers use them to solve a
variety of problems in a variety of software.
In general, a semantic network is an expression:
S = (O,R
1
,R
2
,... ,R
k
),
where O is a set of objects of a specific subject area,
R
i
|i = 1 .. .n is a set of relationships between objects,
i is the type of relationship.
In the general case, a semantic network is under-
stood as a certain graph G
s
= (V
s
,E
s
), in which the
set of vertices V
s
and the set of edges Es are divided
into separate types that have special semantics char-
acteristic of a particular subject area. In this situa-
tion, the set of vertices can correspond to objects or
entities of the considered domain and have the cor-
responding explicit names of these entities instead of
the vertex numbers. Such names should allow unam-
biguous identification of the corresponding objects,
AET 2020 - Symposium on Advances in Educational Technology
420

Figure 3: The relationship of various concepts in the human
mind (Babkin et al., 2006).
while there are no general formal rules for recording
names. There are also different types of edge sets that
correspond to different types of relationships between
entities in the area in question.
Many real-world phenomena can be modelling
with the help of a graph. For example, we can think
of various web pages as nodes and hyperlinks as di-
rected edges to represent the World Wide Web as a
graph. For instance, we can view various web-pages
as nodes and hyperlinks as directed edges to represent
the World Wide Web as a graph. Such a modelling
can help perform various graph computations on the
web. For instance, PageRank algorithm is a popular
graph algorithm, which is used to rank the web-pages.
Alternatively, the web-graph can be used to find clus-
ters of web-pages, which link one another. This can
help in categorizing the web-pages into various topics
(Cheramangalath et al., 2020).
Graphs are best suited for explicitly expressing as-
sociations between different concepts. Thus, in the
form of a semantic network, knowledge of the world
is expressed. A semantic knowledge network is a
marked graph in which nodes correspond to certain
facts or general concepts, and edges mean relation-
ships or associations between different facts or con-
cepts (figure 3 (Babkin et al., 2006)).
In each academic discipline (in every science) the
number of concepts reflecting the knowledge of this
discipline (this science) is finite. There are a number
of words that need to be conveyed to the audience.
The number of these words is not infinite, because
time for their transfer is limited. Textbooks establish
linear links between concepts.
A normalized description of knowledge networks
can be formulated as follows. The body of knowledge
of the studied discipline is a system (S). The elemen-
tary component that is part of S is a word that reflects
a certain concept. With the help of words, all the con-
cepts that make up the S system are recorded. Links
between the concepts are established using the gram-
matical rules of a particular language. With respect
to each concept from S, there is a primary sentence
that contains its definition. The totality of such defi-
nitions forms an invariant kernel S, which ensures the
unambiguity of the perception of knowledge within a
particular academic discipline. The invariant core of
the discipline uses words from other areas of knowl-
edge to determine its concepts. All concepts from S
are divided into main and auxiliary. The basic con-
cepts include specific concepts of this particular disci-
pline, which are the subject of its definition and study.
Supporting concepts include concepts borrowed from
other areas of knowledge that are not studied in this
discipline, but are used to determine the content of ba-
sic concepts. Many of the basic concepts of a particu-
lar discipline, together with the internal relationships
between them, form a hierarchically ordered network
of knowledge, the nodes of which are the identifiers
of the basic concepts.
Thus, the knowledge system can be represented in
the form of a hierarchical directed graph – a semantic
knowledge network.
The semantic knowledge network building algo-
rithm involves several steps:
(1) Writing all the basic terms of the subject area and
formulate their definitions (composing the the-
saurus of the subject area).
(2) Selecting the terms from the list that appear in the
definition of the other terms listed in step 1.
(3) At the lower (I) level, arranging the terms in the
definition of which the terms from the list are not
used.
(4) At the next (II) level, arranging the terms in the
definition of which the terms of level I are used.
(5) At the III level – terms in the definition of which
the terms of I and II levels are used, etc.
(6) At the last level, arranging terms that are not used
in the definition of other terms.
(7) Connecting the concepts.
Visualization of data in a structural network model
is the first step, but the strength of the method lies in
the ability to extract important knowledge about the
system through a statistical analysis of the network
topology. It seems that topology bears an evolution-
ary imprint and functional (Barab
´
asi, 2012). A de-
tailed analysis of the available metrics can be found,
for example, in (Barab
´
asi, 2016). Consider just a few
metrics often used in cognitive model research.
Let us consider in detail the network structure. A
network consists of nodes and links between them,
edges. Nodes are more or less stable entities that do
not change over time.
Edges represent relationships, interactions, trans-
actions, or any other temporary connections that oc-
cur between nodes over a certain period of the time.
Analysis and Application of Semantic Networks in Education
421

Edges represent connections between them: friend-
ships, proximity, transactions, exchanges and any
other temporary connections between stable objects
that occur with a certain frequency.
Edges are important to network analysis because
they represent the connectivity basis that will be using
to get insights about the complexity network. In a
graph database, the relationships between the data are
just as important as the data itself.
Giant component is an important notion in net-
work analysis. It’s an interconnected constellation
that includes most of the nodes in a network.
Clusters are the constellations of nodes that are
more densely connected together than with the rest
of the nodes in the network. Clusters represent differ-
ent sub networks within a network and can be used to
identify various subcategories that are present within.
In modern network theory, the number of node
connections (in the theory of graphs, nodes and nodes
are edges and vertices of a graph, respectively) is
called a degree. A node’s degree indicates how many
connections it has to the other nodes in the network.
The more degree a node has, the more “connected”
it is, which indicates its relative influence in the net-
work.
The concept of degree is a local characteristic of
a graph. A nonlocal, integral network structure is de-
fined by two concepts – a path and a loop or cycle.
A path is a sequential sequence of adjacent nodes and
the links between these nodes when the nodes do not
repeat. A loop or cycle is a path when the start and
end nodes coincide. Networks without loops are trees.
The number of nodes (N) (network size) and the num-
ber of links (L) are related as N = L − 1 (Soloviev
et al., 2016).
Identifying the nodes with the highest degree (also
called “hubs”) is an important part of network analy-
sis as it helps identify the most crucial parts of the net-
work. This knowledge can then later be used both to
improve network’s connectivity (by linking the hubs
together) and disrupt it (by removing the nodes).
Betweenness centrality is another important mea-
sure of the node’s influence within the whole network.
While degree simply shows the number of connec-
tions the node has, betweenness centrality shows how
often the node appears on the shortest path between
any two randomly chosen nodes in a network. Thus,
betweenness centrality is a much better measure of
influence because it takes the whole network into ac-
count, not only the local connectivity that the node
belongs to.
A node may have high degree but low between-
ness centrality. This indicates that it’s well-connected
within the cluster that it belongs to, but not so well
connected to the rest of the nodes that belong to the
other clusters within the network. Such nodes may
have high local influence, but not globally over the
whole network.
Alternatively, other nodes may have low degree
but high betweenness centrality. Such nodes may
have fewer connections, but the connections they
do have are linking different groups and clusters
together, making such nodes influential across the
whole network.
In network visualization, we often range the node
sizes by their degree or betweenness centrality to in-
dicate the most influential nodes.
Network topology is an important element of net-
work analysis. If we analyse networks on the struc-
tural basis we will discover many differences among
them. A tool for studying complex networks based on
graph theory is topological analysis.
When performing network analysis and visualiza-
tion it is important to classify the topology of the
network (Gephi, 2020a). This can be done through
quantitative analysis of degree distribution among the
nodes and/or through qualitative analysis using vari-
ous visual graph layouts.
Degree distribution can be a good indicator of the
network’s topology. If most of the nodes in the net-
work have exactly the same degree, the network is
more of a regular one (it may also indicate the pres-
ence of tree-like hierarchical system within the net-
work). If most of the nodes have an average num-
ber of connections that is the same and then some of
the nodes have more and some of the nodes have less
(normal bell-curve distribution of degree), we’re deal-
ing with a randomized network. Finally, if there’s a
small, but significant number of nodes with a high
degree and then degree distribution follows a long
tail towards a gradual decline (scale-free distribution),
this is a small-world network, where there’s a signif-
icant amount of well-connected hubs, which are sur-
rounded by less connected satellites, which form clus-
ters. Those clusters are connected to one another via
the hubs and the nodes that belong to several commu-
nities at once.
Graph layout a qualitative measure for identifying
topology of a network. A very useful type of layout
is Force Atlas, where the most connected nodes with
the highest degree are pushed apart from each other,
while the nodes that are connected to them but have
lower degree are grouped around those hubs. After
several iterations this sort of layout produces a very
readable representation of a network, which can be
used to better understand its structural properties and
identify the most influential groups, differences be-
tween them, and structural gaps within networks.
AET 2020 - Symposium on Advances in Educational Technology
422

Network motifs are the different types of constel-
lations that emerge within network graphs. They can
provide a lot of useful information about the structural
nature of networks.
For example, some networks may be comprised of
diads or pairs of nodes (which indicates that the level
of overall connectivity is quite low). Some other net-
works can have a high proportion of triads, which usu-
ally indicate the presence of feedback loops, which
makes the resulting network formations much more
stable. More complex formations include groups of
four nodes that can be connected as a sequence or
between each other, forming interconnected clusters
that can encode certain levels of complexity that go
beyond simple triad feedback constellations.
It is important to take notice of the network motifs
that emerge within a network because it will provide
a very good indication of the level of complexity and
thus the capacity of the network.
Modularity is a quantitative measure that indicates
the presence of distinct communities within a net-
work. If the network’s modularity is high, it means
it has a pronounced community structure, which, in
turn, means that there’s a space for plurality and di-
versity inside. If the modularity is too high, how-
ever, it might also indicate that the network consists of
many disconnected communities, which are not glob-
ally connected, making it much less efficient than an
interconnected one.
Modularity works through an iterative algorithm,
which identifies the nodes that are more densely con-
nected to each other than to the rest of the nodes
in the network. It will then calculate the measure
of modularity for the network at large. The higher
this measure is, the more distinct those communities
of densely connected nodes are. If the modularity
measure is 0.4 or above it means that, the commu-
nity structure in the network is quite pronounced. If
it’s less it means that there are no big differences be-
tween the different clusters and most of the nodes are
equally densely connected to each other across the
whole network.
So far we’ve looked at the different measures of
connectivity that exist within networks and that help
us identify the most influential nodes, clusters, and
deduce some basic functional properties of the net-
works we study.
However, one of the most important aspects of
network graphs is that they also let you see the gaps,
empty blank spaces, between the islands. Those gaps
are usually referred to as “structural gaps” and it has
been shown that bridging those gaps can spur innova-
tion, create most interesting collaborations, and give
rise to new, unexpected ideas.
In other words, “structural gaps” is where creativ-
ity and potential is hidden within the network. There-
fore, when visualizing a network it is important to
identify those structural gaps and to devise differ-
ent actions that could help bridge different nodes and
clusters across those empty spaces within the graph in
order to spur creativity and innovation.
3 RESULTS AND DISCUSSION
A study of the dynamics of the popularity of the term
“network science” from 2004 to 2020 using Google
Trends (Google, 2021), carried out at the time of writ-
ing this manuscript, showed a steady trend (figure 4).
Of queries, which hold an average of about 80 con-
ventional units, while the mark 100 corresponds to
the largest volume of requests.
As an example of modeling semantic knowledge
networks, we analyze the relationship between the
concepts of academic disciplines. As you know, that
discipline mastering is closely connected with the as-
similation and comprehension of the course concept
thesaurus. To assimilate further concepts within the
framework of this discipline, it is necessary to under-
stand the already learned, often in the framework of
the already studied disciplines. Therefore, an actual
task is to study the dependencies between concepts
and to model them, using cognitive networks (Gephi,
2020a).
The figure 5 shows a fragment of the construction
of a semantic knowledge network.
To implement the subject area model in the form
of a semantic knowledge network, we propose the fol-
lowing algorithm:
(1) Classification of all concepts of the subject
area into macro concepts (class of concepts),
meta-concepts (generalized concepts) and micro-
concepts (elementary concepts).
(2) The allocation of common properties, characteris-
tics inherent in each level of concepts.
(3) Highlighting the hallmarks of each level of con-
cepts.
(4) Establishing links between concepts related to the
same level.
(5) The allocation of inter-level ties.
We have analysed 125 concepts that are necessary
for the “Economic Cybernetics” discipline mastering
and the relationship between them (communication
means the need for one concept to master another).
We conducted a similar study for 125 concepts of the
Analysis and Application of Semantic Networks in Education
423
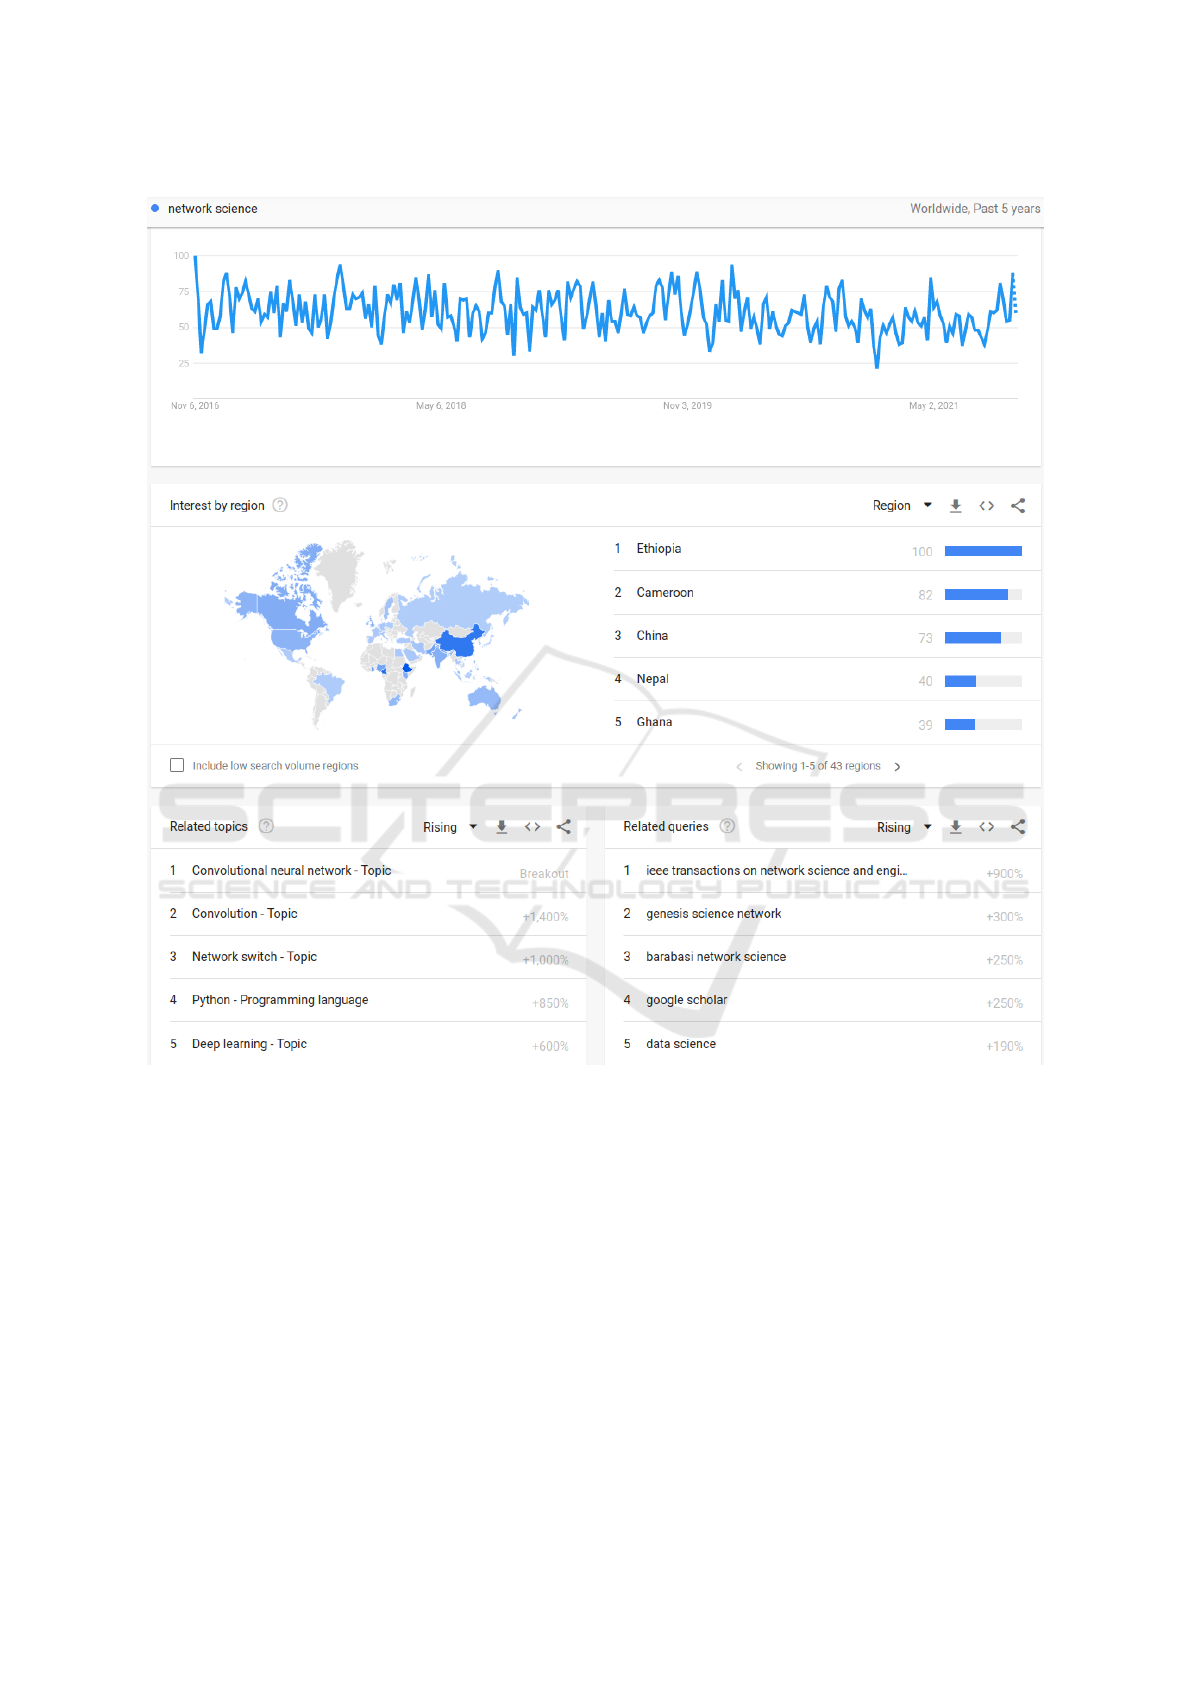
Figure 4: Dynamics of the popularity of the query “network science” in Google Trends (Google, 2021).
“Algorithmization and Programming” and 125 con-
cepts of the “Mathematical Analysis” discipline.
There are many systems used by analysts (mainly
researchers), both for visualizing network structures
and for performing computations. At the time of
this writing on Wikipedia (Wikipedia, 2021), we have
counted 89 links to various programs for analyzing
complex networks. To select the most popular pro-
grams, we turned to the analysis of software tools that
are used by the world’s leading universities (Gephi,
2020b; iGraph, 2021; NetworkX, 2021; SNAP, 2021).
These can be ready-made products with a user inter-
face and a set of implemented functions, as well as
libraries of computational methods. Some systems
developed for scientific research are briefly described
in the table. All considered systems, except Gephi,
do not have a user interface and are simply libraries
of computational functions for analyzing and visual-
izing graphs (table 2).
After a comparative analysis, the results of which
are presented in the table, the obtained graphs were
visualized using the Gephi software product (Yevin,
2010). Gephi is free open-source, leading visualiza-
tion and exploration software for all kinds of networks
and runs on Windows, macOS, and Linux. It is highly
interactive and user can easily edit the node/edge
shapes and colors to reveal hidden patterns. The aim
of the Gephi is to assist user in pattern discovery and
AET 2020 - Symposium on Advances in Educational Technology
424
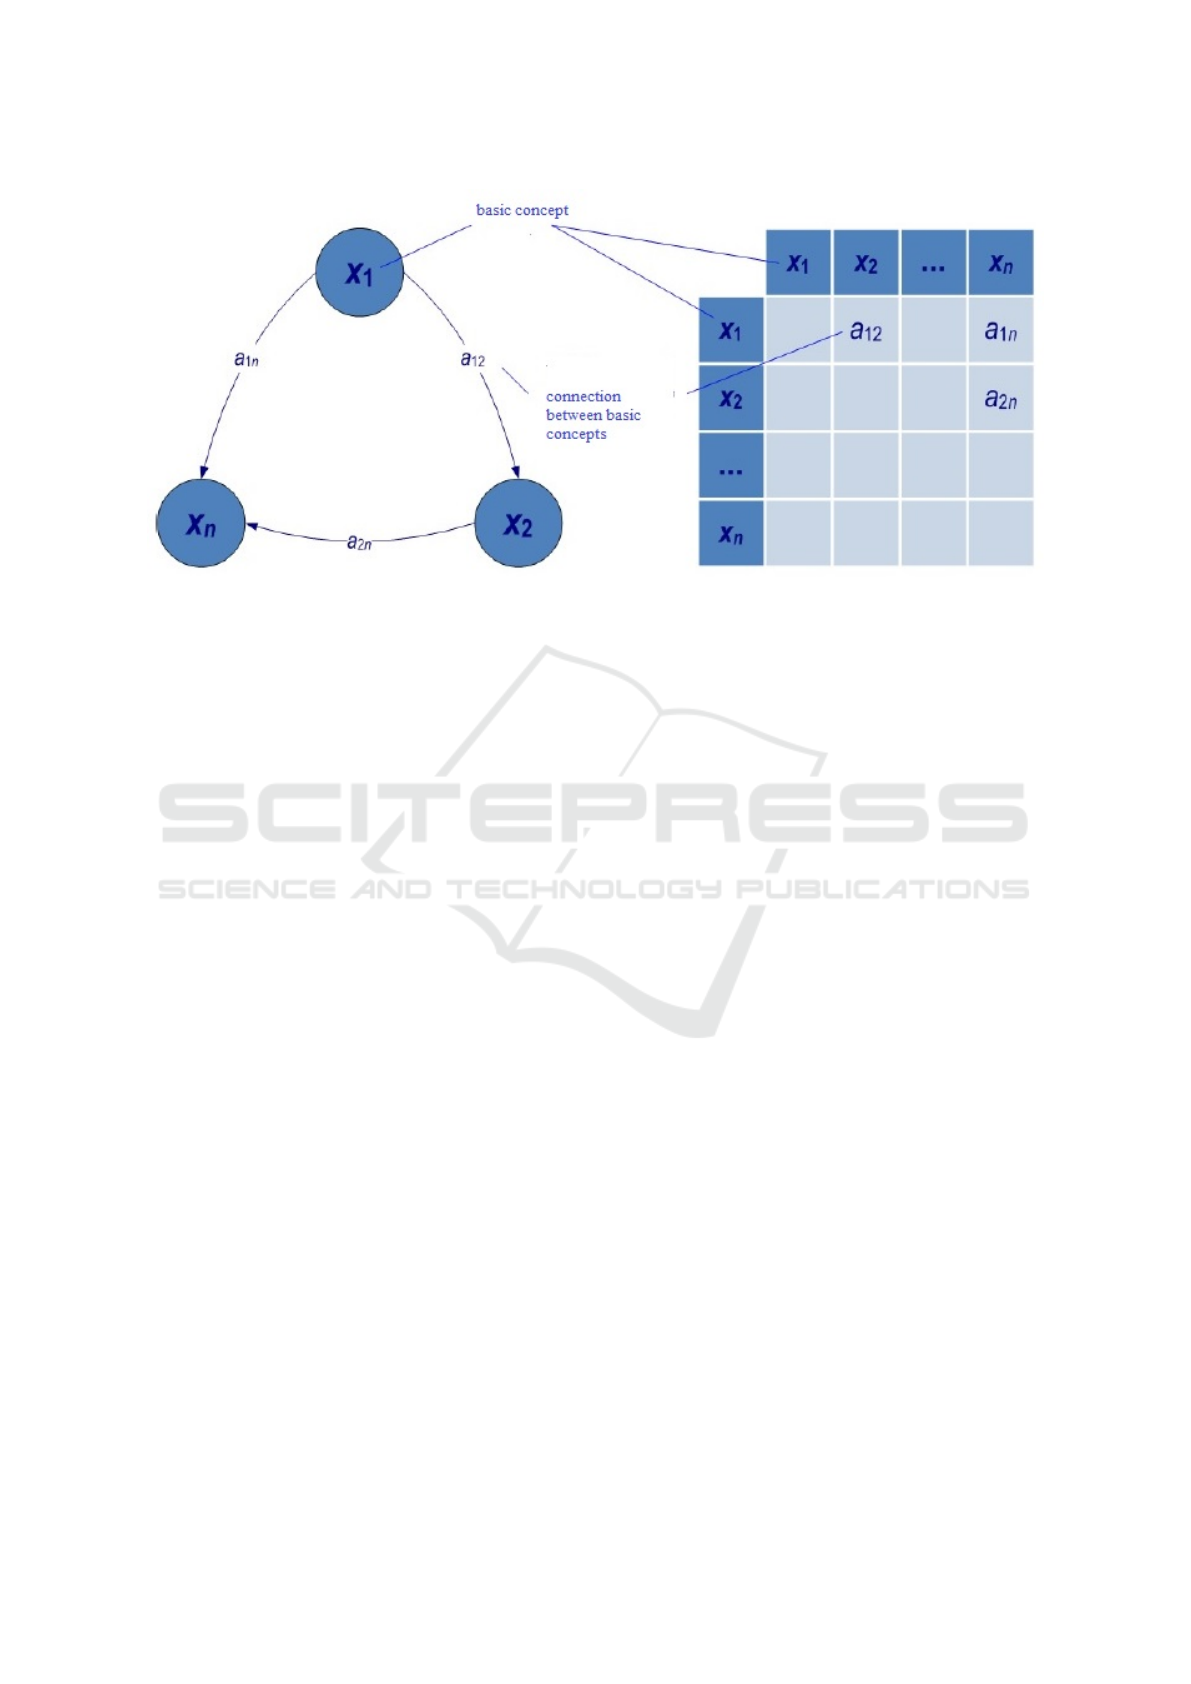
Figure 5: The semantic knowledge network diagram.
hypothesis making through efficient dynamic filtering
and iterative visualization routines.
Gephi allows to calculate the topological charac-
teristics of the graph, as:
• Nodes and edges (what networks are made of).
• Clusters (groups of nodes that are connected).
• Degree (the number of connections that the node
has).
• Centrality between (how influential a node is).
• Modularity (community structure).
Gephi comes with a very fast rendering engine and
sophisticated data structures for object handling, thus
making it one of the most suitable tools for large-scale
network visualization. It offers very highly appealing
visualizations and, in a typical computer, it can eas-
ily render networks up to 300 000 nodes and 1 000
000 edges. Compared to other tools, it comes with a
very efficient multithreading scheme, and thus users
can perform multiple analyses simultaneously with-
out suffering from panel “freezing” issues.
In large-scale network analysis, fast layout is a
bottleneck as most sophisticated layout algorithms
become CPU and memory greedy by requiring long
running time to be completed. While Gephi comes
with a great variety of layout algorithms, OpenOrd
(Martin et al., 2011) and Yifan-Hu (Hu, 2005) force-
directed algorithms are mostly recommended for
large-scale network visualization. OpenOrd, for ex-
ample, can scale up to over a million nodes in less
than half an hour while Yifan-Hu is an ideal option
to apply after the OpenOrd layout. Notably, Yifan-
Hu layout can give aesthetically comparable views to
the ones produced by the widely used but conserva-
tive and time-consuming (Fruchterman and Reingold,
1991). Other algorithms offered by Gephi are the cir-
cular, contraction, dual circle, random, MDS, Geo,
Isometric, GraphViz, and Force atlas layouts. While
most of them can run in an affordable running time,
the combination of OpenOrd and Yifan-Hu seems to
give the most appealing visualizations. Descent vi-
sualization is also offered by OpenOrd layout algo-
rithm if a user stops the process when 50–60% of
the progress has been completed. Of course, efficient
parameterization of any chosen layout algorithm will
affect both the running time and the visual result.
The constructed graphs (figures 6–8) can be used
to identify the most important concepts that have the
highest degree of apex, as well as concepts that are in
the way of studying other important course concepts.
In figures 6, 7 and 8 the size of the nodes-concepts
of semantic knowledge networks characterizes the de-
gree of importance and fundamentality of the corre-
sponding terms of the academic discipline.
The table 3 shows various metrics and methods for
calculating them. For the obtained graphs, their topo-
logical characteristics were calculated and analysed.
The results of the study are shown in table 4.
Let us analyse the found values of measures (ta-
ble 4). The Network Density measure is a measure
of the density of edges, calculated as the ratio of the
number of edges of a graph to the corresponding num-
ber of vertices and determines the maximum number
of edges in a given graph. Thus, the values 0.17 – for
the graph of discipline “Economic cybernetics” and
0.2 – for the “Mathematical Analysis” means that the
edges are filled with about 17.3% and 19.5% of the
maximum possible respectively. The density of the
Analysis and Application of Semantic Networks in Education
425

Table 2: Comparative characteristics of systems for analyzing network structures.
Gephi Igraph NetworkX SNAP
Website gephi.org igraph.sourceforge.net networkx.lanl.gov snap.stanford.edu
Users Scientific, Educational Organizations
Data Vol-
umes
Up to 1 million
nodes and edges
Up to several million nodes and edges
Data Col-
lection
None
Data
Sources
None
Analysis
Mode
Retrospective Analysis
Methods Visual Analysis,
Basic Statistical
Methods, Basic
Methods of Graph
Theory
A wide range of graph theory methods
Objects
Considered
Network structure (nodes, directional and non-directional links)
Distribution
Terms
OpenSource
(CDDL 1.0, GPL
3.0)
OpenSource
(GPL 2.0+)
OpenSource (BSD License)
Language
support
English
Developer Gephi Consortium
(more than 10 or-
ganizations). USA,
France, Germany,
etc.
G
´
abor Cs
´
ardi (Har-
vard University,
USA), Tam
´
as
Nepusz (E
¨
otv
¨
os
University, Hun-
gary)
AricHagberg, Dan
Schult, Pieter Swart
and others
Stanford University
Clients Used in research
projects, data vi-
sualization and
educational pro-
grams.
Used in research
projects
Scientific organiza-
tions
Used in research
projects, in partic-
ular by Stanford
University
graph of concepts of the discipline “Programming” is
less: 11%, which can be explained by a smaller num-
ber of connections between concepts on average in the
graph.
The maximum degree of 121 vertices was demon-
strated by the concept graph in the “Programming”.
The maximum value of the degree of the vertex in
the column “Economic cybernetics” – 111. The mini-
mum degree of vertices in the graphs “Economic Cy-
bernetics” and “Programming” are 3 and 1, respec-
tively, which are almost the same. For “Mathematical
Analysis”, the number of weakly connected nodes is
higher – 7, and strongly connected – 113, which is
less than in “Programming”, but more than in “Cy-
bernetics”.
It also confirms a greater connection between the
concepts of the “Economic cybernetics” and “Pro-
gramming” than the concepts of the “Mathematical
Analysis”.
Mean average node degree for the “Economic Cy-
bernetics” graph is 21.45, and for the “Programming”
graph – it is 13.66 and for the “Mathematical Anal-
ysis” – 24.18. This is confirms the presence of more
connections in the last graph.
The global clustering coefficient (clustering) for
a graph is the ratio of the number of vertically con-
nected triples of vertices to the number of triangles
(cyclically connected triples of vertices). For the
“Economic Cybernetics” graph, the clustering coeffi-
cient is 0.4, for the “Programming” graph – it is 0.33,
and for the “Mathematical Analysis” – 0.59. This
means that the concepts of the “Mathematical Anal-
ysis” course are more often on the path to mastering
other important concepts.
AET 2020 - Symposium on Advances in Educational Technology
426
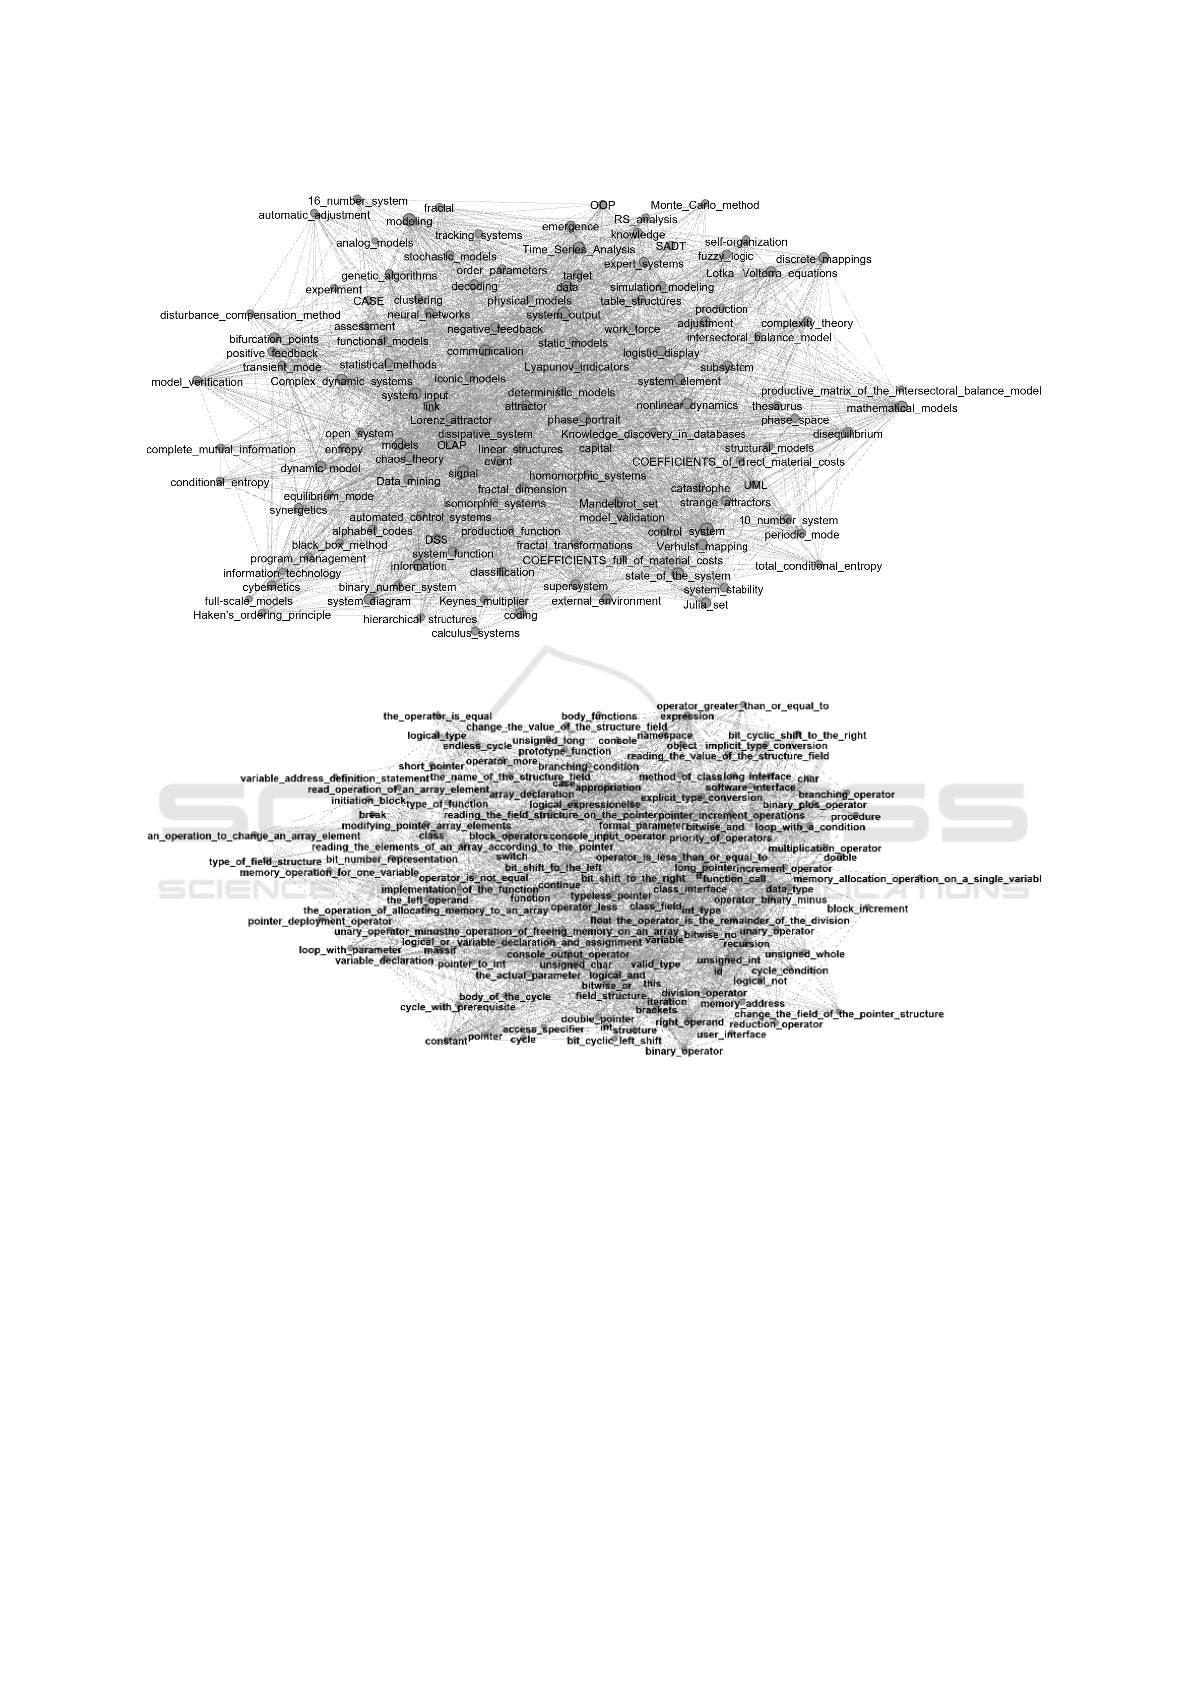
Figure 6: The semantic knowledge network of the course concepts “Economic Cybernetics”.
Figure 7: The semantic knowledge network of the course concepts “Algorithmization and Programming”.
As for the diameters of the graphs – for the “Eco-
nomic Cybernetics” concept graph the diameter value
is 5, for the “Programming” graph – 9 and for “Mathe-
matical Analysis” – 3. The same relationships are ob-
served for average shortest path-lengths. Which may
mean the existence of longer paths in the connections
between the “Programming” discipline concepts.
The modularity index is less than 0.4, which
means that the structure of communities in all three
networks is not sufficiently expressed.
In the field of education, there is always a problem
of the contradiction between increasing the amount of
scientific information and limiting the time allotted
for its assimilation. Teaching academic disciplines
in higher education requires constant work on edu-
cational information in order to move from extensive
to intensive teaching methods. One of the ways to
intensify the educational process can be the optimal
“packaging” of educational information.
The solution to this problem is the construction
of a semantic network. An important condition for
the successful mastering of educational material is the
ability of the teacher to highlight the key issues of the
program. Nodal issues of the program are the basis
for studying the whole topic. Their significance can
be determined using a graph or adjacency matrix.
For example, let a topic contain 6 questions and
the logical connections between them are presented
Analysis and Application of Semantic Networks in Education
427

Table 3: Metrics used for network analysis in Gephi.
Metric How calculated
Nodes Nodes contain discipline concepts. Sim-
ple count.
Weakly
Con-
nected
Number of maximally sized clusters in
which each node is reachable from every
other node along undirected edges.
Strongly
Con-
nected
Number of maximally sized clusters in
which each node is reachable from every
other node along directed edges.
Diameter Longest finite optimal path between
nodes using undirected edges.
Average
Short-
est Path
Length
Average Shortest Path Length (along
undirected edges) between all connected
nodes.
Network
Density
Fraction of all possible undirected edges
present.
Average
Degree
Average number of undirected, un-
weighted edges per node.
ModularityCalculated using Gephi algorithm.
Clustering
Coeffi-
cient
A node’s clustering coefficient is the ra-
tio of the number of actual connections
between the node’s neighbours, to the
number of the maximum potential con-
nections between those neighbours. The
network’s clustering coefficient is the
average of the clustering coefficients for
all the nodes.
Table 4: Comparison topological characteristics of the
graphs of the relationship between the concepts of the disci-
plines: “Economic Cybernetics” (E), “Algorithmization and
Programming” (P) and “Mathematical Analysis” (M).
Parameters E P M
Nodes 125 125 125
Weakly Connected 3 1 7
Strongly Connected 111 121 113
Diameter 5 9 3
Average Shortest Path
Length 2.21 3.416 1.806
Network Density 0.17 0.11 0.20
Average Degree 21.45 13.66 24.18
Modularity 0.25 0.30 0.23
Clustering Coefficient 0.40 0.33 0.59
in the form of an adjacency matrix (table 5).
The significance of the question can be character-
ized by the weight coefficient determined by the for-
mula:
α
β
= S
i
/k,
where S
i
is the number of references to the i-th ques-
tion when studying the others contained in this topic,
k is the total number of questions in this section.
Table 5: Example topic adjacency matrix.
P
1
P
2
P
3
P
4
P
5
P
6
α
B
P
1
0 1 1 0 0 1 3/6
P
2
0 0 1 1 1 1 4/6
P
3
0 0 0 1 1 0 2/6
P
4
0 0 0 0 1 0 1/6
P
5
0 0 0 0 0 0 0
P
6
0 0 0 1 0 0 1/6
The larger the coefficient leads to the greater the
significance of the issue. Thus, it is possible to deter-
mine the importance of the discipline (section) in the
study of all disciplines of the curriculum. A similar
technique can be used in the formation of the content
of academic subjects on the basis of discipline stan-
dards, in the development of curricula and tests, in the
selection and organization of educational information
for training.
4 CONCLUSIONS
Algorithms for the formation of a semantic knowl-
edge network are developed. The knowledge network
is the basic concept of knowledge management. In
fact we introduce a new discipline that implements
the principles of sustainable development of educa-
tion. The method of constructing a semantic knowl-
edge network of terms allows forming a so called ad-
jacency matrix that reflects the correlation of terms
from a terminological dictionary. This matrix allows
to evaluate the quality of the terminology in the par-
ticular discipline, as well as to determine quantify the
semantic connectivity of the whole tutorial. Accord-
ing to obtained results, we can conclude that the con-
cept system in the “Economic Cybernetics” is con-
nected and complex. This means that in this case
when studying any concepts, it is necessary to re-
peat the meaning of those already studied. The con-
cept system in the “Programming” contains fewer de-
pendencies and less connectivity in comparison with
graphs. However, the experience of studying these
disciplines indicates that also the “Programming” is
not easy to learn. Further the problem of planning
the learning process based on semantic networks of
knowledge will be studied. Namely, the distribution
of lectures, practical and laboratory exercises will be
determined to achieve successfully the learning ob-
jectives.
We can continue to analyse the network structure
of the curriculum. The curriculum is a complex sys-
tem with nodes representing courses and links be-
tween nodes, course prerequisites. The latter is easy
to obtain from the course catalogue. The resulting
AET 2020 - Symposium on Advances in Educational Technology
428
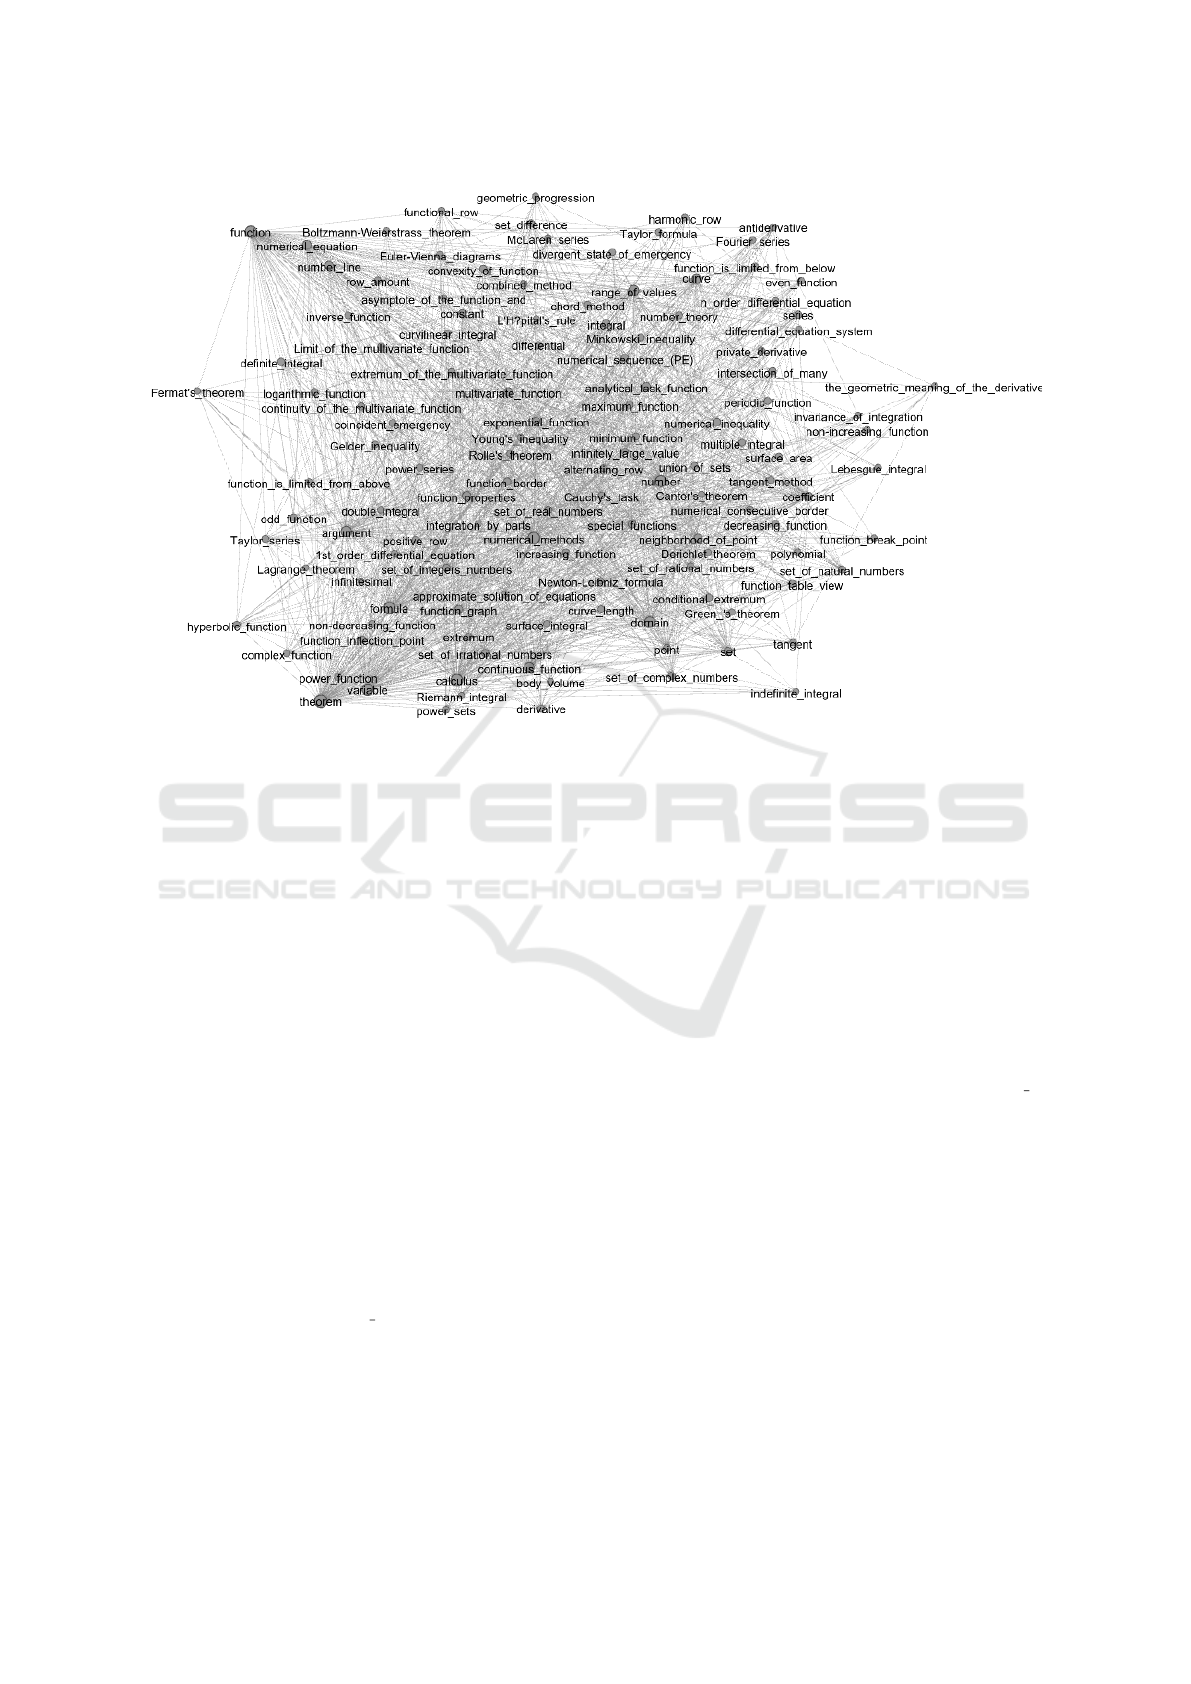
Figure 8: The semantic knowledge network of the course concepts “Mathematical Analysis”.
network of curriculum prerequisites is in the form of
a directed acyclic graph. This graph has certain ana-
lytical characteristics. In future work, we will to cal-
culate spectral characteristics of graphs for the studied
disciplines, as it was done in (Soloviev et al., 2020).
REFERENCES
Ahromeeva, T. S., Malinetskiy, G. G., and Posashkov,
S. A. (2013). Innovacionnye samorazvivajushhiesja
sredy v kontekste sinergetiki i teorii refleksivnogo
upravlenija. In Sbornik materialov IX Mezhdunaro-
dnogo simpoziuma “Refleksivnye processy i upravle-
nie”, pages 171–182. Moscow. http://www.reflexion.
ru/Library/Sbornic2013.pdf.
Arshinov, V. I., Budanov, V. G., Lepskiy, V. E., and
Malinetskiy, G. G. (2011). Samoorganizacija, kog-
nitivnyj bar’er, gumanitarnye tehnologii. Doklad na
sobranii nanotehnologicheskogo obschestva Rossii.
http://www.ntsr.info/science/library/3828.htm.
Babkin, E. A., Kozyrev, O. R., and Kurkina, I. V.
(2006). Principy i algoritmy iskusstvennogo in-
tellekta. NGTU, N. Novgorod. https://www.hse.ru/
data/570/907/1224/Publ9 Kozyrev.pdf.
Barab
´
asi, A.-L. (2012). Luck or reason. Nature,
489(7417):507–508.
Barab
´
asi, A.-L. (2016). Network Science.
Cambridge University Press, Cambridge.
http://www.book2look.com/books/9781107076266.
Baronchelli, A., Ferrer-i-Cancho, R., Pastor-Satorras, R.,
Chater, N., and Christiansen, M. H. (2013). Networks
in cognitive science. Trends in Cognitive Sciences,
17(7):348–360.
Barrat, A. (2008). Dynamical processes on complex net-
works. Cambridge University Press, Cambridge.
Beckage, N. M. and Colunga, E. (2015). Language net-
works as models of cognition: Understanding cog-
nition through language. In Towards a Theoretical
Framework for Analyzing Complex Linguistic Net-
works, page 3–28. Springer, Berlin.
Boca, G. D. and Mukaj, L. (2016). Barriers in sus-
tainable knowledge management model in educa-
tion. Economics and Applied Informatics, 3:19–
28. http://www.eia.feaa.ugal.ro/images/eia/2016
3/
BocaMukaj.pdf.
Boccaletti, S., Latora, V., Moreno, Y., Chavez, M., and
Hwang, D.-U. (2006). Complex networks: Structure
and dynamics. Physics Reports, 424(4):175–308.
Borge-Holthoefer, J. and Arenas, A. (2010). Semantic net-
works: Structure and dynamics. Entropy, 12(5):1264–
1302. https://www.mdpi.com/1099-4300/12/5/1264.
Byrch, C., Kearins, K., Milne, M., and Morgan, R. (2015).
Seeds of hope? Exploring business actors’ diverse un-
derstandings of sustainable development. Accounting,
Auditing & Accountability Journal, 28(5):671–705.
Carrington, P. J., Scott, J., and Wasserman, S., editors
(2015). Models and methods in social network analy-
sis. Cambridge University Press, Cambridge.
Chekmarev, V. V. (2014). Myshlenie budushhego: mezhdis-
ciplinarnoe obrazovanie kak uslovie konkuren-
Analysis and Application of Semantic Networks in Education
429

tosposobnosti. Teoreticheskaya ekonomika, 3:36–42.
https://www.ystu.ru/3 (21) 2014.pdf.
Cheramangalath, U., Nasre, R., and Srikant, Y. (2020).
Distributed Graph Analytics: Programming, Lan-
guages, and Their Compilation. Springer. https:
//www.springer.com/gp/book/9783030418854.
Czerkawski, B. O. (2014). The semantic web in
teacher education. The Turkish Online Jour-
nal of Educational Technology, 13(4):144–147.
http://www.tojet.net/articles/v13i4/13416.pdf.
Dunn, J. D. (2013). Utilization of semantic networks in the
teaching of vocabulary. Language Education in Asia,
4(2):175–182. http://www.leia.org/LEiA/LEiA
Eilks, I. (2015). Science education and education for sus-
tainable development – justifications, models, prac-
tices and perspectives. Eurasia Journal of Mathemat-
ics, Science and Technology Education, 11(1):149–
158.
Fazey, I., Evely, A. C., Reed, M. S., Stringer, L. C., Krui-
jsen, J., White, P. C. L., Newsham, A., Jin, L., Cor-
tazzi, M., Phillipson, J., Blackstock, K., Entwistle, N.,
Sheate, W., Armstrong, F., Blackmore, C., Fazey, J.,
Ingram, J., Gregson, J., Lowe, P., Morton, S., and Tre-
vitt, C. (2013). Knowledge exchange: a review and
research agenda for environmental management. En-
vironmental Conservation, 40:19–36.
Fruchterman, T. M. J. and Reingold, E. M. (1991). Graph
drawing by force-directed placement. Software –
Practice and Experience, 21(11):1129–1164.
Gephi (2020a). Network Visualization and Analysis with
Gephi. https://noduslabs.com/courses/network-
visualization-and-analysis-with-gephi/units/section-
1-quick-introduction-to-network-analysis.
Gephi (2020b). The Open Graph Viz Platform.
https://gephi.org.
Google (2021). Google trends. https://trends.google.com.
Grosseck, G., Tiru, L. G., and Bran, R. A. (2019). Education
for sustainable development: Evolution and perspec-
tives: A bibliometric review of research, 1992–2018.
Sustainability, 11(21):6136.
Holfelder, A.-K. (2019). Towards a sustainable future with
education? Sustainable science, 14:943–952.
Hu, Y. (2005). Efficient, high-quality force-directed graph
drawing. The Mathematica Journal, 10(1):37–71.
http://asus.myds.me:6543/paper/nw/Efficient,
iGraph (2021). iGraph and iGraph Demo. https://
sourceforge.net/projects/igraph-and-igraph-demo/.
Jones, M. N., editor (2016). Big Data in Cognitive Science.
Routledge.
Jurgena, I. and Cedere, D. (2018). The prospects of trans-
disciplinary approach to promote learners’ cognitive
interest in natural science for sustainable develop-
ment. Journal of Teacher Education for Sustainabil-
ity, 20(1):5–19.
Kiv, A., Bodnar, L., Sedov, E., Britavska, O., Yaremchuk,
N., and Yakovleva, M. (2014). Quantitative analy-
sis of translation texts. Computer Modelling & New
Technologies, 18(12):260–263. http://www.cmnt.lv/
upload-files/ns
39crt 043 1.pdf.
Kovalchuk, M. V. (2011). Konvergencija nauk i tehnologij –
proryv v budushhee. Rossiyskie nanotehnologii, 6(1-
2):13–23. http://nrcki.ru/files/pdf/1461850844.pdf.
Kumar, M. and Agrawal, S. (2011). Applying knowl-
edge management practices in higher education
system. http://pioneerjournal.in/files.php?force&file=
Applying Knowledge Management Practices In
Higher Education System 584179770.doc.
Leicht, A., Heiss, J., and Byun, W. J., editors (2018). Issues
and trends in Education for Sustainable Development.
United Nations Educational Scientific and Cultural
Organization. France. https://europa.eu/capacity4dev/
file/69206/download?token=r 65VVK .
Liu, X. F., Tse, C. K., and Small, M. (2010). Com-
plex network structure of musical compositions: Al-
gorithmic generation of appealing music. Physica A,
389:126–132.
Malineckiy, G. G. (2013). Teorija samoorganizacii. na
poroge iv paradigmy. Kompyuternye issledovaniya i
modelirovanie, 5(3):315–366. http://crm-en.ics.org.
ru/uploads/crmissues/crm 2013 3/13301.pdf.
Martin, S., Brown, W. M., Klavans, R., and Boyack, K. W.
(2011). OpenOrd: an open-source toolbox for large
graph layout. In Wong, P. C., Park, J., Hao, M. C.,
Chen, C., B
¨
orner, K., Kao, D. L., and Roberts, J. C.,
editors, Visualization and Data Analysis 2011, volume
7868, pages 45 – 55. International Society for Optics
and Photonics, SPIE.
Martins, V. W. B., Rampasso, I. S., Anholon, R., Quelhas,
O. L. G., Leal, F. W., and Clean, J. (2019). Knowl-
edge management in the context of sustainability: Lit-
erature review and opportunities for future research.
Journal of Cleaner Production, 229:489–500.
Masterman, M. (1961). Semantic message detection for
machine translation, using an interlingua. In In-
ternational Conference on Machine Translation of
Languages and Applied Language Analysis, Na-
tional Physical Laboratory, Teddington, UK, 5-8
September 1961, pages 437–475, Teddington. H.M.
Stationery Office. http://www.mt-archive.info/NPL-
1961-Masterman.pdf.
Morioka, T., Saito, O., and Yabar, H. (2006). The path-
way to a sustainable industrial society – initiative of
the research institute for sustainability science (riss) at
osaka university. Sustainability Science, 1(1):65–82.
NetworkX (2021). NetworkX. https://networkx.org.
Sanguankaew, P. and Ractham, V. V. (2019). Biblio-
metric review of research on knowledge manage-
ment and sustainability, 1994–2018. Sustainability,
11(16):4388–4402.
Semerikov, S., Teplytskyi, I., Yechkalo, Y., and Kiv, A.
(2018). Computer simulation of neural networks us-
ing spreadsheets: The dawn of the age of Camelot.
CEUR Workshop Proceedings, 2257:122–147.
Shakespeare, W. (1985). Hamlet, Prince of Denmark. Se-
lected translations. Raduga, Moscow.
Shults, V. L. and Tsyiganov, V. V. (2010). Modeli i
mehanizmyi federalnoy, regionalnoy, munitsipalnoy
i korporativnoy bezopasnosti. Nauka, Moscow.
AET 2020 - Symposium on Advances in Educational Technology
430

http://opac.hse.ru/absopac/app/webroot/index.php?
url=/notices/index/IdNotice:231276/Source:default.
Sirenko, S. N. (2013). Rasshirenie predmetnogo polja
uchebnoj discipliny na osnove idej mezhdisciplinarnoj
integracii (na primere discipliny “Osnovy informa-
cionnyh tehnologij”). Innovatsionnyie obrazovatel-
nyie tehnologii, 3:19–27. http://media.miu.by/files/
store/items/iot/35/iot 3 2013 3.pdf.
Sirenko, S. N. (2014). Obrazovanie kak institu-
cional’nyj mehanizm perehoda k ustojchivomu
razvitiju. Vyisheyshaya shkola, 3:47–52.
http://nihe.bsu.by/images/2014/3 2014.pdf.
SNAP (2021). Stanford Network Analysis Project.
http://snap.stanford.edu.
Sol
´
e, R. V., Corominas-Murtra, B., Valverde, S., and Steels,
L. (2010). Language networks: Their structure, func-
tion, and evolution. Complexity, 15(6):20–26. https://
onlinelibrary.wiley.com/doi/abs/10.1002/cplx.20305.
Solodova, E. A. and Malinetskiy, G. G. (2013). Novyie
modeli v sisteme obrazovaniya: sinergeticheskiy pod-
hod. LIBROKOM, Moscow. http://www.tnu.in.ua/
study/books/entry-1398936.html.
Soloviev, V., Moiseienko, N., and Tarasova, O. (2020).
Complexity theory and dynamic characteristics of
cognitive processes. Communications in Computer
and Information Science, 1175 CCIS:231–253.
Soloviev, V. N., Serdyuk, O. A., and Danylchuk, H. B.
(2016). Modelyuvannya skladnih system. O.Yu.
Vovchok, Cherkasi. http://elibrary.kdpu.edu.ua/xmlui/
handle/0564/1065.
Sporns, O. (2011). Networks of the brain. The MIT
Press, Cambridge. http://www.cs.cmu.edu/
∼
saketn/
files/Sporns
Book.pdf.
Teng, C.-Y., Lin, Y.-R., and Adamic, L. A. (2012). Recipe
recommendation using ingredient networks.
Tolman, E. C. (1948). Cognitive maps in rats and men. Psy-
chological Review, 55(4):189–208.
Vlasenko, K. V., Lovianova, I. V., Armash, T. S., Sitak, I. V.,
and Kovalenko, D. A. (2021). A competency-based
approach to the systematization of mathematical prob-
lems in a specialized school. Journal of Physics: Con-
ference Series, 1946(1):012003.
Wikipedia (2021). Wikipedia. https://www.wikipedia.org.
Wiktionary Statistics (2020). https://en.wiktionary.org/
wiki/Special:Statistics.
Wulff, D. U., De Deyne, S., Jones, M. N., Mata, R., and The
Aging Lexicon Consortium (2019). New perspectives
on the aging lexicon. Trends in Cognitive Sciences,
23(8):686–698.
Xie, Z., Duan, X., Ouyang, Z., and P, Z. (2015). Quantita-
tive analysis of the interdisciplinarity of applied math-
ematics.
Yevin, I. A. (2010). Vvedenie v teoriju slozh-
nyh setej. Kompyuternye issledovaniya i mod-
elirovanie, 2(2):121–141. http://crm-en.ics.org.ru/
uploads/crmissues/crm2010-2-2/crm10201.pdf.
Zesch, T., Muller, C., and Gurevych, I. (2008). Us-
ing Wiktionary for computing semantic relat-
edness. In Proceedings of the twenty-third
innovative applications of artificial intelli-
gence conference, pages 861–867. AAAI Press.
https://www.aaai.org/Papers/AAAI/2008/AAAI08-
137.pdf.
Analysis and Application of Semantic Networks in Education
431
