
Structural Equation Modeling in Educational Research: A Case-study
for PhD Training
Liubov F. Panchenko
1 a
and Vladyslav Ye. Velychko
2 b
1
National Technical University of Ukraine “Igor Sikorsky Kyiv Polytechnic Institute”, 37 Peremohy Ave., Kyiv, 03056,
Ukraine
2
Donbass State Pedagogical University, 19 Henerala Batiuka Str., Sloviansk, 84116, Ukraine
Keywords:
Structure Equation Modelling, TALIS Methodology, Ukrainian Teachers, Teacher’s Self-Efficacy, PhD
Student, AMOS, R.
Abstract:
The article deals with the problem of using structural equation modelling (SEM) methodology in educational
research. It allows the researcher to build multidimensional models of the phenomena and processes that are
being studied. The SEM methodology is based on many well-known methods such as correlation, regression,
factor analysis, variance analysis and covariance analysis. The methodology is mainly based on deductive
logic, involves the preliminary construction of a structural model of relationships between variables in order
to further check for consistency with the experimental data. The article summarizes the use of various SEM
software in the training of doctors of philosophy of the world’s leading universities and provides an example
of using the SEM methodology in educational research for PhD student training. An important point in prepar-
ing specialists for using SEM is to select or obtain the necessary data sets that are representative and valid.
During the research the Ukrainian teacher’s self-efficacy model with SEM methodology was checked, and
the obtained results were compared with the research data of the worldwide teacher’s survey – The Teaching
and Learning International Survey (TALIS). The lower self-efficacy of Ukrainian teachers, especially in the
student engagement block, was showed.
1 INTRODUCTION
1.1 Setting of a Problem
In recent years, many PhD programs were organized
in Ukraine. Qualitative scientific research is impos-
sible without a systematic description of the stud-
ied phenomena; multidimensionality of the investi-
gated phenomena requires the use of multidimen-
sional analysis methods that are capable to identify
causal relationships, latent factors, etc. A promising
area in the field of multidimensional applied analy-
sis is the structural modeling or structural equation
modeling, which is becoming an increasingly popular
tool for researchers in the field of education, psychol-
ogy and social sciences (Kline, 2015; Khine, 2013;
Mitina, 2008; Nasledov, 2013; Chornyi, 2011).
In our article (Panchenko et al., 2021) the three fo-
cuses of the research component of doctoral program
are proposed. The first focus relates to reproducible
a
https://orcid.org/0000-0002-9979-0625
b
https://orcid.org/0000-0001-9752-0907
research principle. The second focus is related to
the use of multivariate models of phenomena’s study
and SEM methodology. The SEM methodology is
mostly based on deductive logic, involves the prelimi-
nary construction of a structural model of the relation-
ships between the variables in order to further check
for consistency with the experimental data. The third
focus combines qualitative and quantitative methods
and the use of triangulation (data triangulation, inves-
tigation triangulation, theory triangulation etc.). The
content of selected courses for doctorate students is
proposed: Reproducible Research and Multivariate
Methods in Scientific Research courses.
In this article, we focus on the SEM methodology;
we consider it very important to train future doctors of
philosophy to use it in the educational research.
The popularity of the SEM methodology is ev-
idenced by the experiment we conducted. At the
request of “structural equation modeling” to search
books on Amazon.com (as of March 16, 2013), we
obtained 59 items, the graph of which is clearly shown
in figure 1. In the center of the graph (figure 1, on
300
Panchenko, L. and Velychko, V.
Structural Equation Modeling in Educational Research: A Case-study for PhD Training.
DOI: 10.5220/0010923900003364
In Proceedings of the 1st Symposium on Advances in Educational Technology (AET 2020) - Volume 1, pages 300-307
ISBN: 978-989-758-558-6
Copyright
c
2022 by SCITEPRESS – Science and Technology Publications, Lda. All rights reserved

the left), where 5 subgraphs can be observed, there is
the third edition of the bestseller, Principles and Prac-
tice of Modeling by Structural Equations by Kline
(Kline, 2015). The companion site of this publication
provides methodological support and offers download
syntax, data and source files for all sample books for
execution in three environments EQS, LISREL and
Mplus, and a comparison of simulation results. A
similar experiment, conducted on March 28, 2019
(figure 1, on the right), shows interest growth in struc-
tural modeling; we have 157 items. Interestingly, the
fourth edition of the same bestseller has the biggest
rating there.
Figure 1: Books on “ structural equation modeling”, Ama-
zon.com, year 2013 versus 2019.
While solving the scientific problem of training
PhDs to use the SEM methodology, the following
main results were obtained in past author works: the
content of the simulation training by the structural
equations of specialists in the field of education is re-
vealed; the dynamics of software simulation by struc-
tural equations is analyzed; the necessity of including
these means in the courses for students and graduates
of higher educational institutions of Ukraine that spe-
cialize in the field of education and social sciences is
substantiated (Panchenko, 2013).
The syllabuses of PhD SEM courses of lead-
ing universities are analyzed (Higher School of Eco-
nomics, St. Petersburg; University of Amster-
dam; University of Vaasa, Finland; University of
Mannheim; Iowa State University; Brown University;
University of Leuven; School of Education University
of Pittsburgh; Oslo University etc).
An analysis of the best PhD programs in sociol-
ogy according to the Princeton Review’s “Gourman
Report of Graduate Programs” (Plous, 2021) showed
that they must have courses on structural equation
modelling. In table 1, we summarize the use of var-
ious SEM software in the training of doctors of phi-
losophy of the world’s leading universities.
Analysis of syllabusis (table 1) showed that in
general the courses are organized in the format of
seminars. The main activity is created at the intersec-
tion of lectures, group discussions, software applica-
tion and interpretation of results. Teaching materials
are available through the Blackboard or Moodle learn-
ing management system. The number of course cred-
its ranges from 1 to 6 with 1–3 credits for introductory
courses, and 4–6 credits for advanced. Courses are of-
fered as part of the training of doctors of philosophy
in the field of pedagogy, psychology, sociology, statis-
tics, information systems and business, public health,
sports, etc. Both proprietary and free software is used.
In most courses, one software tool is acting as the
main tool, and another one as an additional. But there
are courses in which several software tools are widely
used.
Here is an example of evaluating the work of
students in the course (www.soc.iastate.edu, 2021).
Homework with the use statistical software: 8%; crit-
ical review of articles on the topic (4 reviews of 4–5
pages): 30%; statistical analysis (4 reports of 12–15
pages): 62%. For a critical review, the parameters
of its evaluation are given: for example, to explain
the basic model that the author evaluates (20% of the
mark); discussion of critical mistakes made by the au-
thor (40%); an explanation of how the casual effect
(40%) can be correctly estimated. Some programs of-
fer an exam and a final project during the course as
their own mini-study on the use of SEM.
The objectives of the SEM courses are defined as
follows: using structural equation modeling method-
ology to study the problems of social and behavioral
science, understanding the strengths and flaws of the
method and its limitations, teaching methods of as-
sessment, identification models, testing their validity,
interpretation, critical evaluation of scientific publi-
cations on this subject, using statistical software to
perform structural equation modeling analysis, prepa-
ration of research reports in accordance with the stan-
dards of research (Panchenko and Razoronova, 2016).
In preparing specialists for using SEM an im-
portant point is to select or obtain the necessary
data sets that are representative and valid. We offer
our students the survey data from Ukrainian teachers
(Shchudlo et al., 2018; TALIS, 2017; Questionnaires,
2017).
On August 31, 2017, the Ukrainian Associa-
tion of Educational Researchers completed the All-
Ukrainian monitoring “Teaching and Learning Sur-
vey on Principals and Teachers of Secondary Edu-
cation Institutions” (based on the TALIS methodol-
ogy (OECD, 2018). The study was conducted within
the framework of the project “Teacher” and “Edu-
cation Reform: Quality Assessment in an Interna-
tional Context”, which is implemented by the All-
Ukrainian Foundation “Step by Step” with the support
of the Ministry of Education and Science of Ukraine
(Shchudlo et al., 2018). The study was attended by
Structural Equation Modeling in Educational Research: A Case-study for PhD Training
301

Table 1: Software in SEM courses.
Software
Course name AMOS
SPSS
EQS Mplus Lisrel Open Mx SAS R
”Modern Social Analysis”, HSE, St. Peters-
burg
+
”Structural equation modelling in educational
research”, University of Amsterdam
+ + +
”Latent Structural Equation Modeling”, Uni-
versity of Vaasa, Finland
+ + + + +
SEM1, University of Oregon + +
”Structural equation modelling using LISREL
and EQS” (SEM PhD workshop)
+ +
”Structural Equation Modeling in the IS Dis-
cipline”, University of Mannheim
smart
PLS
”Structural equation models for social and be-
havioral research”, Iowa State University
”Structural Equation Models in the Social Sci-
ences”, University of Brown
+
”Causal analysis and structural equation mod-
eling”
+ Stata
”Structural Equations”, University of Leuven,
PhD in Statictics
+
”Structural Equation Modeling”, School of
Education University of Pittsburgh
+ +
”Structural equation modeling: Longitudinal
models and multi-group models”, University
of Oslo
+
”Building and Testing Structural Equation
Models In the Social Sciences”, University of
Michigan
+ + +
”An introduction to structural equation mod-
elling”, Doctoral college of Ulster University
”PhD-M: Structural Equations Modeling”,
University of Vienna
+
PSY9140 -– ”Structural Equation Modelling”,
Oslo university
+ +
PSY8006 — ”Introduction to Structural Equa-
tion Modeling (with MPlus)”, Norwegian uni-
versity of science and technology
+
Introduction to Structural Equation Modeling
(Sem), PhD School of Copenhagen Business
School
+
Structural Equation Modeling, HSE, Russia +
3,600 teachers and 201 school principals from 201
schools, representing all regions of Ukraine. The re-
sults of the study, according to the OECD policy, are
open and accessible.
The purpose of our article is to show the ways to
apply the SEM methodology in educational research
for PhD students. In our case-study, we will, based
on the survey data of Ukrainian teachers, check the
model of teacher’s self-efficacy with SEM methodol-
ogy, and compare obtained results with the research
data of the worldwide teacher’s survey – TALIS.
1.2 Related Works
The methodology of structural modeling has received
wide recognition in the global community. The study
AET 2020 - Symposium on Advances in Educational Technology
302
of the basics of structural modeling has become a
component of the training of researchers specializ-
ing in social sciences (Panchenko and Razoronova,
2016). In Russia, the ideas of structural modeling in
relation to psychology are reflected in (Mitina, 2008;
Nasledov, 2013). The use of SEM with an emphasis
on economic research has been studied by Chornyi
(Chornyi, 2011). Unfortunately, in Ukraine, struc-
tural modeling is not sufficiently used in educational
and social studies in general, and in the training of
researchers at universities, in particular.
The aspects of the application of the SEM method-
ology to educational data (TALIS, 2013) are devoted
to the following research. A structural equation model
of determinants of the perceived impact of teachers’
professional development (the Abu Dhabi applica-
tion) is reviewed by Badri et al. (Badri et al., 2017).
How school context and teacher’s characteristics pre-
dict distributed leadership is presented by Liu et al.
(Liu et al., 2018). The invariance of teachers’ sense
of self-efficacy measured across countries is reviewed
by Scherer et al. (Scherer et al., 2016).
2 RESULTS OF THE STUDY
TALIS (Teaching and Learning International Survey)
is one of the most prestigious international compar-
ative education projects. The project is dedicated
to studying the environment and work conditions of
school teachers. It has been implemented since 2008
by a research consortium under the Organization for
Economic Cooperation and Development (OECD).
24 OECP countries and partner countries participated
in the first wave of TALIS study in 2008, 34 – in the
second wave in 2013, and 44 countries plan to partic-
ipate in 2018 (Shchudlo et al., 2018; OECD, 2018).
All-Ukrainian monitoring survey of teaching and
learning among school principals and teachers of gen-
eral educational institutions (according to the method-
ology All-Ukrainian research on TALIS methodol-
ogy) is an example of use of international instruments
for studying national educational space and identi-
fying the place of the Ukrainian teacher community
in the international community educational context.
The purpose of the research is to identify and ana-
lyze socio-demographic and professional characteris-
tics of Ukrainian teachers and academic staff and the
environment of schools on the basis of reliable com-
parable metrics (Shchudlo et al., 2018).
3600 teachers of 5–9 grades of secondary schools
(level ISCED 2) and 201 school principals from 201
schools participated in the survey in 2017. Error of
simple random sampling is 1.6%, the school sam-
ple selection error takes into account design effect is
2.3%.
From the Ukrainian teacher’s survey file (TALIS,
2017) we selected 3477 lines without missing values
for 12 variables that represented the teacher’s self-
efficacy (table 2).
Bandura (Bandura, 1982) defines self-efficacy as
a personal judgment of “how well one can execute
courses of action required to deal with prospective
situations”. He names four sources of efficacy be-
liefs: 1) mastery experiences; 2) vicarious experi-
ences; 3) verbal persuasion; 4) emotional and phys-
iological states.
Professional teacher’s self-efficacy, in general, is
the perception of a person’s own ability to mobilize
motivation, cognitive resources and behavioral ac-
tivity that are needed to control the situation in or-
der to achieve the intended purpose (Bandura, 1982;
Kremeshna, 2010; Krasnoryadtseva et al., 2014).
TALIS model for teacher consists of three compo-
nents of self-efficacy: self-efficacy in classroom man-
agement; self-efficacy in instruction; self-efficacy in
student engagement.
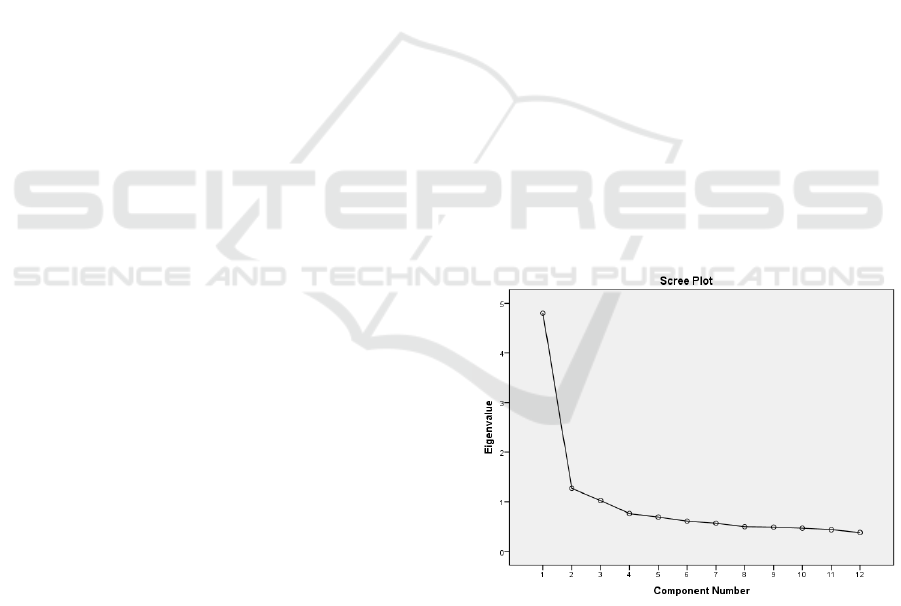
We will conduct a factor analysis for these data.
The obtained values of Kaiser-Meyer-Olkin (0.902)
and Bartlett’s Test of Sphericity (13308, p < 0.001)
indicate that factor analysis is a suitable method for
these data. The scree plot below shows three factors
(figure 2).
Figure 2: Scree plot: a line plot of the eigenvalues of fac-
tors.
Let us consider the rotated component matrix (ta-
ble 3). It demonstrates that the first factor, loading
high factor weight of the attributes, is related to the
class management, the second one is related to the
student’s engagement, and the third one to the instruc-
tion.
You can also observe that the variable “Craft good
Structural Equation Modeling in Educational Research: A Case-study for PhD Training
303

Table 2: Variables of teacher’s self-efficacy.
Variable name Content
TT2G34A Get students to believe they can do well in school work
TT2G34B Help my students value learning
TT2G34C Craft good questions for my students
TT2G34D Control disruptive behavior in the classroom
TT2G34E Motivate students who show low interest in school work
TT2G34F Make my expectations about student behavior clear
TT2G34G Help students think critically
TT2G34H Use a variety of assessment strategies
TT2G34I Provide an alternative explanation, for example, when students are confused
TT2G34J Implement alternative instructional strategies in my classroom
TT2G34K Get students to follow classroom rules
TT2G34L Calm down a student who is disruptive or noisy
Table 3: Rotated component matrix.
Factor 1:
Class man-
agement
Factor 2:
Student En-
gagement
Factor 3:
Instruction
Control disruptive behavior in the classroom .795
Calm a student who is disruptive or noisy .773
Get students to follow classroom rules .765
Make my expectations about student behavior clear .596
Help my students value learning .816
Get students to believe they can do well in school work .764
Motivate students who show low interest in school work .644
Help students think critically .448
Craft good questions for my students .443
Provide an alternative explanation, for example, when
students are confused
.785
Implement alternative instructional strategies in my class-
room
.736
Use a variety of assessment strategies .730
questions for my students” is more related to the fac-
tor “Student engagement” than the factor “Instruc-
tion”. As you see, three factors explain 59.1% of vari-
ability (table 4).
Table 4: Total variance explained.
Component Rotation Sums of Squared Loadings
Total % of Variance Cumulative %
1 2.571 21.425 21.425
2 2.313 19.274 40.698
3 2.211 18.429 59.127
Scientists identify next five steps in SEM applica-
tion (Kline, 2015; Nasledov, 2013).
1) model formation. The model depicts the graphi-
cal views of the researcher about the structure of
the variable and latent constructs of ties. At the
same time, they decide which parameters should
be fixed, and which should be left free.
2) model identification
3) model evaluation
4) checking the consistency of the model
5) model correction by adding new links and elimi-
nating insignificant links.
Let us build a model of confirmatory factor analy-
sis with AMOS SPSS (figure 3).
You can see the resulting teacher’s self-efficacy
model in the figure 4.
We got the following results. Number of distinct
sample moments: 78; number of distinct parameters
to be estimated: 27; degrees of freedom: 78–27=51.
Criteria for coherence RMSEA 0.07 < 0.08, that is,
the model is consistent with the data.
Using the data (Shchudlo et al., 2018), we clearly
compared the indicators of self-efficacy of teachers
in Ukraine and in the world (table 5, figure 5). The
graph shows that self-efficacy of Ukrainian teachers
AET 2020 - Symposium on Advances in Educational Technology
304
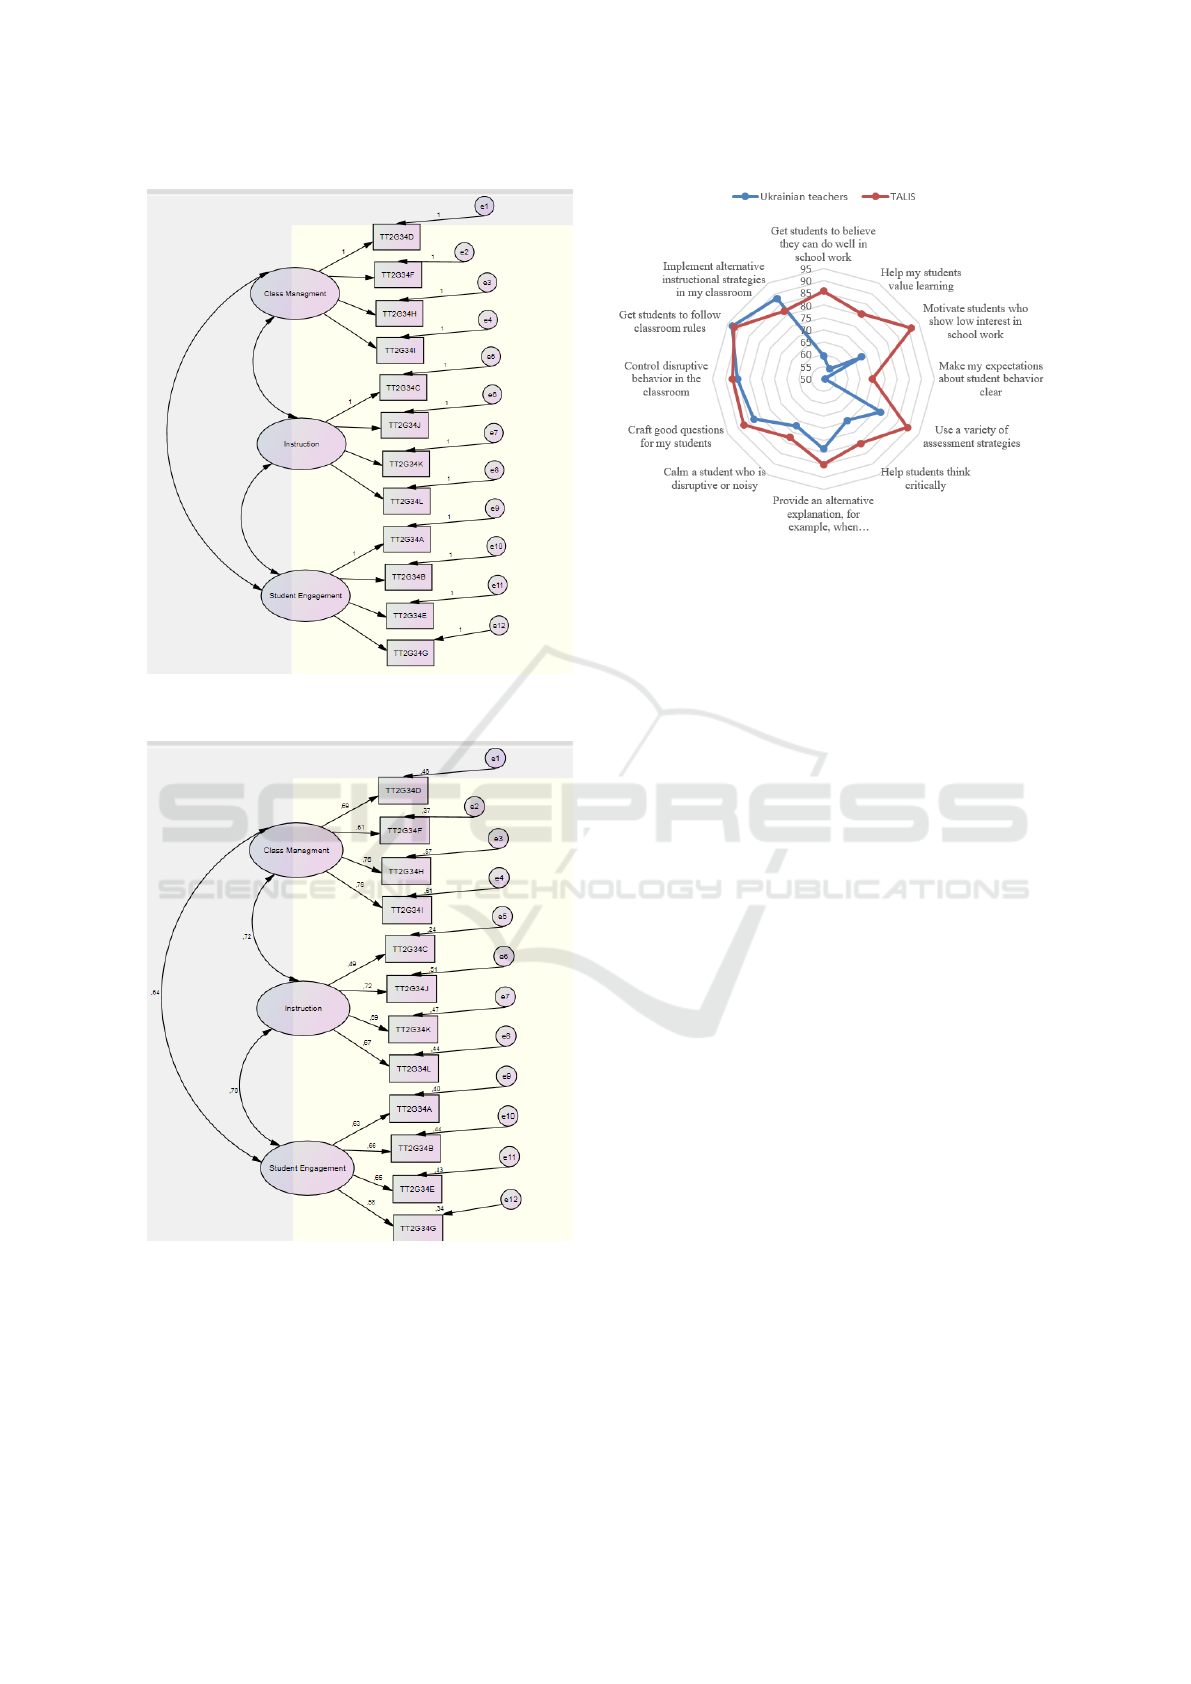
Figure 3: Initial teacher’s self-efficacy model in AMOS
SPSS.
Figure 4: Resulting teacher’s self-efficacy model in AMOS
SPSS.
is lower, especially in the student engagement block
(variable “Get students to believe they can do well
in school work” – difference was 26.4%, ”Help my
students value learning” – 26%, ”Motivate students
who show low interest in school work” – 19.4 %).
As a continuation of the research, PhD students
Figure 5: Comparison of teachers’ self-efficacy in Ukraine
and in the world.
can be invited to analyze the results of a recently
published survey TALIS 2018. TALIS 2018 (Plous,
2021) identifies a number of factors that are related to
teacher self-efficacy:
1. Teacher characteristics: years of experience as a
teacher
2. Index of classroom disciplinary climate
3. Took part in any induction activities at current
school
4. Induction activities at current school included
team teaching with experienced teachers
5. Professional development acitivities in the 12
months prior to the survey did have a positive im-
pact on teaching practice
6. Index of workplace well-being and stress
7. Fixed-term contract: less than or one school year
8. Index of professional collaboration
9. Index of target class autonomy
This relationship does not apply to all countries
(table 6).
An interesting task for PhD students is to build the
SEM model taking into account factors of teacher’s
self-efficacy according TALIS 2018.
3 CONCLUSIONS AND
PERSPECTIVES OF FURTHER
RESEARCH
Measurements that are used in modern educational re-
search are becoming more and more complex. The
author’s vision of the research component of training
Structural Equation Modeling in Educational Research: A Case-study for PhD Training
305

Table 5: Indicators of self-efficacy of teachers in Ukraine and in the world (%).
Variables Ukrainian
teachers
TALIS Difference
A. Get students to believe they can do well in school work 59.4 85.8 26.4
B. Help my students value learning 54.7 80.7 26
C. Craft good questions for my students 82.6 87.4 4.8
D. Control disruptive behavior in the classroom 85 87 2
E. Motivate students who show low interest in school work 50.6 70 19.4
F. Make my expectations about student behavior clear 68 91.3 23.3
G. Help students think critically 69.5 80.3 10.8
H. Use a variety of assessment strategies 77 89.4 12.4
I. Provide an alternative explanation. for example. when students are confused 78.5 84.8 6.3
J. Implement alternative instructional strategies in my classroom 87.8 81.9 -5.9
K. Get students to follow classroom rules 92.9 92 -0.9
L. Calm a student who is disruptive or noisy 72 77.4 5.4
Table 6: Factor of self-efficacy of teachers in TALIS 2018 and number of countries and percentage of countries with positive
and negative relation (%).
Factor N+ %+ N- %-
Teacher characteristics: years of experience as a teacher 29 60.4 0 0
Index of classroom disciplinary climate 0 0 45 93.8
Took part in any induction activities at current school 25 52.1 0 0
Induction activities at current school included team teaching
with experienced teachers
35 72.9 0 0
Professional development acitivities in the 12 months prior to
the survey did have a positive impact on teaching practice
33 68.8 0 0
Index of workplace well-being and stress 0 0.0 42 87.5
Fixed-term contract: less than or one school year 0 0.0 15 31.3
Index of professional collaboration 46 95.8 0 0
Index of target class autonomy 47 97.9 0 0
PhD students focuses on three areas: reproducible re-
search; multivariant analysis and SEM methodology;
triangulation (Panchenko et al., 2021). SEM method-
ology helps researcher determine the effectiveness of
educational innovations in different educational con-
texts, as well as model and study phenomena in their
interrelations; understand the influence of latent fac-
tors, develop systemic and critical thinking.
An important point in training specialists to use
SEM is to select or obtain the necessary data sets
that are representative and valid. For example, we of-
fer our students such data: All-Ukrainian survey data
from Ukrainian teachers. The main criteria for choos-
ing it are: 1) an array of data is freely accessible, 2) it
is large (contains 3600 lines), 3) it is accompanied
by supporting documentation, 4) the array and doc-
uments have Ukrainian and English versions, 5) the
array variables are simple and understandable, 6) it is
possible to conduct comparative studies with the data
of the International Talis Teacher’s Survey.
During the case study the teacher’s self-efficacy
model using SEM methodology were checked, the
obtained results were compared with the TALIS sur-
vey data (2013). The research demonstrated that self-
efficacy of Ukrainian teachers, especially in the stu-
dent engagement block, was lower.
Further development of work in this direction is
the creation of teaching and methodological support
for modeling by structural equations in the form of
a computer workshop in the AMOS and R environ-
ments for the training of researchers in the field of
pedagogy and social sciences and a proposal to in-
clude SEM in higher education research.
REFERENCES
Badri, M., Alnuaimi, A., Yang, G., Rashidi, A., and
Sumaiti, R. (2017). A Structural Equation Model of
Determinants of the Perceived Impact of Teachers’
Professional Development — The Abu Dhabi Appli-
cation. SAGE Open, 7(2).
Bandura, A. (1982). Self-efficacy mechanism in human
agency. American Psychologist, 37(2):122–147.
Chornyi, A. (2011). Modeliuvannia latentnykh zmin-
AET 2020 - Symposium on Advances in Educational Technology
306

nykh: rozvytok, suchasnyi stan ta perspektyvy (Mod-
eling latent variables: development, current state and
prospects). Visnyk Kyivskoho nats. un-tu imeni Tarasa
Shevchenka. Ser. Ekonomika, 129:41–43.
Khine, M. S., editor (2013). Application of Structural Equa-
tion Modeling in Educational Research and Practice.
Sense Publishers.
Kline, R. B. (2015). Principles and Practice of Structural
Equation Modeling. The Guilford Press, New York,
4th edition.
Krasnoryadtseva, O. M., Kabrin, V. I., Muraveva, O. I.,
Podoynitsina, M. A., and Chuchalova, O. N. (2014).
Psihologicheskie praktiki diagnostiki i razvitiya samo-
effektivnosti studencheskoy molodezhi (Psychologi-
cal practices of diagnostics and development of self-
efficacy of student youth). Izdatelskiy dom TGU,
Tomsk.
Kremeshna, T. I. (2010). Pedahohichna samoefektyvnist:
shliakh do uspishnoho vykladannia (Pedagogical Self-
Efficiency: The Way to Successful Teaching). Uman.
Liu, Y., Bellibas, M. R., and Printy, S. (2018). How
school context and educator characteristics predict
distributed leadership: A hierarchical structural equa-
tion model with 2013 TALIS data. Educational Man-
agement Administration & Leadership, 46(3):401–
423.
Mitina, O. V. (2008). Modelirovanie latentnyih izmeneniy
c pomoschyu strukturnyih uravneniy (Modeling latent
changes using structural equations). Eksperimental-
naya psihologiya, 1:131–148.
Nasledov, A. D. (2013). IBM SPSS Statistics 20 i AMOS:
professionalnyiy statisticheskiy analiz dannyih (IBM
SPSS Statistics 20 and AMOS: Professional Statistical
Data Analysis). Piter, SPb.
OECD (2018). TALIS. http://www.oecd.org/education/
talis/.
Panchenko, L. F. (2013). Modeliuvannia strukturnymy
rivnianniamy yak instrument pedahohichnoho
doslidzhennia (Modeling by structural equations as
a tool for pedagogical research). Visn. Luhan. nats.
un-tu imeni Tarasa Shevchenka: Pedahohichni nauky,
18(277):108–114.
Panchenko, L. F., Korzhov, H. O., Kolomiiets, T. V., and
Yenin, M. N. (2021). PhD student training: principles
and implementation. Journal of Physics: Conference
Series, 1840(1):012056.
Panchenko, L. F. and Razoronova, M. V. (2016). Mod-
eliuvannia strukturnymy rivnianniamy yak skladnyk
pidhotovky doktoriv filosofii (Modeling by structural
equations as a component of preparation of doctors
of philosophy). Naukovyi Visnyk Donbasu, 1-2:108–
114. http://nvd.luguniv.edu.ua/archiv/2016/N1-2(33-
34)/5.PDF.
Plous, S. (2021). Ranking of U.S. Sociology Ph.D.
Programs. https://www.socialpsychology.org/gsociol.
htm.
Questionnaires (2017). Questionnaires (in ukr): TEACH-
ERS Questionnaire. https://drive.google.com/open?
id=1L6SHvqpMAGPzeLkp8Ksb9E-KXdnkd0sd.
Scherer, R., Jansen, M., Nilsen, T., Areepattamannil, S.,
and Marsh, H. W. (2016). The Quest for Compara-
bility: Studying the Invariance of the Teachers’ Sense
of Self-Efficacy (TSES) Measure across Countries.
PLOS ONE, 11(3).
Shchudlo, S., Zabolotna, O., and Lisova, T. (2018).
Ukrainian Teachers and the Learning Environment.
Results of All-Ukrainian Monitoring Survey of Sec-
ondary School Teachers and Principals (by the TALIS
methodology). Trek LTD, Drohobych.
TALIS (2017). Access the full survey by TALIS
methodology raw data (in SPSS): TEACH-
ERS DATA. https://drive.google.com/open?id=
1bzh6U7MnOaFSt 1CV1BsQndCuLX WpWt.
www.soc.iastate.edu (2021). Structural equation
models for social and behavioral research.
http://www.soc.iastate.edu/dpeters/pubs/soc613-
syllabus-SS16.pdf.
Structural Equation Modeling in Educational Research: A Case-study for PhD Training
307
