
Impact of Internal Parameterization on the Performance of Support
Vector Machines for Crop Mapping Sentinel-2 NDVI Time Series
Badr-Eddine Sebbar
1a
, Aicha Moumni
1b
and Abderrahman Lahrouni
1c
1
LMME, Centre Geber, Faculté des Sciences de Semlalia, UCA,
Marrakech, Morocco
Keywords: Support Vector Machines, Remote-sensing, classification, Kernel function, parameterization, performance
evaluation.
Abstract: The Support Vector Machines classifiers has been increasingly used to derive land-cover/ land-use
information from satellite imagery. As software implemented classifiers, SVM give satisfactory but imperfect
results, when performed at first using the default set of parameters. Thus, obtaining the best results requires a
basic understanding of the theory behind their workings and how their accuracy can be parametrically
influenced. In this paper, we report the result of an investigation of the SVM’s different parameters, applied
to satellite data for crop mapping, in order to develop some guides for parameterizing this classification
technique. The internal parameters considered in this study include the Kernel function, Pyramid Level,
Penalty parameter, Gamma parameter, the Bias and the Degree. A set of 21 NDVI time-series layer-stack,
extracted from Sentinel-2 (S2) images, were used. The results showed that the Kernel function choice, and
the four internal parameters, namely, Penalty parameter, Gamma parameter, the Bias and the Degree, can
improve the classification accuracy. The best overall accuracy reached 94.50% using the polynomial function.
1 INTRODUCTION
With the contribution of remote sensing latest high
spatio-temporal resolution imagery (HSTRI), land-
cover classification and crop mapping have become
essential tools in agricultural management by
regularly assessing the vegetation status using various
technics in different parts of the globe (Anderson,
Allen, Morse, et al 2012; Mulla, D. J. 2013;
McDowell, Nate G., et al. 2015; Lawley, V., et al.
2016; Khanal, S., et al 2017). Nowadays, the
available and free S2 data, is the most popular source
of HSTRI used by researchers and decision makers
for this purpose (Moumni, A., et al 2019; Moumni,
A., et al 2020). In addition to remote sensing data
qualities, classification algorithms play an important
role in improving performance accuracies of crop
maps. Many previous studies have been focusing on
comparing various, well-known classification
algorithms in the remote sensing community in order
to provide useful documents describing the methods
a
https://orcid.org/0000-0002-1276-6877
b
https://orcid.org/0000-0002-0203-8462
c
https://orcid.org/0000-0002-2118-8570
and procedures for image classification . Different
articles compared different sets of classification
algorithms, Yu, Le, et al., (2014) investigated the
relationship between the classification accuracy,
publication date, extent of the study area, and
accuracies for different sensors and classification
algorithms. Li, Congcong, et al., (2014) compared the
performances of 15 image classification algorithms,
with the same Landsat Thematic Mapper (TM) data
set and the same classification scheme over
Guangzhou City, China. In terms of algorithms
performances, most case studies give different
outcomes, despite extensive work on classification
methods, questions comparing different techniques
remain unanswered (Khatami, R., et al 2016), for
example, sometimes Neural Networks (NN) performs
slightly better than Support Vector Machine (SVM),
sometimes it’s the other way, which depends on the
size of data, how it is handled and more importantly
the parameters configuration of each algorithm,
suffering from assignment issues, they significantly
can sometimes give unsatisfactory results. In this
context, certain studies have been focusing on the
evaluation of the performance of a given
classification algorithm by investigating its
parameters. Zhou, L., et al (2008) assessed the
impacts of several internal parameters of the multi-
layer-perceptron (MLP) neural networks, they
reported that a number of internal parameters
significantly affect classification accuracy, and
proposed a guideline that can facilitate the use of
neural networks for land cover classification. Huang
et al (2002) compared the outcome of different sets of
parameters of the Polynomial and Radial Basis
Function Kernels. Keuchel et al. (2003) compared the
classification accuracy of SVMs, maximum
likelihood and iterated conditional modes (ICM), and
suggested that attention should be payed to SVM
parameters. One noteworthy mention to Yang, X.
(2011), who constructed a set of SVMs with different
combinations of Kernel types and parameters, to
classify a Landsat Thematic Mapper image, and
stated that the improvement of the performance of
classification, can in fact be obtained by a careful
selection of parameter settings.
Our objective being the assessment of the impact
of internal parameters of the theoretically robust
classification technique SVM (Kernel types, Pyramid
Level, Penalty parameter, Gamma Parameter, the bias
and the degree) on the performance of SVM for land-
cover classification using remote sensed data. We
examined the efficiency of this technique in
classifying S2 derived NDVI time-series from 21
dates of 2018. The images were acquired over the
Haouz plain, in central of Morocco, and classified
into six land-cover classes. The implementation of the
algorithms has been software-based, and the results
were validated and quantified using ground truth
information.
The present work started with an introduction
clarifying the importance and the motivations behind
the creation of detailed and accurate land cover maps.
Then, we illustrated the main materials and methods
used in this study. After that, the obtained results were
presented and discussed in the third section. Finally,
we ended this paper with the main conclusions and
perspectives.
2 MATERIAL AND METHODS
2.1 Site Location
The Haouz plain is located in the eastern part of the
Marrakech-Safi region in central Morocco. It extends
in the west-to-east direction between the High Atlas
Mountains in the south and Jebilat hills in the north.
It is characterized by a semi-arid climate, where the
annual average of the rainfall is about 250mm. It is a
predominantly rural area where the agricultural sector
plays an important role. The mainly consistent crop
types in the area are: Cereals, Citrus and olive trees.
2.2 Sentinel-2 Data
S2 is a series of earth-observation satellites carrying
multi-spectral imagery (MSI) optical sensors. The
free of charge, atmospherically and geometrically
corrected 10-, 20- to 60- meter images are acquired
every 5 days. 21 cloud free images, ranged over the
seasons from January to December of 2018 were
selected to derive the Normalized Difference
Vegetation Index (NDVI) time-series. The NDVI was
chosen for being an efficient and popular index for
monitoring the vegetation. It was first introduced by
Tucker (1979). The ground truth samples were
collected during the spring of the same year. All the
samples were divided into two groups using a
proportionate random sampling approach: calibration
data and validation data.
2.3 ENVI Software and SVM
Parameters
Software-based, automated classification algorithms
are widely used in the field of remote sensing. ENVI
is a powerful image analysis software, commonly
used in the remote sensing society. It includes a suite
of image analysis tools, among which a variety of
supervised and unsupervised classification
algorithms, and particularly the SVM classifier. The
choice of a parametrization is always presented
before starting the classification. Unfortunately, the
parameters are often left by not-familiar users in
“default mode”. As to our work, evaluating the effect
of the parametrization on the outcoming classified
images, and presenting a guideline that can help
parameterize the SVMs, was part of our interest.
Although users do not need to fully understand the
theory behind SVM, brief basics are introduced.
Support Vector Machine is derived from the
statistical learning theory, first introduced by Vapnik
in 1979, often gives satisfying results from large and
noisy data. It separates the classes with a decision
surface called the optimal hyperplane that maximizes
the margin between the classes. The original optimal
hyperplane algorithm was a linear classifier,
nevertheless, SVM can be adapted to become a
nonlinear classifier through the use of nonlinear
functions called Kernels (Cortes and Vapnik, 1995).
Considering a set of training samples (Xi, Yi), i =
1,……, n where Xi ϵ Rn and y ϵ {1,-1}n, SVM
optimizes the problem by searching for a large margin
and a small error penalty, from a mathematical point
of view (Cortes and Vapnik, 1995), it requires the
solution of:
𝑀𝑖𝑛
𝑤,𝑏,𝜀
1
2
𝑤
𝑇
𝑤𝑃 𝜀
𝑖
𝑛
𝑖1
Such that:
𝑌
𝑖
𝑤
𝑇
𝛷
𝑋
𝑖
𝑏
1 𝜀
𝑖
𝑎𝑛𝑑 𝜀
𝑖
0
Where Φ is a function that project Xi into a higher
dimension, and P is the Penalty parameter (P>0).
Although new Kernels are being proposed by
researchers, the basic Kernels considered in this study
include the ones implemented in ENVI: linear,
polynomial, radial basis function, and sigmoid:
- Linear: K (Xi , Xj) = XiT Xj.
- Polynomial: K (Xi , Xj) = (γ × XiT Xj + r) d , γ > 0.
- Radial basis function (RBF):
K (Xi , Xj) = exp (-γ ×||Xi – Xj ||²), γ > 0.
- Sigmoid: K (Xi , Xj) = tanh (γ × XiT Xj + r).
Where K (Xi , Xj) = Φ (Xi)T Φ (Xj), γ is the Gamma
parameter, d the Degree and r the Bias.
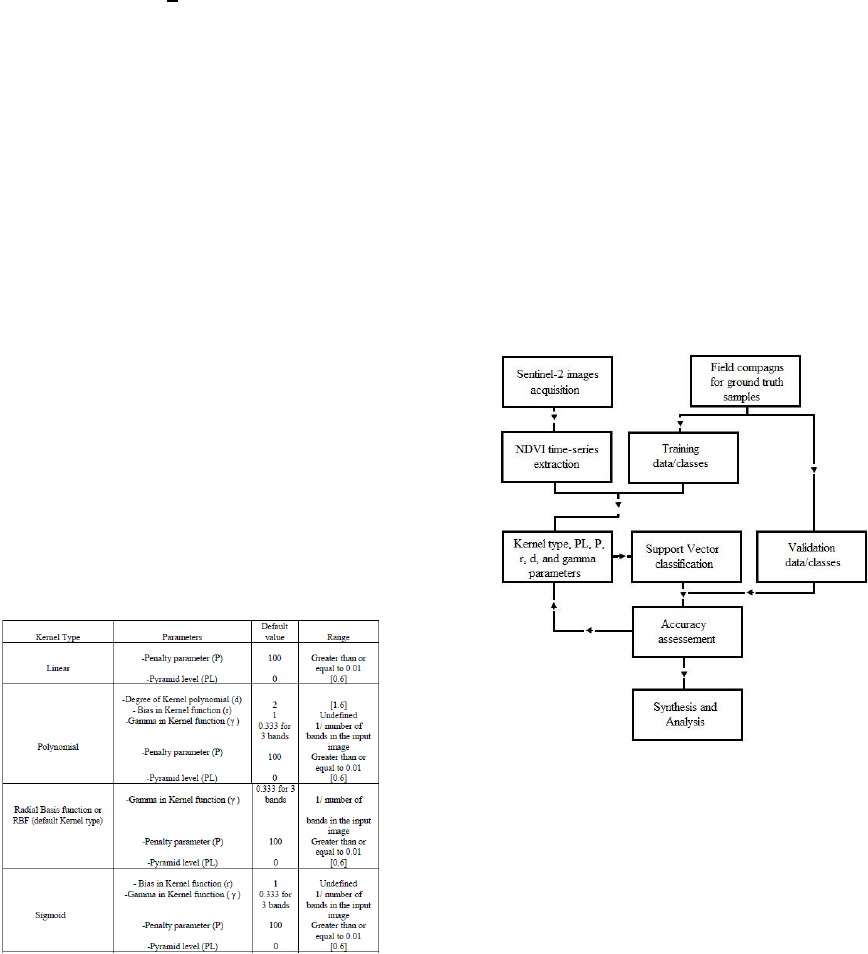
ENVI’s implementation of SVM includes the listed
above parameters, which are apparently dependent of
the Kernel Type. More details about the default and
ranges values are presented in the table below.
Table 1. Kernel functions, Default values and variation
ranges of SVM in ENVI.
2.4 Methodology
The methodological approach for this study consists
mainly on applying different parameter combination
scenarios, with the same input NDVI time series and
the same training/validation samples. The accuracy
assessment was evaluated using the generated
confusion matrix. The resulting OA, Kappa and
running time of each model were noted and analyzed
for determining the effect of the different sets on the
classification outcome. The number of combinations
can reach thousands if not millions, therefore the
approach consisted on a similar technique used by
Zhou, L., et al (2008). They altered the value of one
NN’s parameter while holding the others unchanged,
a way to separately evaluate each parameter’s effect
on the resulting classification’s accuracy and Kappa,
or the work of Yang, X. (2011), where he used the
same methodology but for SVM classifier. The
difference in our approach, is that we regularize one
parameter until an optimum is reached, then it’s value
will be fixed for the rest, a way of ensuring the best
performance of the Kernels, the same process is
repeated to the next one until all the parameters values
are investigated (Figure 1). The default set of
parameters of each Kernel function are chosen as
starting scenarios.
Figure 1: The methodological approach of the procedure
followed in this study.
3 RESULTS AND DISCUSSION
The ultimate goal of this study was to assess how
internal parameters of support vector machines, can
affect land-cover classification, when used to classify
NDVI time-series. The final number of models
investigated is 85, and which depended on the
resulting accuracies. We followed the up and down
evolutions of the accuracies until it has been clear
where the optimum resides. Radial basis function,
with a PL=0, a P=100, and Gamma=0.048, being the
default set of parameters for the SVM algorithm in
ENVI software, gave an OA of 92.76% and Kappa of
0.91(Table.4). While parameterizing the models, one
after another, we observed two important facts, the
first is: for all the four Kernel functions, the starting
configuration (Default parameters) increases by
varying the Penalty parameter for the linear and RBF
Kernel functions, the Degree and Bias for the
polynomial, and Gamma for the Sigmoid function.
The second fact is: generally, except for the
polynomial Kernel, increasing the Pyramid Level,
only decreases the OA, and surprisingly result in
more processing time (Tables.2-5). Polynomial
Kernel function, PL=2, P=100, Gamma=0.048, r=3
and d=6, resulted in the best accuracy and kappa in a
relatively good amount of processing time, and which
are of the order of 94.50% and 0.93 respectively
(Table.3).
For better visualization and analysis of the results,
figures 2, 3, 4 and 4 represent the variation of the OA
as the parameters are investigated. Flat areas reflect
the fact that the parameter in question doesn’t affect
the classification results at all. Meanwhile areas with
high slopes confirm that the parameter does affect the
outcoming results. A closer look to the results,
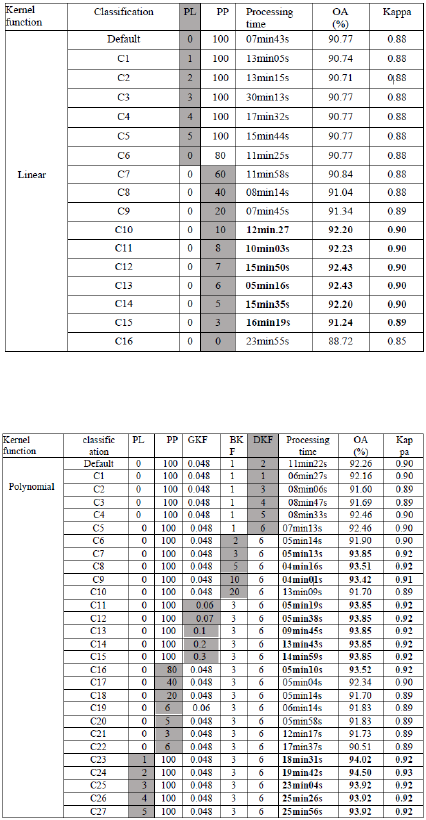
starting with the linear Kernel, we can summarize by
saying that, while it seems unaffected by the Pyramid
Level’s varying value, the OA increases when the
Penalty parameter decreases, and more specifically
when its value approaches the number of input
classes. It attains a maximum value of 92.43% and a
Kappa of 0.91 using this type of Kernel. The
polynomial Kernel is slightly sensitive to the degree
parameter, small fluctuations are observed, and the
OA increased as the degrees get greater, which is
consisting to the findings of Huang et al. (2002).
The Bias raised from 1 to 20 with non-regular
steps, and performed the best with a value of 3.
Gamma seemed to not affect the OA for values
between 0.048 and 0.3 and the performance was
rather stable. Meanwhile lowering the value of
penalty negatively affected it. A penalty of 2 helped
the polynomial Kernel to reach the best accuracy and
Kappa obtained for all the constructed models, which
equals 94.50 % and 0.93 respectively. The RBF
function, being the default Kernel, relatively to the
others, resulted in moderate OA, it’s affected the most
by the Penalty parameter and performed at its best
with a value of 60, namely, 92.99% OA and 0.91
Kappa. While Gamma does appear to generally not
affect the performance, raising the Pyramid Level
decreases it. And last, the Sigmoid function, similarly
to the RBF, performed best with a Penalty of 60, and
was quite sensitive when varying Gamma, still didn’t
improve. The best OA and Kappa found using this
Kernel is 92.99%.
Table 2: Overall accuracies, Kappa and processing time for
the linear Kernel type’s different combinations
Table 3: Overall accuracies, Kappa and processing time for
the Polynomial Kernel type’s different combinations.
Even though the OA and Kappa have increased
slightly when comparing the 85 models, given a large
area, the weight of this augmentation’s importance
can be great. For example, for a regular 100×100 Km
2
S2 image, for a spatial resolution of 10m, a 1.51% of
improvement represents about 1.51 million corrected
pixels, and an area of fifteen thousand one hundred
hectares. We mapped the best resulting classifications
for each of the four Kernel functions, obtained with
the optimal set of parameters.
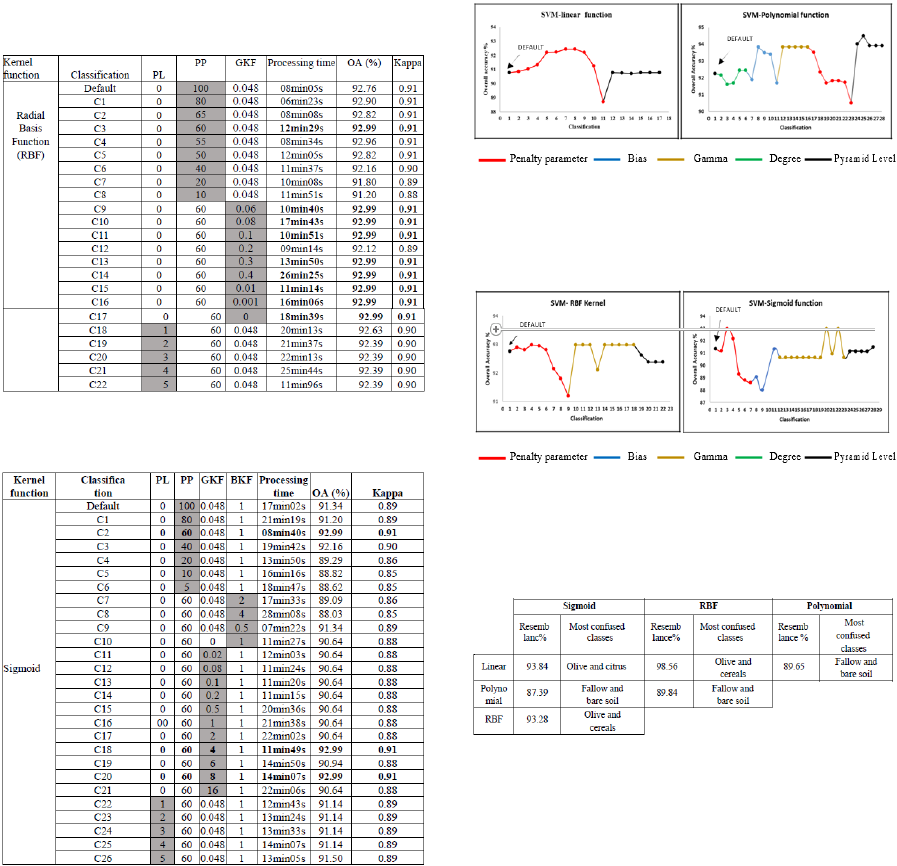
Table 4: Overall accuracies, Kappa and processing time for
the RBF Kernel type’s different combinations.
Table 5: Overall accuracies, Kappa and processing time for
the Sigmoid Kernel type’s different combinations.
Table 6 summarizes the percentage of
resemblance of the four maps and shows the most
confused classes. The Linear and RBF Kernels were
found to resemble each other the most, and hey both
performed like the Sigmoid Kernel more than the
Polynomial one. The nearest one to this latter, in
terms of performance is the RBF Kernel. A further
examination, shows that the classes that were
confused the most are fallow and bare soil, which is
natural, due to the fact that their spectral signatures
overlap, and not to mention that vegetation is absent
during the dry months.
Figure 2 and 3: To the left, combination of different
parameters using the Linear Kernel. To the right,
combination of different parameters using the polynomial
Kernel.
Figure 4 and 5: Combination of different parameters using
the RBF Kernel. To the right, Combination of different
parameters using the Sigmoid Kernel.
Table 6: Comparison of the four Kernels best combinations.
Additional experiments were done, using the
ground truth data of another area in the western part
of Haouz plain for the year of 2019. Seven thematic
classes were selected, including winter and summer
crops, for classification. The obtained results, with
standard parameters, gave an OA of 82.19 % and
kappa of 0.78. While, using the optimal parameters
obtained in this study, the classification accuracy
decreased and reached an OA of 72.06% and kappa
of 0.66. The main goal of these experiments is to
proof that such parameterization should be done for
each specific area depending on its land cover types.
4 CONCLUSIONS
This paper highlights the influence of SVM Kernel
types and internal parameters over the accuracy of the
land-cover classification of remote sensing data. 21
NDVI time-series derived from S2 images was used.
85 models were constructed from a combination of
four types of Kernels, between one to four Kernel
parameters (depending on Kernel’s type: The Penalty
parameter Gamma, the Bias and the Degree), and one
software-dependent parameter, the Pyramid Level.
Each model’s OA and Kappa coefficient were noted
and served as means of the performance evaluation.
The results showed that this techniques effectiveness,
does substantially depend on the Kernel’s choice and
the internal parameters combination. The polynomial
kernel outperformed the others, and attained, for
PL=2, P=100, r=3, d=6, and Gamma = 0.48, the best
OA and Kappa values: 94.50% and 0.93 respectively,
while the linear kernel performed the least with an
OA that can go down to 88.72% and Kappa of 0.85.
Overall, the models were quite sensitive to the
Penalty parameter and except for the polynomial
type, does not appear to improve when changing the
Pyramid Level, if not degrading the performance. We
hope that the work provided in the current paper,
would help as a guidance to applying SVM classifier
for the purpose of land cover classification of satellite
data, and encourage users to explore more the
different set of parameters. Further work would be
carried in exploring other powerful classifiers such as
the Neural Networks or the Random Forest.
REFERENCES
Anderson, M. C., Allen, R. G., Morse, A., & Kustas, W. P.
(2012). Use of Landsat thermal imagery in monitoring
evapotranspiration and managing water resources.
Remote Sensing of Environment, 122, 50-65.
Cortes, C., & Vapnik, V. (1995). Support-vector networks.
Machine learning, 20(3), 273-297.
Huang, C., Davis, L. S., & Townshend, J. R. G. (2002). An
assessment of support vector machines for land cover
classification. International Journal of remote sensing,
23(4), 725-749.
Keuchel, J., Naumann, S., Heiler, M., & Siegmund, A.
(2003). Automatic land cover analysis for Tenerife by
supervised classification using remotely sensed data.
Remote sensing of environment, 86(4), 530-541.
Khanal, S., Fulton, J., & Shearer, S. (2017). An overview
of current and potential applications of thermal remote
sensing in precision agriculture. Computers and
Electronics in Agriculture, 139, 22-32.
Khatami, R., Mountrakis, G., & Stehman, S. V. (2016). A
meta-analysis of remote sensing research on supervised
pixel-based land-cover image classification processes:
General guidelines for practitioners and future research.
Remote Sensing of Environment, 177, 89-100.
Lawley, V., Lewis, M., Clarke, K., & Ostendorf, B. (2016).
Site-based and remote sensing methods for monitoring
indicators of vegetation condition: An Australian
review. Ecological Indicators, 60, 1273-1283.
Li, C., Wang, J., Wang, L., Hu, L., & Gong, P. (2014).
Comparison of classification algorithms and training
sample sizes in urban land classification with Landsat
thematic mapper imagery. Remote Sensing, 6(2), 964-
983.
McDowell, N. G., Coops, N. C., Beck, P. S., Chambers, J.
Q., Gangodagamage, C., Hicke, J. A., ... & Meddens,
A. J. (2015). Global satellite monitoring of climate-
induced vegetation disturbances. Trends in plant
science, 20(2), 114-123.
Mishra, D., & Singh, B. N. (2019). Derivation of Magnitude
of Crop Diversity Through NDVI Composite Index
Using Sentinel-2 Satellite Imagery. Journal of the
Indian Society of Remote Sensing, 1-14.
Moumni, A., Sebbar, B., Simonneaux, V., Ezzahar, J., &
Lahrouni, A. (2019). Sample period dependent
classification approach for the cartography of crops in
the Haouz plain, Morocco. In Remote Sensing for
Agriculture, Ecosystems, and Hydrology XXI (Vol.
11149, p. 1114909). International Society for Optics
and Photonics.
Moumni, A., Sebbar, B. E., Simonneaux, V., Ezzahar, J., &
Lahrouni, A. (2020). Evaluation Of Sen2agri System
Over Semi-Arid Conditions: A Case Study Of The
Haouz Plain In Central Morocco. In 2020
Mediterranean and Middle-East Geoscience and
Remote Sensing Symposium (M2GARSS) (pp. 343-
346). IEEE.
Mulla, D. J. (2013). Twenty five years of remote sensing in
precision agriculture: Key advances and remaining
knowledge gaps. Biosystems engineering, 114(4), 358-
371.
Thanh Noi, P., & Kappas, M. (2018). Comparison of
random forest, k-nearest neighbor, and support vector
machine classifiers for land cover classification using
Sentinel-2 imagery. Sensors, 18(1), 18.
Tucker, C. J. (1979). Red and photographic infrared linear
combinations for monitoring vegetation. Remote
sensing of Environment, 8(2), 127-150.
Vapnik, V. N. (1979). Reconstruction of Dependences from
Empirical Data.
Wilkinson, G. G. (2005). Results and implications of a
study of fifteen years of satellite image classification
experiments. IEEE Transactions on Geoscience and
remote sensing, 43(3), 433-440.
Yang, X. (2011). Parameterizing support vector machines
for land cover classification. Photogrammetric
Engineering & Remote Sensing, 77(1), 27-37.
Yu, L., Liang, L., Wang, J., Zhao, Y., Cheng, Q., Hu, L., ...
& Li, X. (2014). Meta-discoveries from a synthesis of
satellite-based land-cover mapping research.
International Journal of Remote Sensing, 35(13), 4573-
4588.
Zhou, L., & Yang, X. (2008). Use of neural networks for
land cover classification from remotely sensed imagery.
The International Archives of the Photogrammetry,
Remote Sensing and Spatial Information Sciences, 37,
575-578.
