
Backend Design of Web-based ECG Signal Monitoring System
Arjon Turnip
1*
, Muhammad Taufik
1
, Nanang Rohadi
1
, Emiliano
1
, Erwin Sitompul
2
, Ferlin Firdaus
Turnip
3
, George Michael T.
4
, Muhammad Ilham Rizqyawan
5
,
Bernardo Nugroho Yahya
6
1
Electrical Engineering Department, Padjadjaran University, Bandung, Indonesia
2
Study Program of Electrical Engineering, Faculty of Engineering, President University, Indonesia
3
Porlak Parna AgroTourism Company, Jakarta, Indonesia
4
Electrical Engineering, Institut Teknologi Nasional, Indonesia
5
Technical Implementation Unit for Instrumentation Development, Indonesian Institute of Sciences, Indonesia
6
Industrial & Management Engineering, Hankuk University of Foreign Studies, Republic of Korea
Keywords: Arrhythmia, ECG, MQTT, Rest Api, JSON, Frontend.
Abstract: Arrhythmias are disorders that occur in the heart rhythm. People with arrhythmias usually feel a heart rhythm
that is too fast, too slow, or irregular. The purpose of this study was to facilitate medical personnel in
monitoring the patient's heart rate by using a web-based ECG monitoring system in real time. The process of
this tool starts with the patient using a heart recording device, then the results of the heart recording are sent
to the database using the MQTT broker, then the data will be requested by the Frontend via the API and then
the API will check the data into the database. If the data is found, the data will be returned by the API in JSON
form and then displayed by JavaScript to the Frontend. Database was built using PostgreSQL with Rest Api
using Flask. From several experiments conducted, the results of 100% data return by Api in the form of JSON
were achieved.
1 INTRODUCTION
In 2017, more than 17.7 million people died from
cardiovascular disease (CVD) (World Health
Organization, 2017) so it is known to be the biggest
cause of death in the world. CVD is associated with
disorders of the heart and blood vessels that often
cause heart arrhythmias, strokes, hypertension, and
heart failure.
Arrhythmias are disorders that occur in the
rhythm of the heart. Arrhythmia sufferers can feel a
heart rhythm that is too fast, too slow, or irregular
(Alodokter, 2020). There are several types of
arrhythmias, including atrial fibrillation, AV block,
supraventricular tachycardia, ventricular extra
systole, and ventricular fibrillation.
One way to diagnose arrhythmias is by using an
electrocardiogram (ECG). An EKG is a common
diagnostic test used to evaluate heart function using
an electrical impulse detection machine. This
machine is used to detect any abnormalities or
malfunctions in the heart's electrical system. The
patient's heart is recorded using a device called an
electrocardiograph. Recording is usually done for 5 to
8 minutes. The monitoring process is carried out by
the doctor by looking at the waves that are displayed
on the monitoring screen which is usually printed on
paper.
Recently, there is an arrhythmia diagnostic tool
that can be used on patients for 24 hours or more to
record the heartbeat, namely BITalino. However,
doctors have difficulty monitoring the recording
process of the patient's heart, because they are not
always with the patient. For that we need an ECG
signal monitoring system that can make it easier for
doctors to monitor the results of the patient's heartbeat
record anytime and anywhere.
There is research on feature extraction for heart
rate classification from electrocardiogram recordings
which were carried out using Wavelet-based features
(Saragih et al, 2019; Amri et al, 2016; Rizqyawan et
al, 2016). In this study, feature extraction uses a
wavelet transform-based method with the Haar
wavelet coefficient of the ECG signal slice
representing one beat. The features are built from
each coefficient of the transformed decomposition of
the ECG signal slice with a simple statistical
Turnip, A., Taufik, M., Rohadi, N., Emiliano, ., Sitompul, E., Turnip, F., Michael T., G., Rizqyawan, M. and Yahya, B.
Backend Design of Web-based ECG Signal Monitoring System.
DOI: 10.5220/0010371403170324
In Proceedings of the International Conference on Health Informatics, Medical, Biological Engineering, and Pharmaceutical (HIMBEP 2020), pages 317-324
ISBN: 978-989-758-500-5
Copyright
c
2021 by SCITEPRESS – Science and Technology Publications, Lda. All rights reserved
317

approach, namely the mean, standard deviation of
kurtosis and skewness.
Another study is the detection of Arrhythmias
using ECG signals with the R-Peak detection method
(Setiawan et al, 2019; Turnip et al, 2018; Wijaya et
al, 2019). There are several signal processing
processes used, namely signal filtering, QRS complex
detection, signal squaring, complex detection of beats
per minute, and classification. In order to identify
heart defects, signal processing can be performed
using a variety of applications. Apart from
classification, a system for monitoring the patient's
condition is also needed. Research conducted by Syah
Alam et al (Alam, Hartanto and Pratama, 2019) in his
paper entitled Design of a heart rate monitoring
system using a Bluetooth-based electrocardiogram
and labview. The design is carried out using an
electrode sensor connected to the initial amplifier,
band pass filter, final amplifier, clamper circuit, and
Arduino Uno connected to the HC-05 serial Bluetooth
module and finally monitored using a Personal
Computer Labview. The server can access the ECG
monitoring application using Bluetooth with a
distance of 5 meters without obstruction and 3 meters
with a barrier. The application can display the ECG
recordings properly and display data visualization on
the PC server.
Novita Karolina et al (Novita Krolina, Ristanto
Hulu, 2019) created a web-based heart rate detection
system. The data from the heart rate recording are
processed and processed via Arduino. The data is sent
in the form of waves through the ESP8226 module,
which is in the form of Beat Per Minute (BPM).
Average results are obtained in the form of graphs and
numbers. The system displays the time during use and
the device reads the heart rate, then displays it on the
web which can be accessed at any time. This
monitoring tool has a sensor input response that
varies according to the condition of the heart rate read
on the pulse sensor. The design of the equipment used
consists of a series of sensors, an amplifier circuit for
heart rate, an ESP 8266 circuit and a microcontroller.
The design of a heart rate monitoring system was
also carried out by Ria Hariri et al (Hariri, Hakim and
Lestari, 2019; Turnip et al, 2018). They created a
heart rate monitoring system using the AD8232
sensor based on the Internet of Things which resulted
in a 100% successful percentage of sending data to
websites using the internet. However, there is an error
from the results of the tool calibration using the ECG
simulator by 1.7%. The measurement result data is
successfully monitored on a web application using an
android or a PC so that monitoring of heart conditions
can be done anywhere and anytime in real time
(Oktarino et al, 2019; Afriansyah et al, 2019).
In a study entitled IoT based Real Time ECG
Monitoring System using Cypress Wiced (Deshpande
and Kulkarni, 2017), ECG monitoring was carried out
using the Cypres IoT platform which is integrated
with the device. The method of collecting ECG data
is done using a non-intrusive sensor monitoring
wearable device where the data is sent directly to the
cloud using Wi-Fi with high data rates. Cloud IoT is
responsible for visualizing ECG data and storing data
for further analysis. The server used consists of 3
parts, namely: HTTP server, MQTT server, and
storage server.
There is another journal about Internet of Things-
based Systems entitled Design of Internet of Things
(IoT) systems for monitoring and predicting heart
attack symptoms (Supriyatna and Away, 2019). The
study used an AS8232 ECG sensor integrated with an
Arduino and Raspberry Pi microcontroller for the
purpose of monitoring a user's heart rate. The
microcontroller used is the Wemos d1 mini which
functions to perform computations for controlling the
Internet of Things system using the C programming
language. This microcontroller sends ECG sensor
data through the cloud and is received by the
Thingspeak server before being displayed on a
channel that has been servered so that it can be
accessed via a browser. This system has been
successfully built and tested. The results of this
system trial are heart rate data and buzzer data from
monitoring and predicting heart attack symptoms.
Furthermore, we need a system that is able to receive
real-time patient heart record results and
classification results.
Based on the above background, this study aims
to build a web-based ECG signal monitoring system
to make it easier for doctors to monitor patient heart
rate results in real time. This study has a problem
limitation, namely the system built is the back of the
whole system, where this section is directly related to
the microcontroller through the server or often known
as the backend system. Backend ECG signal
monitoring system built on a web basis using the
PostgreSQL database. The output of this backend
system is data in the form of a JSON API that can be
displayed in realtime. The process of requesting data
to the database uses the Flask API.
HIMBEP 2020 - International Conference on Health Informatics, Medical, Biological Engineering, and Pharmaceutical
318
2 METHOD
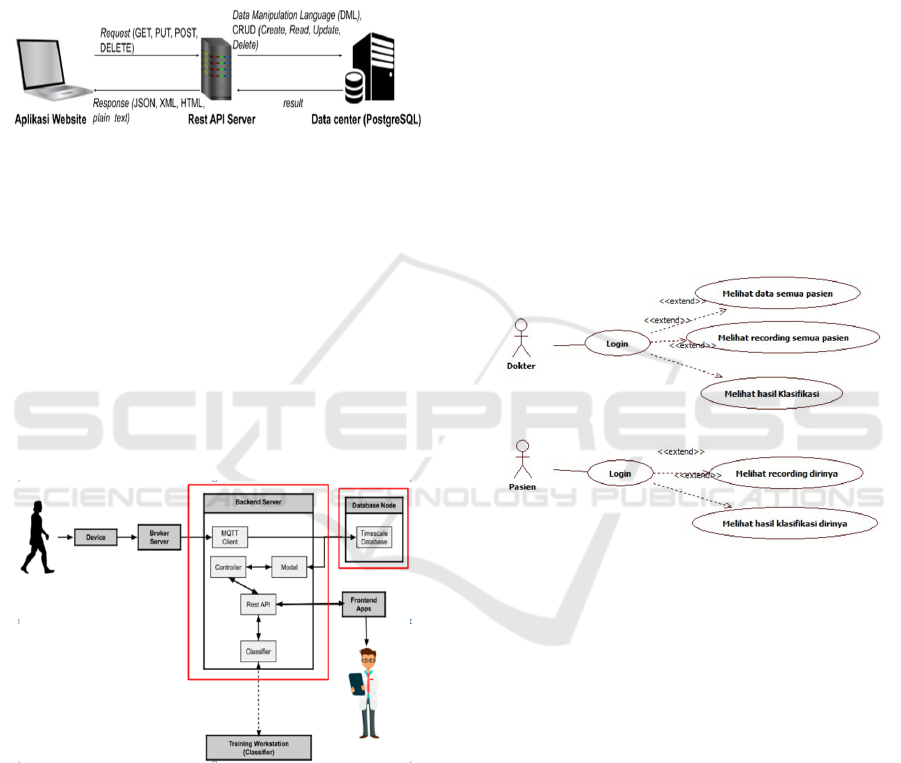
2.1 Web Service REST API Structure
The structure of the Rest API web service is a
structure that describes the data exchange process on
the system backend. The structure is shown in Figure
1.
Figure 1: Web Service Structure.
The flow of data exchange starts from the website
application that requests data to the Rest API Server. Then
the server checks the requested data into the database. If the
requested data is in the database, the data will be retrieved
and forwarded by the API Server to be displayed on the
website application
.
2.2 System Architecture Design
The system architecture is a description of the flow of
system development components. In this study, the
architectural design of the ECG signal monitoring
system is shown in Figure 2.
Figure 2: System Architecture Design.
In Figure 2, there are several components of the
system, such as: devices, broker servers, backend
servers, database nodes, front end apps, and training
workstations. The architectural flow starts from the
device, which is a sensor attached to the patient's
body to record heart activity. The data is sent to the
broker server to be stored in the database via program
code on the backend server. The data is processed
based on a request on the front end of the monitoring
application by the doctor through the Rest API JSON
to be classified. The API request is processed using
the backend server program code which returns data
to be displayed on the front end. The classification
results are in the form of labels that are saved again
to the database. However, in this study only a backend
server and database node were built, such as the red
box in Figure 2.
2.3 Use Case Diagram
Use Case Diagrams are used to describe the features
that users can perform on the system, in this case the
functional requirements of the system. Users or actors
who play a role in the use of this system are doctors
and patients. Doctors can do several things on the
system such as: log in, view patient data, monitor
patient heart recordings. Patients can log in and see
the results of their own heart records.
The design of the use case diagram of the ECG
signal monitoring system can be seen in Figure 3.
Figure 3: Design Use Case Diagram.
2.4 Entity Relationship Diagram
Entity relationship diagram is a model that describes
the relationship between variables through their
attributes. The proposed ECG signal monitoring
system uses 4 tables as shown in Figure 4.
Backend Design of Web-based ECG Signal Monitoring System
319
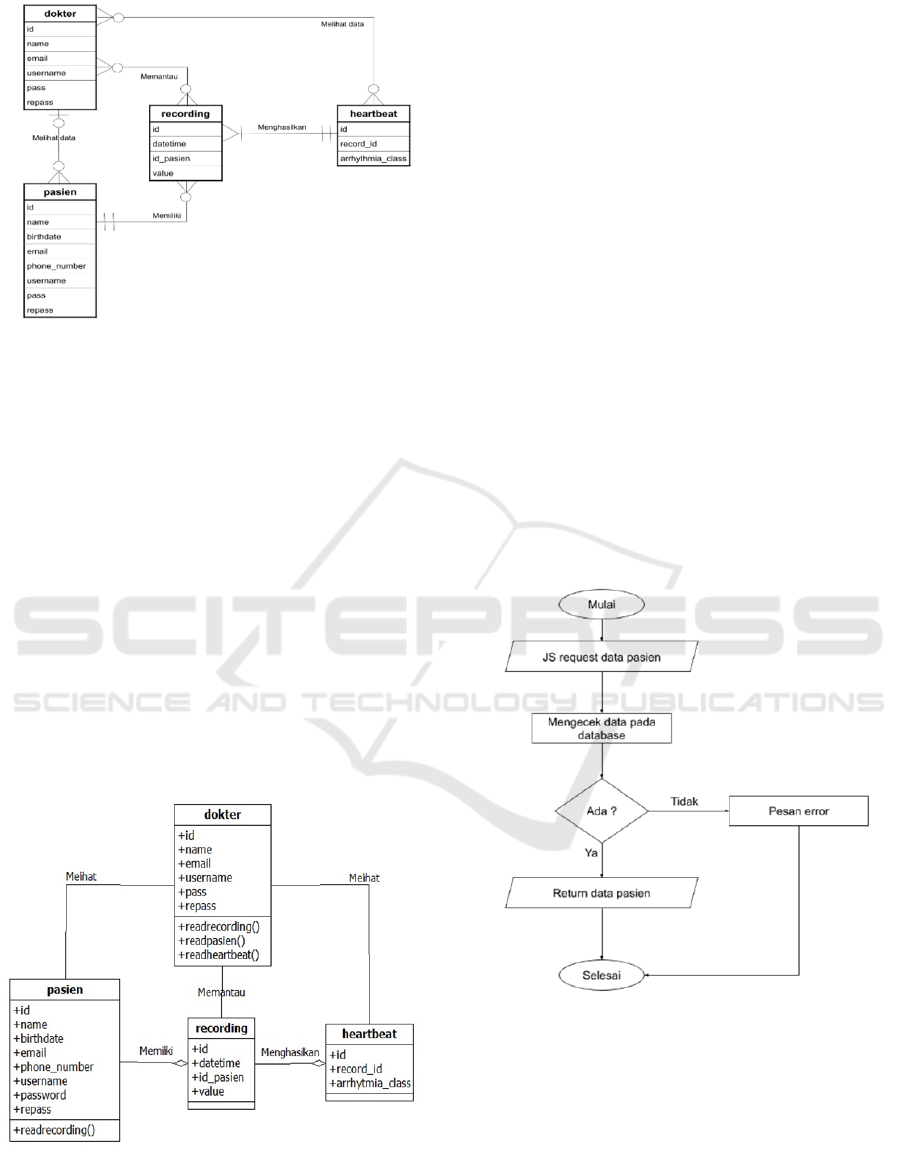
Figure 4: Entity Relationship Diagram.
In Figure 4, the doctor table has a relationship
with the patient table with a cardinality of 1: n,
meaning that the doctor can monitor more than 1
patient and 1 patient is handled by 1 doctor. The
patient table is related to the record table with 1: n
cardinality where 1 patient can have 1 many
recordings and 1 data record can have 1 patient.
Furthermore, 1 recording table has a relationship with
1 heartbeat table with 1: 1 cardinality where 1 data
recording can have 1 heartbeat data and results in the
classification of artemia class.
2.5 Class Diagram
Class diagram is a system visualization that describes
the relationship between entities through the
functions of each entity. The proposed class diagram
uses 4 entities which are depicted in Figure 5.
Figure 5: Class Diagram.
Figure 5 describes each entity and its functions.
These functions will be implemented as functions
when coding the program. A flowchart is a sequence
of instructions depicted with symbols. In this study,
there are 3 types of data requests by the front end of
the monitoring system on the Rest API that have been
made on the backend system. The flowchart of the
patient data request process is shown in Figure 6.
In Figure 6, requesting patient data starts from the
front end requesting data using the API. Then the
backend system will check the request data to the
database. If the data exists, then the Patient data will
be returned using the API and displayed on the front
end application, but if the data does not exist, an error
message will appear or there is no data. While the
flowchart of the request data recording process for
patient data is shown in Figure 7.
Figure 7 shows the instructions for requesting all
data recording on selected patient data. Assuming the
doctor has selected the data of one patient, then in the
application, the front end requests all the data
recordings of the patient that has been selected using
the API. Then the function in the backend program
code will be executed and displays all the data
recordings of the selected patient. If found, the data
will be displayed in the form of an API, but if the data
does not exist, an error message will be displayed.
Figure 6: Flowchart proses request patient data.
HIMBEP 2020 - International Conference on Health Informatics, Medical, Biological Engineering, and Pharmaceutical
320
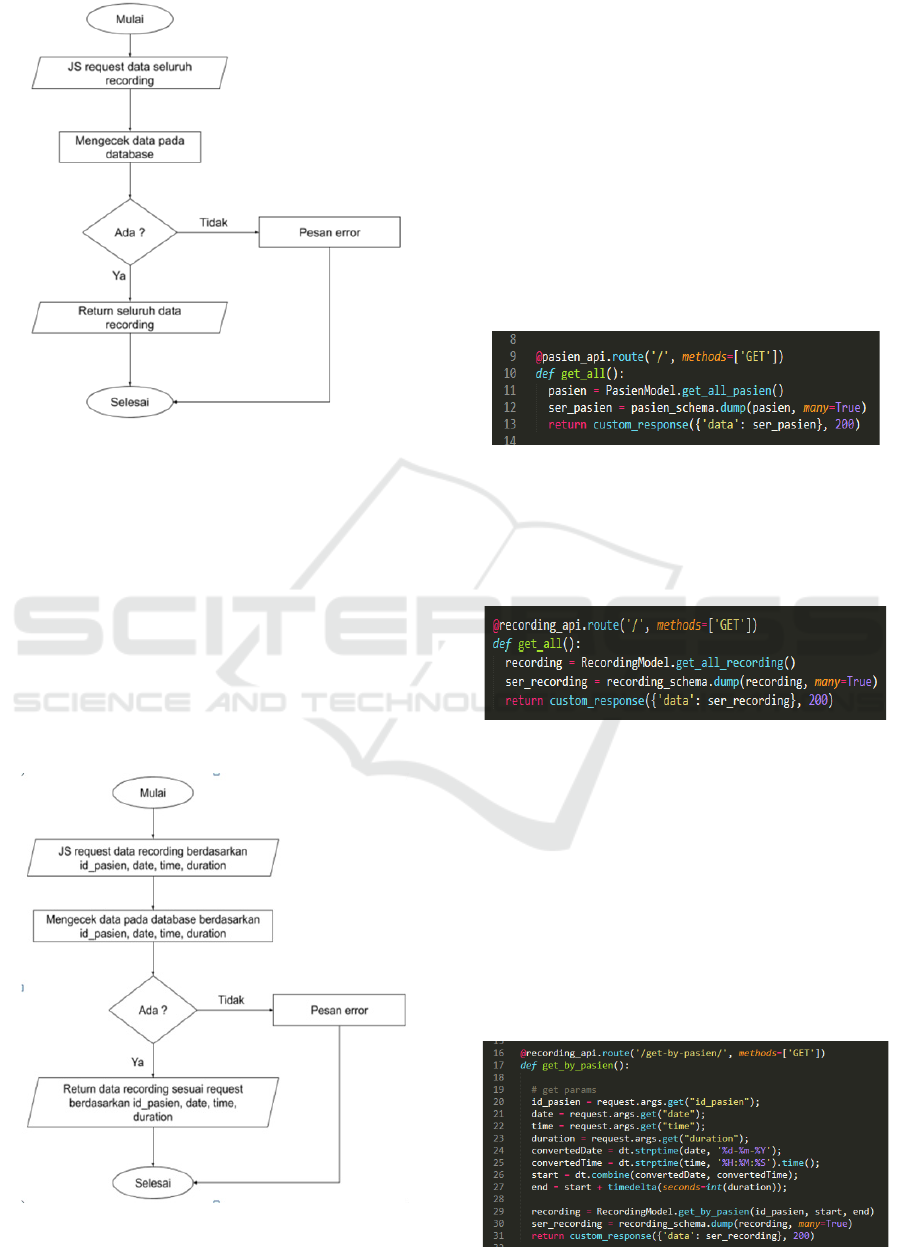
Figure 7: Flowchart of the entire data recording request
process.
The flowchart of the request data recording
process based on the selected filtering is shown in
Figure 8. Figure 8 describes the data recording
request instructions based on the filtered attributes,
such as patient id, date, time, and duration. The front
end requests data recording based on the filter on that
attribute. Then the function in the backend program
code will be executed and displays the data recording
based on the filter. If the data exists, it will appear in
the form of an API, but if the data is not there, an error
message will appear.
Figure 8: Flowchart of the data recording request process
based on filtering.
2.6 Data Retrieval Program Code
Program code is an implementation of class diagram
design. Each program code is wrapped into a function to
execute a backend system command, such as receiving data
requests from the front end and displaying it in the form of
an API in JSON format. The patient data retrieval program
code is a program code that executes the command
displaying all patient data. The code part of the patient data
retrieval program is shown in Figure 9. In Figure 9, the
program code is wrapped into the get_all () function and the
function executes the command displaying the data of all
monitored patients. The output of this function is patient
data in the form of an API
.
Figure 9: Code of patient data collection program.
A data recording retrieval program code is a
program code that executes a command displaying all
data recordings of the selected patient. The part of the
data recording program code is shown in Figure 10.
Figure 10: Data recording program code.
In Figure 10, the program code is wrapped into the
get_all () function and the function executes the
command displaying the patient record data of the
selected patient. The output of this function is a
patient data recording in the form of an API.
The data recording program code based on several
filter attributes will display the data recording based
on attributes such as: patient id, date, time and
duration. The part of the program code is shown in
Figure 11.
Backend Design of Web-based ECG Signal Monitoring System
321
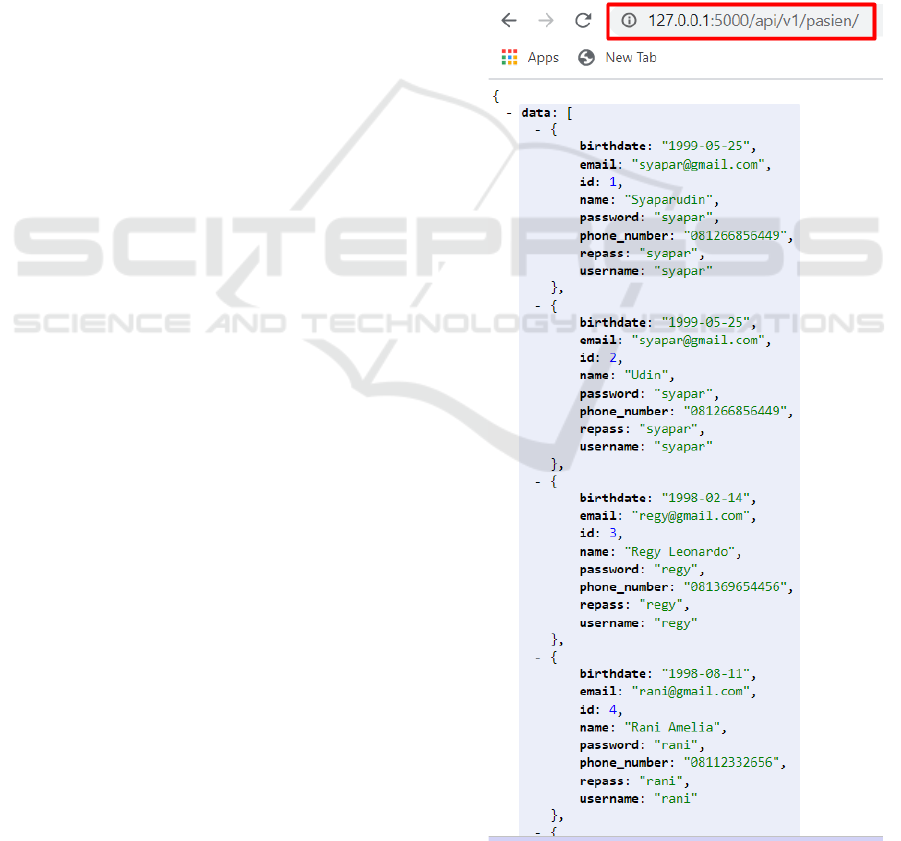
Figure 11: Data recording program code based on patient
id, date, time, duration.
In Figure 11, the code for a data recording
retrieval program based on these attributes is packed
into the get_by_pasien () function and the function
executes the command displaying the data recording.
For example, the front end requests a patient data
recording with id 1, on August 8, 10:00:00, with a
duration of 30 seconds, it will display patient data
recordings from 10:00:00 to 10:00:30.
3 RESULTS AND DISCUSSIONS
Each data request results from the front end will be
returned and displayed by the Backend server in the
form of a JSON API. Furthermore, the data is
converted to be displayed on the front end
application.
3.1 Request Patient Data
The Backend system has provided the url endpoint
used by the front end to access the data. On requesting
patient data, the end point provided is
domain.com/api/v1/ppatient. This endpoint is used by
the front end to retrieve patient data in the form of a
JSON API. The output of this endpoint can be seen in
Figure 12.
3.2 Request All Recording Data
Backend system has provided url endpoint to access
all data recordings of selected patients, namely
domain.com/api/v1/recording. This endpoint is used
by the front end to retrieve and return patient data
recordings in the form of a JSON API. The output of
this endpoint can be seen in Figure 13.
3.3 Request Data Recording based on
Id_Pasien, Date, Time, Duration,
with Duration = 6
The backend system provides an endpoint for
displaying recorded data based on patient id, date,
time, and duration. The endpoint is
domain.com/api/v1/recording/get-by-
pasien?date={tanggal}&time={waktu}&duration={
durasi}& id_pasien={id_pasien}.
This endpoint is used by the front end to request
data recording based on patient_id, date, time and
duration, then the backend system will return and
display the data in the form of a JSON API. The
output from this endpoint can be seen in Figure 14.
Figure 14 is the result of requesting data at the
following endpoints:
domain.com/api/v1/recording/get-by-
pasien?date=01-
082020&time=01:34:27&duration=6&
id_pasien=4.
The endpoint accessed the patient's data recording
having id 4 with a duration of 6 seconds. Another
example is the use of an endpoint with multiple
attributes shown in Figure 15.
HIMBEP 2020 - International Conference on Health Informatics, Medical, Biological Engineering, and Pharmaceutical
322
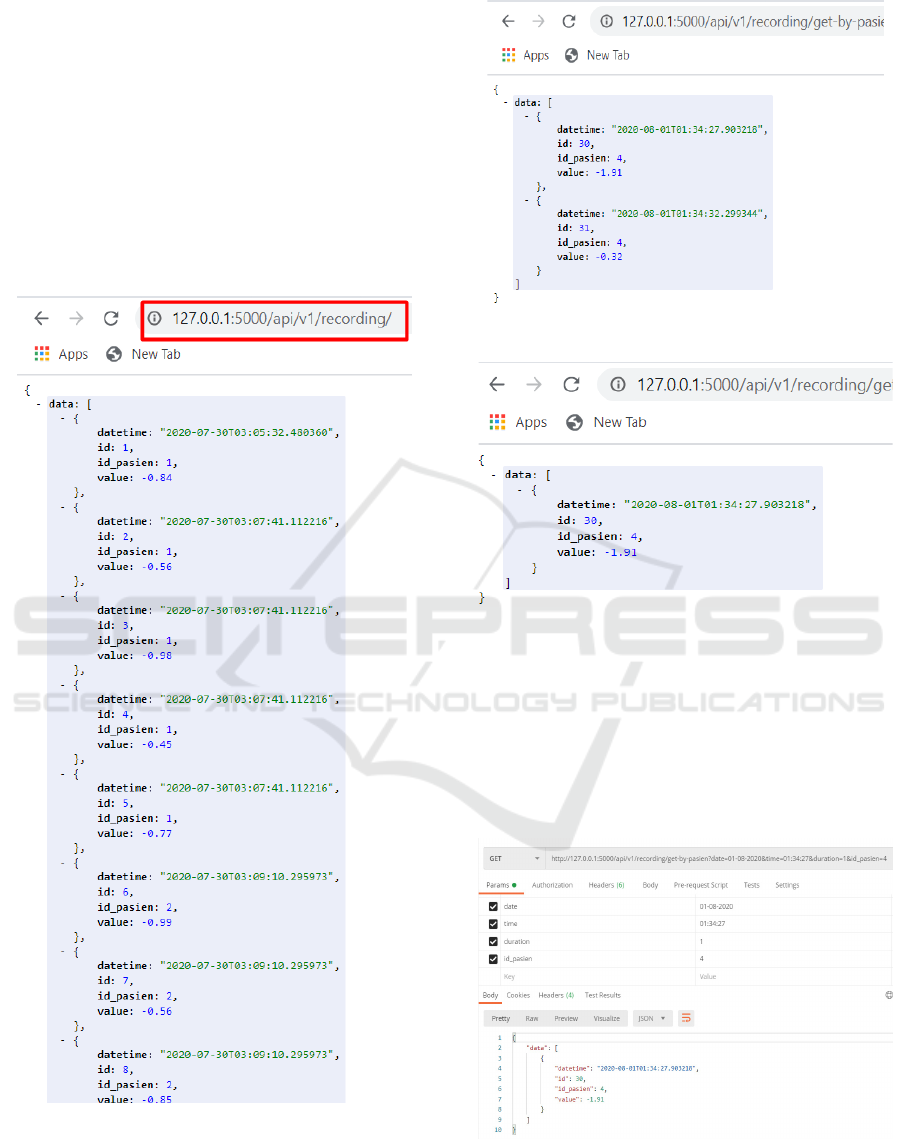
Figure 12: Request for patient data in the form of a JSON
API.
The output uses the following endpoints:
domain.com/api/v1/recording/get-by-
pasien?date=01-
082020&time=01:34:27&duration=
1&id_pasien=4.
The endpoint accesses the data recording of a patient
having id 4 with a duration of 1 second.
Figure 13: Request data recording.
Figure 14: Request data recording based on filter 1.
Figure 15: Request data recording based on filter 2.
3.4 Request using Postman
Postman is an application that functions as a test site
for creating url endpoints. How to use this application
is to enter the url endpoint that has been created with
or without parameters. An example of its use is shown
in Figure 16.
Figure 16: Request using postman.
Figure 16 describes the url endpoint entered in the
Postman application with parameter id 4, August 1, 1
Backend Design of Web-based ECG Signal Monitoring System
323

minute 34 seconds 27 for 1 second, then produces
data in the form of API JSON.
4 CONCLUSIONS
Based on the results of development, testing, and after
conducting several experiments, it was found that the
Backend system that has been built can be used to
return and display the data requested by the front end.
The backend system can also be used to be connected
to a sensor device that is attached to the patient's
body. The Backend system displays data in the form
of an API with JSON data format. In further
development, a system by connecting sensor data
with the system's backend endpoint url, and the
development of an Android-based monitoring
application will be built.
REFERENCES
Afriansyah, A., Oktarino, A & Turnip, A., 2019. Expert
System for Diagnosing Children Allergic Diseases
through Web Forward Chaining. Internetworking
Indonesia Journal, 11(2).
Alam, S., Hartanto, S. and Pratama, I., 2019. (Design of a
Heart Rate Monitoring System Using a Bluetooth-
Based Electrocardiograph and Labview), JTT (Jurnal
Teknologi Terapan), 5(2), pp. 47–55. doi:
10.31884/jtt.v5i2.215.
Alodokter., 2020. Jantung, alodokter.com. Available at:
https://www.alodokter.com/jantung#:~:text=Jantung
adalah organ tubuh yang,memompa darah ke seluruh
tubuh.
Amri, M. F., Rizqyawan, M. I., Turnip, A., "ECG signal
processing using offline-wavelet transform method
based on ECG-IoT device," 2016 3rd International
Conference on Information Technology, Computer, and
Electrical Engineering (ICITACEE), Semarang, 2016,
pp. 1-6, doi: 10.1109/ICITACEE.2016.7892404.
Deshpande, U. U. and Kulkarni, M. A., 2017. ‘IoT based
Real Time ECG Monitoring System using Cypress
WICED’, International Journal of Advanced Research
in Electrical, 6(2), pp. 710–720. doi:
10.15662/IJAREEIE.2017.0602035.
Hariri, R., Hakim, L. and Lestari, R. F., 2019. (Heart Rate
Monitoring System Using AD8232 Sensor Based on
Internet of Things), Jurnal Telekomunikasi dan
Komputer, 9(3), p. 164. doi:
10.22441/incomtech.v9i3.7075.
Novita Krolina, Ristanto Hulu, Y. L., 2019. (Web Based
Heart Rate Detection), 3(1), pp. 13–16.
Oktarino, A., Afriansyah, A & Turnip, A., 2019. Design
and Implementation of Android-Based Village Fund
Monitoring Application. Internetworking Indonesia
Journal, 12(1).
Rizqyawan, M. I., Amri, M. F., Pratama. R. P. and Turnip,
A., "Design and development of Android-based cloud
ECG monitoring system," 2016 3rd International
Conference on Information Technology, Computer, and
Electrical Engineering (ICITACEE), Semarang, 2016,
pp. 1-5, doi: 10.1109/ICITACEE.2016.7892444.
Saragih, Y. V., Widodo, A. W. and Rahman, M. A., 2019.
(Wavelet-Based Feature Selection for Heart Rate
Classification from Electrocardiogram Records), 3(4),
pp. 3140–3147.
Setiawan, A. W., Djohan, R. A. and Tawakal, F. I., 2019.
(Arrhythmia Detection Using ECG Signal with R-Peak
Detection Method), Seniati, 5, pp. 123–128.
Supriyatna, H. A. and Away, Y., 2019. (Internet of Things
(IoT) System Design for Monitoring and Predicting
Heart Attack Symptoms), Karya Ilmiah Teknik Elektro,
4(1), pp. 31–39.
Turnip, M., Dharma, A., Pamungkas, D., et al., An
Application of Zero Cross QRS Detection Algorithm of
ECG Signals with Various Subject Conditions, IEEE
International Conference on Applied Engineering
(ICAE), 3-4 Oct. 2018. DOI:
10.1109/INCAE.2018.8579419.
Turnip, M., Saragih, R., Dharma, A., et al., Extraction of
ECG signal with adaptive filter for hearth abnormalities
detection, Journal of Physics: Conference Series, vol.
1007 (2018) 012019 doi :10.1088/1742-
6596/1007/1/012019 .
World Health Organization., 2017. Cardiovascular diseases
(CVDs), who.int. Available at:
http://www.who.int/mediacentre/factsheets/fs317/en/.
Wijaya ,C., Andrian, M., Harahap, M., Turnip, A.,
Abnormalities State Detection from P-Wave, QRS
Complex, and T-Wave in Noisy ECG, Journal of
Physics: Conference Series, Volume 1230, (2019)
012015. doi:10.1088/1742-6596/1230/1/012015.
HIMBEP 2020 - International Conference on Health Informatics, Medical, Biological Engineering, and Pharmaceutical
324
