
IoT Data Analytics in Retail: Framework and Implementation
Jānis Grabis, Kristina Jegorova and Krišjānis Pinka
Institute of Information Technology, Faculty of Computer Science and Information Technology,
Riga Technical University, Kalku Street 1, LV-1658, Riga, Latvia
Keywords: Customer Experience, Ambient Conditions, IoT Analytics.
Abstract: IoT data analytics has many potential applications in the retail industry. However, relations among ambient
conditions at stores as measured by IoT devices and sales performance are not well understood. This paper
explores sensory and sales data provided by a large retail chain to quantify the impact of air quality,
temperature, humidity and lighting on customer behaviour. It has been determined that the air quality and
humidity have a significant impact and temperature appears to have a non-linear effect on customer behaviour.
The data analysis findings are used to configure an IoT data analytics platform. The platform is used to
monitor the ambient conditions in retail stores, to evaluate a need for improving the conditions as well as to
enact improvement by passing them over to a building management system.
1 INTRODUCTION
Customer experience is a paramount to the retail
industry. It has many dimensions such as sensorial,
affective, physical, social and cognitive (Lemon and
Verhoef 2016). In the case of brick and mortar
retailing, vendors have to make any effort to retain
customers and to compete with on-line shopping
(Misra et al. 2017). The customers should be offered
a comfortable and enjoyable environment. Modern
computing and data processing capabilities provide
opportunities for measuring and improving customer
experience. Internet of Things (IoT) is one the
technologies allowing to measure conditions at
retailing facilities and data analytics processes these
measurements to elaborate solutions for improving
the customer experience. IoT helps businesses to
harness and process data to improve operations and
increase customer satisfaction (Shrikanth 2016).
Automation opportunities of IoT help service
industry in reducing costs and improving customer
service. IoT enables the concept of constant
connectivity to provide complete picture of on-going
retailing processes (Berthiaume (2019).
However, the current trends indicate that the retail
industry lags other industries in usage of the IoT
technologies (Shanhong 2018) what could be caused
by lack of understanding of relations between
customer experience and environmental conditions as
measured using IoT devices. That requires empirical
investigations analysing sensory information in
relation to sales data and customer behaviour (Ben-
Daya 2019). Additionally, deployment of IoT devices
and supporting data analytical solutions is a complex
endeavorment and requires sophisticated technological
platforms (Weyrich and Ebert 2016). The solution
should be setup-up according to the results of data
analysis and continuously operated to monitor condi-
tions at retailing facilities and to enact improvements.
The objective of this paper is to empirically test
relations between environmental conditions in a retail
store and customer behaviour as well as to outline a
technological solution for deploying IoT data
analytics. The paper considers data analysis case
study using data provided by a large retailing
company. The data set and problem description are
made available by the European Data Incubator
program. Statistical data analysis is performed what
yields rules for setting up a system used to control the
environmental conditions. An IoT data analytical
platform is proposed for hosting these rules as well as
for monitoring the current environmental conditions.
The contributions of the paper are practical
quantification of relations among the environmental
conditions and customer behaviour and sales
performance as well as a proposal for implementing the
results of data analysis.
The rest of the paper is organized as follows.
Section 2 discussed applications of IoT in retail and
customer experience dimensions. Empirical data
analysis is reported in Section 3. Section 4 outlines a
solution for implementing the results of IoT data
analytics. Section 5 concludes.
Grabis, J., Jegorova, K. and Pinka, K.
IoT Data Analytics in Retail: Framework and Implementation.
DOI: 10.5220/0010133700930100
In Proceedings of the International Conference on Innovative Intelligent Industrial Production and Logistics (IN4PL 2020), pages 93-100
ISBN: 978-989-758-476-3
Copyright
c
2020 by SCITEPRESS – Science and Technology Publications, Lda. All rights reserved
93
2 FRAMEWORK
To better understand value of using IoT analytics in
retail, customer experience dimensions are analysed.
A brief literature review is conducted on IoT
applications in retail.
2.1 Dimensions
The customer experience and behaviour are
influenced by many factors. The theoretical analysis
of existing research is conducted to identify these
factors with focus on suitability of IoT technologies
for addressing these factors. The customer experience
dimensions are summarized in Table 1. They concern
various aspect of customer journey and some of them
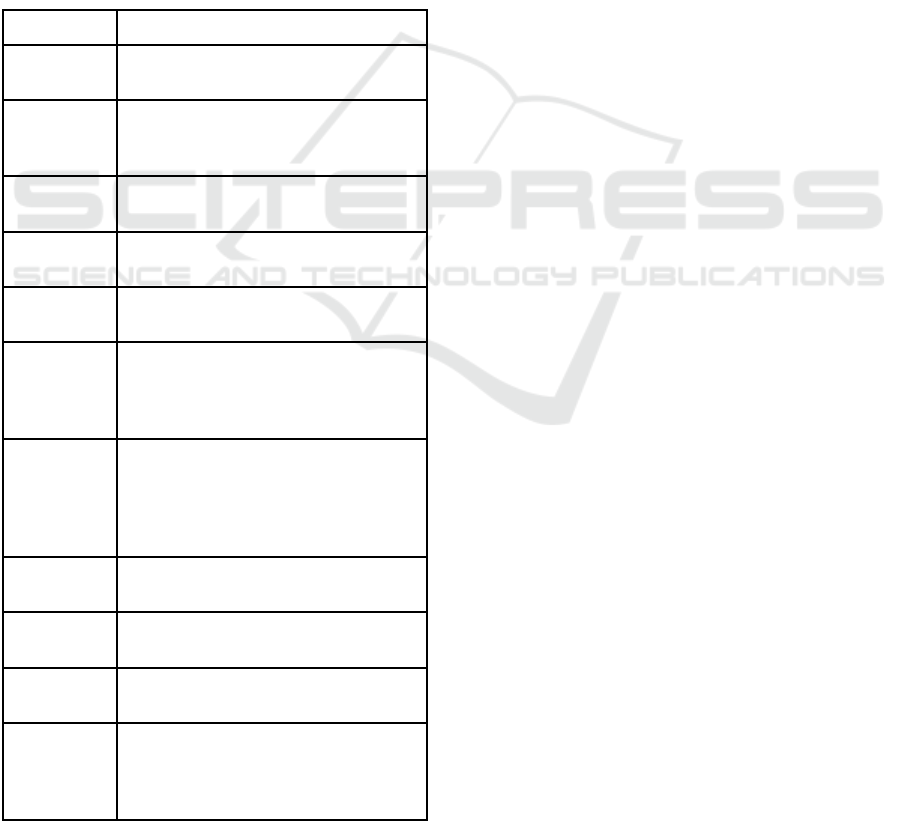
Table 1: Dimensions of customer experience.
Author Dimensions
Parasuraman
(1988)
Reliability, Responsiveness, Assurance,
Empathy, Tangibility
Schmitt (1999)
Sensory (sense), Affective (feel),
Cognitive (think), Physical (act), Social-
identity (relate) experiences
Wolfinbarger
(2003)
Website design, Fulfilment/Reliability,
Security/ Privacy, Customer service
Parasuraman et
al. (2005)
Efficiency, Fulfilment, System
availability, Privacy
Fornerino
(2008)
Sensorial, Affective, Physical/ Behavioral,
Social, Cognitive
Gentile et al.
(2007)
Sensorial component, Emotional
component, Cognitive component,
Pragmatic component, Lifestyle
component, Relational component.
Verhoef et al.
(2009)
Social environment, Service interface,
(Retail) Store atmosphere, Assortment,
Price and promotions (including loyalty
programs), CEs in an alternative channel,
Retail brand, Past customer experience.
Lemke et al.
(2011)
Communication encounter, Service
encounter, Usage encounter
Klaus &
Maklan (2013
Product experience, Outcome focus,
Moments of truth, Peace of mind
Kim and Choi
2013
Service outcome quality, Interaction
quality, Peer-to-peer quality
Handayani
2019
Accessibility, Competence, Customer
recognition, Willingness to help, Personal
treatment, Problem solving, Fulfilment o
f
promises, Value for time
are within retailer’s control (e.g., service interface,
retail atmosphere, assortment, price) whole others are
outside of the retailer’s control (e.g., influence of
others, purpose of shopping) (Verhoef et al. 2009).
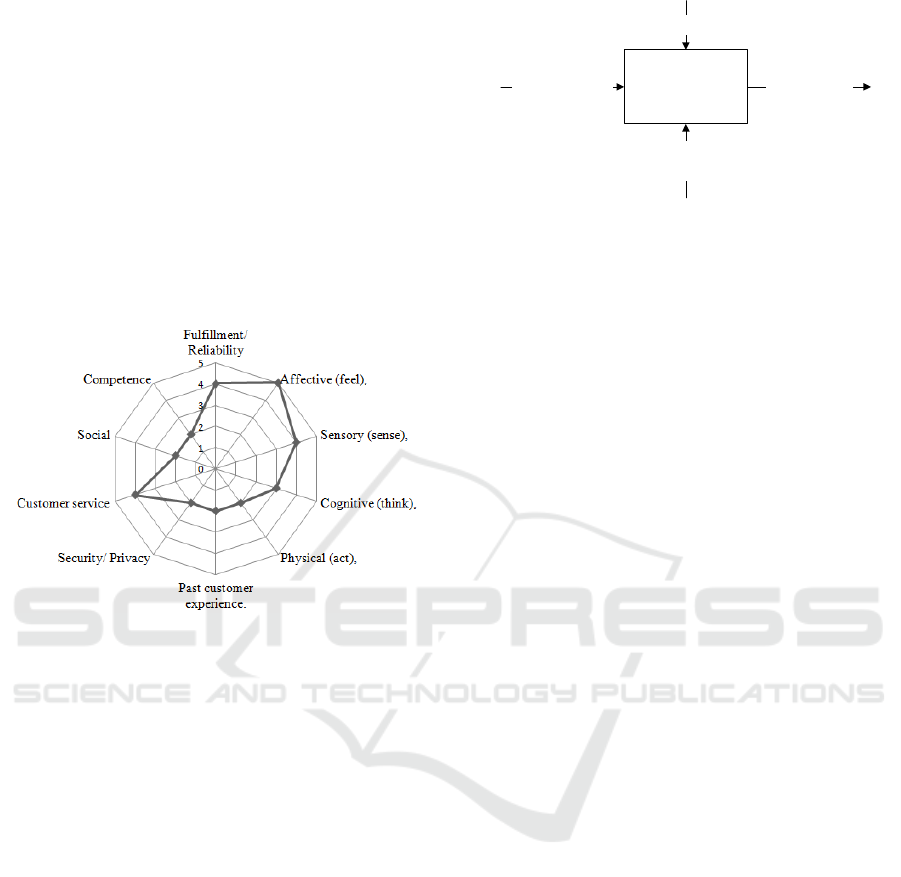
The identified dimensions are categorized 10 groups
(Figure 1 shows the number of research works
considering the dimensions belonging to a category).
The most frequently considered dimensions are in
affective, sensory, customer service and
fulfilment/reliability. Some of these elements can be
controlled by retailers. Traditional product
presentation now has less impact than sensations as
what customers see, feel, hear and touch (Arineli and
Quintella 2015). Bagdare (2015) observes that
customers’ mood and behaviour depend on many
elements like - music, lights, colours, displays,
fragrances, soft and cozy ambience. Thus, the
dimensions “affective”, and “sensory” are more
important in customer experience analysis.
Consumers perceive shopping as a mode of
relaxation, free-time activity or a habit. New
expectations and needs have been created from
changes in people's lifestyle and increased comfort
Sathish and Venkatesakumar (2011). These
observations confirm that ambient or environmental
conditions are very significant aspects of the affective
and sensory dimensions of customer experience. IoT
analytics is well suited to measure and interpret of
these conditions.
2.2 IoT in Retailing
IoT technologies have found many applications in
retailing. The industry survey shows that 37% of food
and grocery companies already experiment with IoT
technology or have successfully initiated IoT services
or products and further 58% are planning to expand
their utilization of the technology (Irish 2017). IoT
helps to improve both internal operations and
customer facing processes. Patil (2017) identifies a
number of operational benefits including
personalization, dynamic pricing, inventory tracking
and monitoring, and recommendations. Energy
efficient smart thermostats and lighting are also
mentioned. Sensors provide real-time stock
information what is used to improve demand
forecasts and optimize inventories (Kolassa 2019).
IoT improves monitoring and control by coding and
tracking objects (Madakam et al. 2015). That allows
companies to become more efficient, accelerate
processes, decrease errors and avoid theft (Gaur et al.
2017). The real-time data provided by sensors allows
stakeholders to make better operational decisions
(Balaji and Roy 2017).
IN4PL 2020 - International Conference on Innovative Intelligent Industrial Production and Logistics
94
IoT-connected smart labels provide means for
identification of products as well as for providing
additionally information (Fernandez-Carames and
Fraga-Lamas 2018a). This information can be
combined with personalization and recommendation
services to enrich shopping experience with pervasive
displays and smart things (Longo 2013). IoT provides
means to engage customer throughout the product
life-cycle (Fernandez-Carames and Fraga-Lamas
2018b). For example, smart textiles can communicate
with smartphones to process biometric information.
The life-cycle support requires an adequate IoT
architecture ensuring efficient and secure data
processing.
Figure 1: Categorization of customer experience
dimensions and their frequency of mentioning in research
works.
To summarize, retailers use IoT for inventory
management, product tracking, equipment control
and customer engagement. From the customer
perspective, the existing research focuses on
customer service, customer experience and fulfilment
dimensions. However, there is little work on using
IoT in relation to the impact of ambient or
environmental conditions on customer behaviour in
retailing. Therefore, this paper focuses on the sensory
dimension and the impact of environmental
conditions on the customer behaviour. That is
conceptually represented as an IDEF0 activity in
Figure 2. An IoT platform is used to harness sensory
measurements of the environmental conditions.
These are used by a Building Management Systems
(BMS) to alter environmental controls and to improve
the environmental conditions at a retail store. That
should result in improved sales performance. In order
to achieve that, relations among the sales performance
and the sensor measurements should be understood to
properly configure BMS.
A0
Sales
Sensor
measurements
BMS
IoT
platform
Sales
performance
Figure 2: The IDEF0 model of the sales activity.
3 DATA ANALYSIS
Empirical data are used to investigate relationships
among the environmental conditions, customer
behaviour and sales performance. The data are
provided by a large retail chain (more than 2000
stores and 30.000 employees), which have
accumulated sensor measurements in their stores are
well as sales data (EDI 2019). The data are gathered
over the period from February 25th, 2019 till March
3rd, 2019 with store’s operating hours 8:00 am to
10:00 pm. The data come from a single store and
contain more than 60 000 purchase lines or registered
transactions. The purchase lines belong to more than
7000 purchase orders. Over 150 000 sensor
measurements are available for each sensor. The
sensor data are not recorded strictly at the specific
time intervals and there are missing data.
The company aims to interpret the effect of the
ambient conditions of the stores in customer
behaviour (EDI 2019). The main question for the
analysis is about the effect of lighting conditions,
temperature and humidity on the customer basket
size. That involves determining thresholds for
unfavourable ambient conditions. The company also
expects to have a technological solution in the form
of a decision support system that can analyse the IoT
data along with the transactions in the store. The
sensor data provided include measurements of air
quality (higher values correspond to worse air
quality), humidity, lighting and temperature. These
can be used to control the affective and sensory
aspects of customer experience. All customer
transactions are recorded and the following sales
performance measurements are considered in this
investigation:
• Number of items (N)– number of different
products purchased by a customer in one store
visit (i.e., number of items in shopping basket);
• Weight of purchases (W) – weight of all products
purchased by a customer in one store visit;
IoT Data Analytics in Retail: Framework and Implementation
95
• Quantity of items (Q) – quantity of items of all
products (summed across all types of products)
purchased by a customer in one store visit.
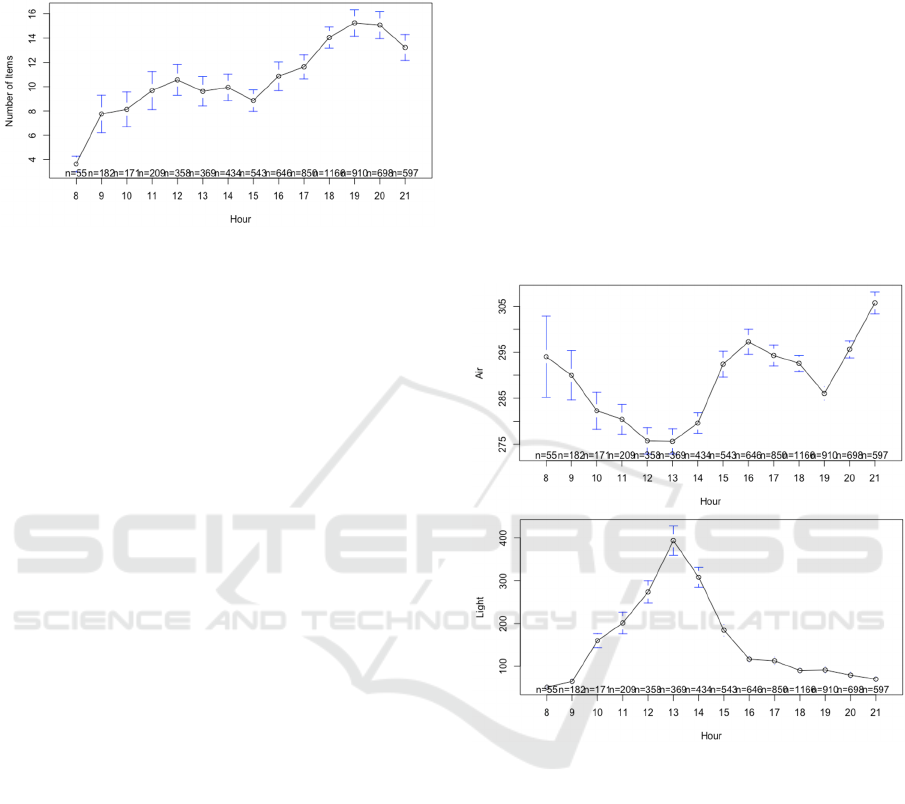
Figure 3: The average number of items N in the shopping
basket by hour.
The value of transactions is not a part of the data
set and names of products are not known. It is
assumed that the measures indirectly characterize
sales performance (i.e., a large number of items
implies better sales performance) and customer
behaviour (e.g., their willingness to pick-up more
items and carry more weight).
After data pre-processing (e.g., standardizing data
recording frequency for the sensors and treatment of
missing data), the statistical analysis is carried out to
identify relationships among the environmental
conditions as measured by the sensors and sales
performance and customer behaviour. It is identified
that the shopping behaviour depends on the hour of
the day (Figure 3). It can be observed that the
purchases are relatively stable from 9:00 to 16:00 and
they increase significantly from 17:00 to 22:00. The
number of transactions increases gradually
throughout the day till 18:00 and then gradually
decreases. The environmental conditions also vary
significantly depending on the hour. However, every
environmental indicator has a different pattern. The
air quality is the best around the noon and deteriorates
in the afternoon as the busiest shopping hours
approach (Figure 4). The pattern suggests that the air
quality controls are only partially aligned with the
customer behaviour. The lighting measurements have
very distinctive spike at 13:00 and have significantly
lower value from 16:00 and on.
In order to analyse relationships among the
customer behaviour and the environmental
conditions, the ANOVA analysis is conducted. The
linear model is considered is:
∗
,
where s refers to the sensor group, j refers to the
individual measurement,
∗
ln
logarithmic
transformation of N to reduce data skewness,
is
the random noise. air, light, humidity and temp refer
to air quality, lighting, humidity and temperature
sensor measurements, respectively. The results
(Table 2) confirm that the hour of the day
significantly affects the customer behaviour. The air
quality and humidity are the most significant factors
of the sensory factors. The lighting is a statistically
significant impact at the 5% significance level. The
temperature appears not to have a significant impact
on the customer behaviour. Similar results were also
obtained for the weight of purchases and quantity of
items.
Figure 4: The impact of time on environmental conditions:
the average air quality by hour (upper pane) and the average
lighting by hour (lower pane).
To reduce noisiness and to improve
interpretability of the relations, the sensor
measurements are factorized in quintiles of equal
number of observations. The number of items
depending on the category of sensor measurements is
reported in Figure 5. The figure suggests that the
number of items purchased decreases if the air quality
is low. The number items purchased is by
approximately 50% smaller in the 5th quintile than in
the 2nd quintile. The relative decline of the number
of items purchased in the 1st quintile (the best air
quality) can be explained by interactions between the
air quality and hour of the day factors. The number of
items purchased is relatively stable according to the
IN4PL 2020 - International Conference on Innovative Intelligent Industrial Production and Logistics
96
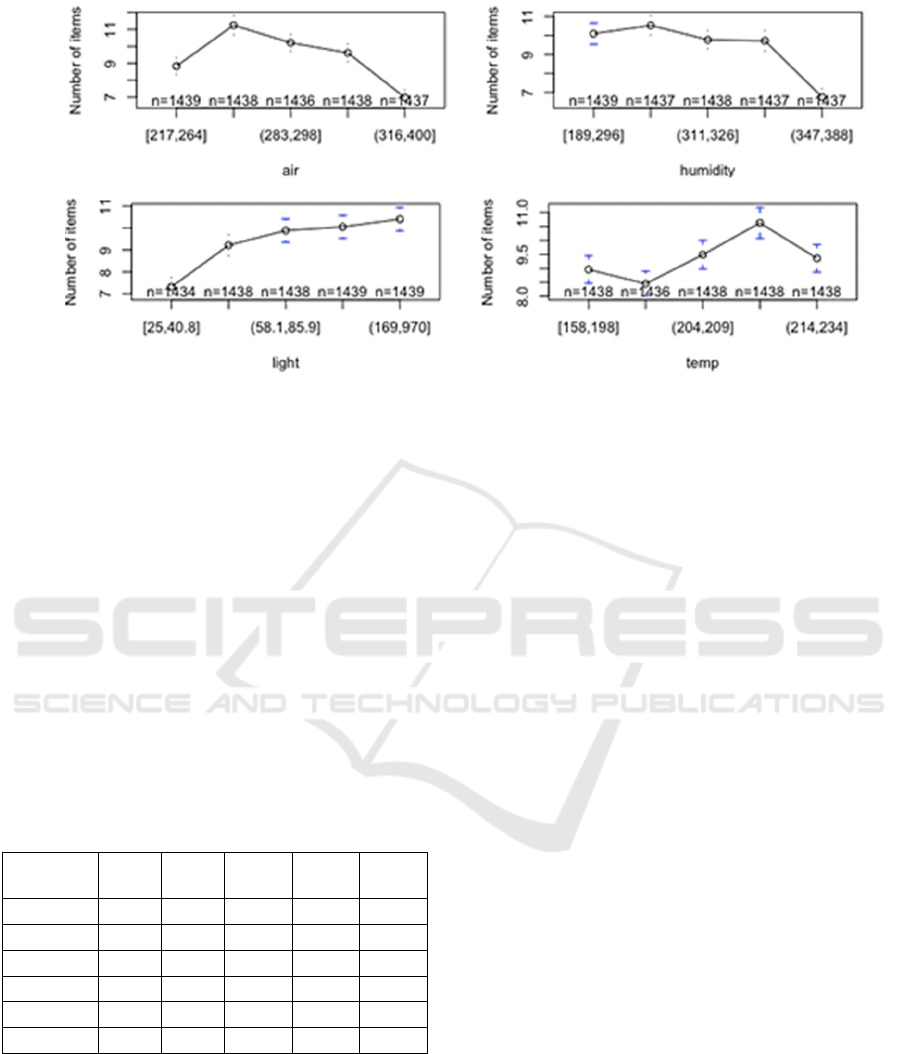
Figure 5: The average number of items N according to the quintile of sensory measurements.
humidity factor in all quintiles but the fifth. Improved
lighting gradually increases the number of items
purchased. The ANOVA analysis showed that the
temperature is not a significant factor although Figure
4 suggests that there are non-linear relation customers
not liking either too cold or hot conditions. The
number of items purchased is the largest if
temperature is in the fourth quintile. These
observations are useful to formulate rules for
managing environmental conditions to be used in the
IoT platform. Figure 6 illustrates dependence of
weight W of purchases on the environmental
conditions. It confirms that the performance measures
N, W and Q used to represent the customer behaviour
follow the similar pattern.
Table 2: The ANOVA analysis of N* according to hour and
sensory measurements.
Sensor DF Sum
Sq
Mean
Sq
F
value
P
Air 1 60 60.1 59.13 0.000
Light 1 4 4.2 4.138 0.042
Humidity 1 85 84.8 83.41 0.000
Temp 1 0 0.3 0.301 0.583
Hour 1 435 434.9 427.9 0.000
Residuals 7182 7299 1 1
4 IMPLEMENTATION
A suitable technological solution is used to
implement the findings about the relations between
customer behaviour and the environmental
conditions. The solution is a platform integrating data
from IoT devices and other data sources, evaluating a
need to improve the environmental conditions and
invoking a building management system to enact the
improvements. It is adopted from previous studies on
context aware and adaptive systems (Kampars and
Grabis 2018).
Component of the IoT data analytics platform is
shown in Figure 7. Stream processing units K
m
are
responsible for receiving raw data from data
providers (1) and handling internal data streams. The
archiving jobs store the data in persistence storage
and evaluation jobs use the raw data to evaluate the
environmental conditions and the evaluation results
are sent to internal stream processing (4), where they
are forwarded for evaluation by triggering jobs used
to invoke improvement actions (6). If triggering
conditions are met (7), an improvement action is
generated and posted to BMS (8,9). All potentially
computationally intensive tasks are executed in
dedicated containers in a cluster to ensure high
performance. SP is implemented using Apache Kafka
streaming platform. Evaluation jobs are built using
Apache Spark big data analytics engine and the
adaption engine is based on Docker containers. The
infrastructure is provided using CloudStack cloud
infrastructure tools.
In the case study considered, IoT data analysis
yielded that if the air quality deteriorates beyond the
lower boundary of the air quality 5th quintile, it
should be improved (i.e., by powering AC) to avoid
decreasing sales. This results in implemented in the
IoT data analytics platform. The air sensor is one of
the IoT devices providing data.
The platform continuously measures
environmental conditions and compares them with
the threshold. Figure 8 shows the air quality and sales
IoT Data Analytics in Retail: Framework and Implementation
97
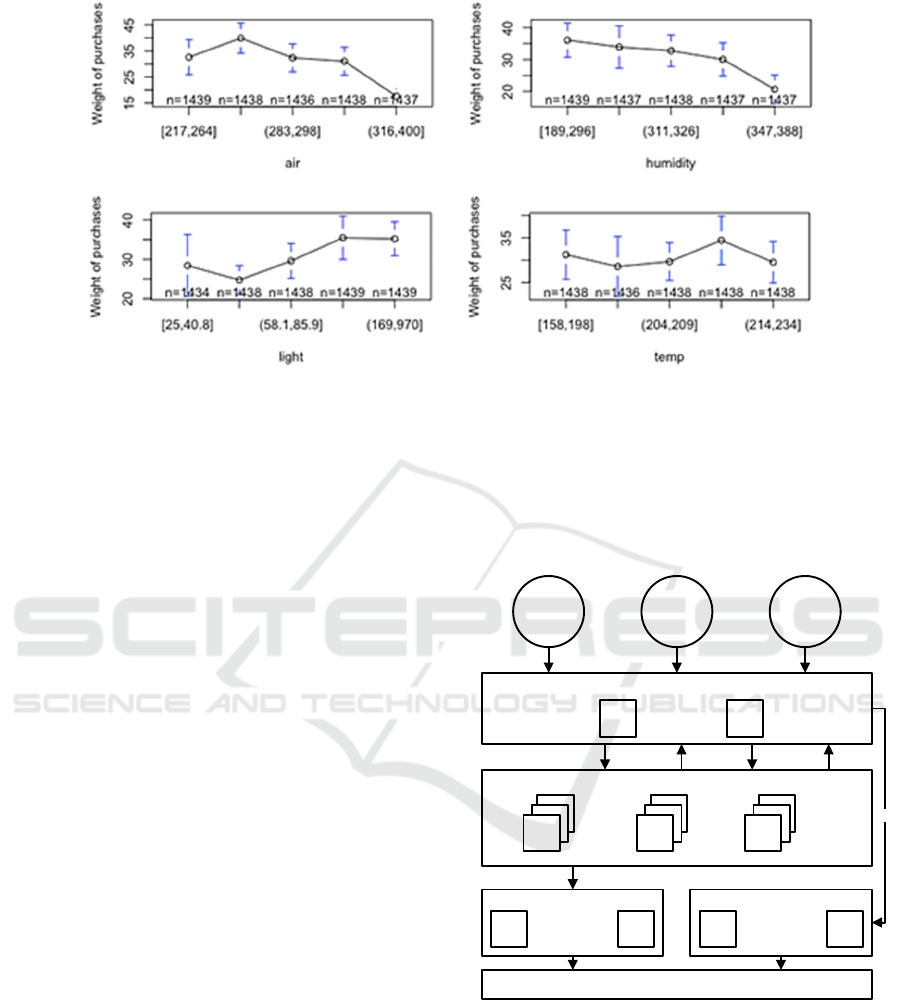
Figure 6: The average weight of purchases W according to the quintile of sensory measurements.
data according to time. It can be observed that
occasionally the air quality exceeds the acceptable
level, which is specified as a lower boundary of the
fifth quintile of the air quality. The analytical suggests
that this deterioration of the air quality leads to
decreased sales. Upon these circumstances, the IoT
data analytics platform should trigger an action to
improve the air quality by BMS. In this case, the
improvement logics is relatively simple while the
platform allows implementation of logics of arbitrary
complexity.
The platform continuously measures
environmental conditions and compares them with
the threshold. Figure 8 shows the air quality and sales
data according to time. It can be observed that
occasionally the air quality exceeds the acceptable
level, which is specified as a lower boundary of the
fifth quintile of the air quality. The analytical suggests
that this deterioration of the air quality leads to
decreased sales. Upon these circumstances, the IoT
data analytics platform should trigger an action to
improve the air quality by BMS. In this case, the
improvement logics is relatively simple while the
platform allows implementation of logics of arbitrary
complexity.
There are various alternatives to the proposed
platform and comprehensive comparison is beyond
the scope of this paper. The main advantages of the
platform are the use of open technologies, ability to
integrate various data providers, decoupling of
information requirements from data supply and
separation of IoT analytics from the core BMS
system. The decoupling allows to setup the system in
various stores in a large chain, where different types
of sensors might be used. The separation allows
delegation of computationally intensive tasks to the
platform without overloading BMS and using the IoT
analytics with various types of BMS as well as other
systems used in customer relationships management.
The platform is horizontally scalable for application
in large retail chains and can benefit from data
exchange among the stores.
Stream processing (SP)
Evaluation of environmental conditions (EEC)
Persistent
storage
Building management system (BMS)
Other
data
sources
K
1
K
M
...
P
1
P
L
...
Adaptation engine (AE)
R
1
R
N
...
Archiving
jobs
Evaluation
jobs
Trigg ering
jobs
8
2
1
3,5
46 7
9
10
IoT
devices
POS data
Figure 7: Components of IoT data analytics platform.
5 CONCLUSION
The empirical data analysis of relation among the
environmental conditions and customer behaviour as
well as sales performance has been conducted. It has
been shown that the results of the analysis could be
IN4PL 2020 - International Conference on Innovative Intelligent Industrial Production and Logistics
98
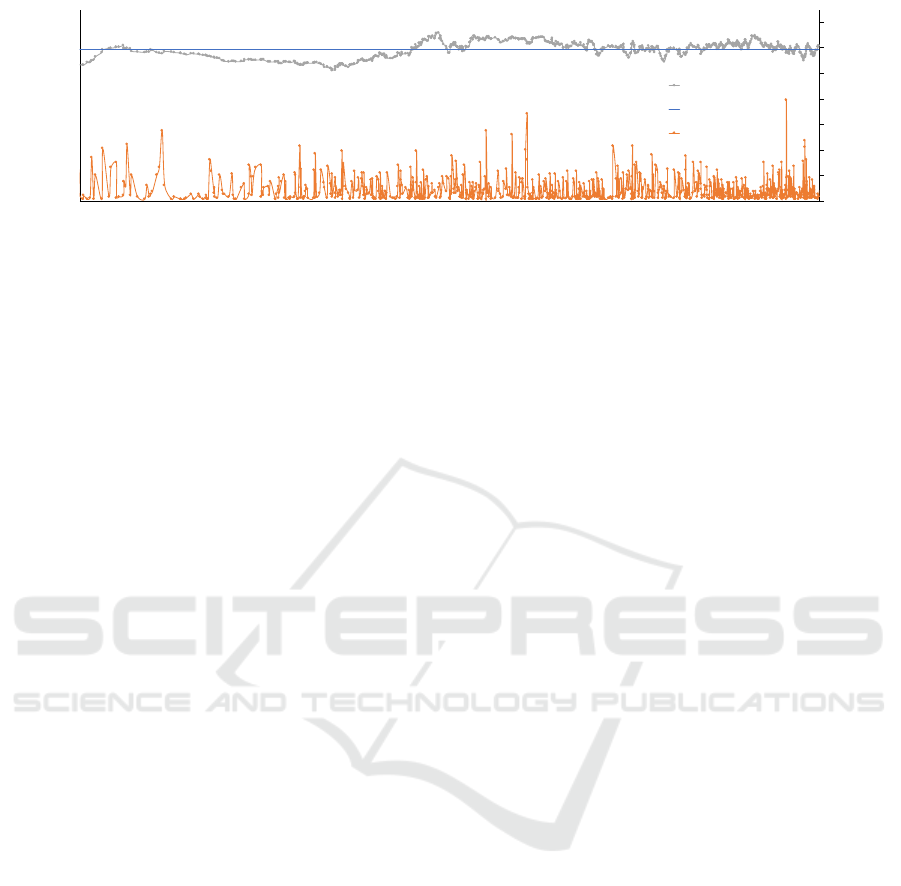
Figure 8: The air quality changes and the number of items (N) according to time.
used to configure the IoT data analysis platform for
enactment of improvements of the environmental
conditions. The statistical analysis shows that the
sales performance is significantly affected by the air
quality and humidity. The temperature appears to
have a non-linear impact on the customer behaviour.
The static analysis of historically accumulated data is
performed in the paper. Dynamic adjustment of the
data analytical models is possible as well as
integration of real-time point-of-sales data for
dynamic pricing and personalized recommendations.
The current study uses only already observed data
and does not consider what kind controls have been
applied to alter the environmental conditions and
implementation of the proposed controls is necessary
to check actual impact on customer behaviour and
sales performance.
ACKNOWLEDGMENTS
This research is funded by the Ministry of Education
and Science, Republic of Latvia, project ARTSS,
project No. VPP-COVID-2020/1-0009.
REFERENCES
Arineli, A., Quintella, H.L.M.M. 2015. CEM: Increasing
productivity through the management and monitoring
of experiences provided to customers. Cogent Business
& Management, Vol. 2 Iss. 1, pp. 1-11.
Bagdare, S. 2015. Emotional Determinants of Retail
customer experience. International Journal of
Marketing & Business Communication, Vol. 3 Iss. 2,
pp. 9-16.
Balaji, M. S., Roy, S. K. 2017. Value co-creation with
Internet of things technology in the retail industry.
Journal of Marketing Management, Vol. 33 Iss. 1/2, pp.
7-31.
Ben-Daya, M., Hassini, E. & Bahroun, Z. 2019. Internet of
things and supply chain management: a literature
review, International Journal of Production Research,
vol. 57, no. 15-16, pp. 4719-4742.
Berthiaume, D. 2019. IoT Tech to Explode: Expect
widespread disruption across store ops. Chain Store
Age, Vol. 95 Iss. 6, pp. 14-14.
EDI Consortium 2019. IoT in Retail,
https://edincubator.eu/2019/03/13/iot-in-retail/
Fernandez-Carames, T.M. & Fraga-Lamas, P. 2018a. A
Review on Human-Centered IoT-Connected Smart
Labels for the Industry 4.0, IEEE Access, vol. 6, pp.
25939-25957
Fernández-Caramés, T.M., Fraga-Lamas, P. 2018b.
Towards the internet-of-smart-clothing: A review on
IoT wearables and garments for creating intelligent
connected E-textiles, Electronics (Switzerland), vol. 7,
no. 12.
Fornerino M., Helme-Guizon A., Gotteland D. 2008.
Expériences cinématographiques en état d’immersion:
effet sur la satisfaction, Recherche et Applications en
Marketing, 23, 3, p. 1-19
Gaur, L., Singh, G., Ramakrishman, R. 2017.
Understanding consumer preferences using IoT smart-
mirrors.Pertanika Journal of Science & Technology, 25
Iss. 3, pp. 939-948.
Gentile, C., Spiller, N., Noci, G. 2007. How to Sustain the
Customer Experience:. An Overview of Experience
Components that Co-create Value with the Customer,
European Management Journal, vol. 25, no. 5, pp. 395-
410.
Handayani, R. 2019. The Effect of Store Atmosphere and
Merchandise on Customer Experiences: Survey of
Department Store Customers in Bandung City,
Indonesia, Global Business and Management Research:
An International Journal Vol. 11, No. 1, 284-294.
Irish, C. 2017. The IoT Opportunity. Checkout, Vol. 43 Iss.
12, pp. 24-25
Kampars, J., Grabis, J. 2018 Near Real-Time Big-Data
Processing for Data Driven Applications, Proceedings -
2017 International Conference on Big Data Innovations
and Applications, Innovate-Data 2017, pp. 35-42.
Kim, H., Choi, B. 2013. The Influence of Customer
Experience Quality on Customers Behavioral
Intentions. Services Marketing Quarterly,Vol. 34 Iss. 4,
pp. 322-338.
Klaus, P., Maklan, S. 2013. Towards a better measure of
customer experience. International Journal of Market
0
20
40
60
80
100
120
140
0
50
100
150
200
250
300
350
400
7500 7550 7600 7650 7700 7750
Number o
f
items
air quality
Time,minutes
air (MA)
air treshold
Items
IoT Data Analytics in Retail: Framework and Implementation
99

Research, Vol. 55 Iss. 2, pp. 227-246.
Kolassa, S. 2019. Forecasting the Future of Retail
Forecasting. Foresight: The International Journal of
Applied Forecasting, Iss. 52, pp. 11-19.
Lemke, F., Clark, M. & Wilson, H. 2011. Customer
experience quality: An exploration in business and
consumer contexts using repertory grid technique,
Journal of the Academy of Marketing Science, vol. 39,
no. 6, pp. 846-869.
Lemon, K.N..Verhoef, P.C. 2016. Understanding customer
experience Throughout the Customer Journey. Journal
of Marketing, 80, pp. 69-96.
Longo, S., Kovacs, E., Franke, J. & Martin, M. 2013.
Enriching shopping experiences with pervasive
displays and smart things, UbiComp 2013 Adjunct -
Adjunct Publication of the 2013 ACM Conference on
Ubiquitous Computing, pp. 991.
Madakam, S., Ramaswamy, R., Tripathi, S. 2015. Internet
of Things (IoT): A Literature Review. Journal of
Computer and Communications, 3, 5, pp. 164-173
Misra, P., Baranwal, S Jha, M. 2017. Brick and mortar store
vs. online shopping experience: a study. International
Journal of Information Technology and Management,
16.
Parasuraman, A., Varadarajan, P. 1988. Future strategic
emphases in service versus goods businesses, Journal of
Services Marketing, vol. 2, no. 4, pp. 57-66.
Parasuraman, A., Zeithaml, V.A., Malhotra, A. 2005. E-S-
QUAL a multiple-item scale for assessing electronic
service quality, Journal of Service Research, 7, 3, pp.
213-233.
Patil, K. 2017. Retail adoption of Internet of Things:
Applying TAM model, International Conference on
Computing, Analytics and Security Trends, CAST
2016, pp. 404.
Sathish, A. S., Venkatesakumar, R. 2011. customer
experience Management and Store Loyalty in
Corporate Retailing - With Special Reference To "Sony
World". Annamalai International Journal of Business
Studies & Research, Vol. 3 Iss. 1, pp. 67-76.
Schmitt, B. 1999. Experiential Marketing, Journal of
Marketing Management, 15, 53-67
Shanhong, L. 2018. IoT: enterprise projects breakdown
worldwide 2018, by segment Shrikanth, G. 2016. The
IoT Disruption. Dataquest. Vol. 34 Iss. 12, pp. 12-17.
Verhoef, P.C., Lemon, K.N., Parasuraman, A., Roggeveen,
A., Tsiros, M., Schelesinger, L.A., (2009). Customer
Experience Creation: Determinants, Dynamics and
Management Strategies. Journal of Retailing, Vol. 85
Iss. 1, pp. 31-41.
Weyrich, M., Ebert, C. 2016. Reference architectures for
the internet of things, IEEE Software, vol. 33, no. 1, pp.
112-116.
Wolfinbarger, M., Gilly, M.C. 2003. eTailQ:
Dimensionalizing, measuring and predicting etail
quality", Journal of Retailing, vol. 79, no. 3, pp. 183-
198.
IN4PL 2020 - International Conference on Innovative Intelligent Industrial Production and Logistics
100
