
Automated Tag Enrichment by Semantically Related Trends
Antonella Arca
2
, Salvatore Carta
1 a
, Alessandro Giuliani
1 b
, Maria Madalina Stanciu
1 c
and Diego Reforgiato Recupero
1 d
1
Department of Mathematics and Computer Science, Univeristy of Cagliari, Cagliari, Italy
2
BuzzMyVideos, London, U.K.
antonella@buzzmyvideos.com
Keywords:
Tag Annotation, Semantic Enrichment, Machine Learning, Google Trends.
Abstract:
The technological evolution of modern content sharing applications led to unbridled increase of video content
creation and with it multimedia streaming, content sharing and video advertising. Managing huge volumes of
video data becomes critical for various applications such as video browsing, retrieval, and recommendation.
In such a context, video tagging, the task of assigning meaningful human-friendly words (i.e., tags) to a video,
has become an important pillar for both academia and companies alike. Indeed, tags may be able to effectively
summarize the content of the video, and, in turn, attract users and advertisers interests. As manual tags are
usually noisy, biased and incomplete, many efforts have been recently made in devising automated video
tagging approaches. However, video search engines handle a massive amount of natural language queries
every second. Therefore, a key aspect in video tagging consists of proposing tags not only related to video
contents, but also popular amongst users searches. In this paper, we propose a novel video tagging approach, in
which the proposed tags are generated by identifying semantically related popular search queries (i.e., trends).
Experiments demonstrate the viability of our proposal.
1 INTRODUCTION
Nowadays, online media services and resources are
more accessible and available to every user, leading
to a continuous growth of data creation, sharing, and
storing. In particular, an increasing amount of users
are interested in accessing and sharing video data.
YouTube
1
, the well-known video sharing web portal,
is the second most-visited site in the world, only be-
hind Google, thus representing the epicenter of video
content creation, marketing, and video search engine
optimization. More than 500 hours of video are up-
loaded every minute, and more than 1 billion hours of
YouTube videos are watched every day
2
.
Furthermore, businesses, small or large, currently
exploit YouTube to promote their projects, expose
their brands, and naturally monetize. Undoubtedly,
a
https://orcid.org/0000-0001-9481-511X
b
https://orcid.org/0000-0001-5576-7311
c
https://orcid.org/0000-0002-6522-908X
d
https://orcid.org/0000-0001-8646-6183
1
http://www.youtube.com
2
https://www.omnicoreagency.com/youtube-statistics/
a successful marketing activity is based on increasing
social popularity of videos, meaning stronger influ-
ence, which translates into higher revenues. In turn,
improving video popularity is a key point for video
uploaders and channel creators to increase the proba-
bility that their videos would be selected by advertis-
ers.
In this scenario, video optimization on large mul-
timedia data is challenging. Given an uploaded video,
by “video optimization” we refer to all strategies
aimed at increasing the probability of a video to be
highly indexed by search engines, and consequently
the probability of being viewed by users (Carta et al.,
2020). To this end, a video hosting website typically
allows and suggests users to attach metadata (e.g., de-
scription or keywords) to the video. However, this
task may be challenging for users (Ames and Naa-
man, 2007). In particular, among all video optimiza-
tion tasks, video tagging plays an essential role. It can
be defined as the process of annotating a video with
meaningful human-friendly short textual information
(i.e., tags). Each tag should be related to the topic(s)
of the given video. In our paper, with “original tags”
we refer to manually uploaded tags, and they repre-
Arca, A., Carta, S., Giuliani, A., Stanciu, M. and Recupero, D.
Automated Tag Enrichment by Semantically Related Trends.
DOI: 10.5220/0010108701830193
In Proceedings of the 16th International Conference on Web Information Systems and Technologies (WEBIST 2020), pages 183-193
ISBN: 978-989-758-478-7
Copyright
c
2020 by SCITEPRESS – Science and Technology Publications, Lda. All rights reserved
183

sent the input of our algorithms.
Typically, original tags are often imper-
fect (Santos-Neto et al., 2014), as providing
relevant, complete, and attractive tags requires a
significant human effort, in terms of energy and time
consumption. Moreover, manual tagging is typically
not mandatory. In doing so, uploaders may not be
motivated to provide suitable tags, and tend to per-
form this task without the best effort. The resulting
tags are often noisy, irrelevant or incomplete.
Automated video tagging, aimed at reducing the
human effort, is currently widely explored by re-
searchers (Shen et al., 2016; Khan et al., 2020). Its
general goal is to improve quality of tags, which in
turn can support users in video searching and, hence,
attract more social attention to the video. In particu-
lar, given a video, an automated tag generation sys-
tem should be able to produce only tags related to
the original tags. In literature, although different ap-
proaches have been proposed, the research is still in
its extremely challenging stage. Recently, researchers
proceeded along the dimension of applying statisti-
cal models or machine learning techniques (Toderici
et al., 2010; Siersdorfer et al., 2009). The effective-
ness of these approaches is heavily dependent on their
ability to capture meaningful and relevant informa-
tion from video content and/or metadata information.
However, a video is typically associated with more
complex semantics, which makes it difficult to rep-
resent a video sequence using simple features (e.g.,
visual or aural features), especially in scaling up to
real data.
For these reasons, research on automated video
tagging is moving its focus from low-level features
to high-level semantic concepts (Udrea et al., 2006),
although it is currently a challenging problem. In-
deed, a video may be annotated with many different
semantic meanings. As an example, let us consider
a video annotated with the tags “apple”, “banana”,
“tree”. For the single tag “apple”, related concepts
may be either “orange” or “computers”. A seman-
tic analysis would infer that only “orange” should be
suggested as new tag. A common way to perform
semantic enrichment (Presutti et al., 2014) is to rely
on external resources, e.g. WordNet (Miller, 1995),
DBPedia (Lehmann et al., 2015), or ad-hoc ontolo-
gies (Consoli et al., 2017; Consoli et al., 2015), that
are aimed at inferring semantically related concepts.
A weakness of classic semantic enrichment is that
“manual” tags may not provide sufficient contextual
information to capture their semantic meanings. In
fact, let us point out that users annotate videos in
accordance either with their perception, personal ex-
pertise or social and cultural background (Ames and
Naaman, 2007). This behavior may often lead to
the so-called semantic loss phenomenon (Wu et al.,
2009), i.e., users’ tags often do not reflect all the con-
cepts that may appear in a video.
In addition to “weak” tags, “abstract” tag consti-
tute a problem as users use tags which are usually
high-level concepts rather than specific real-world ob-
ject classes (Yang and Toderici, 2011), which, in turn,
make the video less relevant to the search engines and
less accessible to a broader audience. Furthermore,
let us now analyze the scenario from another perspec-
tive. Social media context is highly “dynamic”: a user
may be interested in searching videos either related to
seasonal / hot events or concerning a specific resource
(e.g., a company, a tool, a person). In other words, a
user is often interested in current trends, rather than
a more generic topic. Even in such a context, seman-
tic enrichment often fails to obtain satisfactory perfor-
mances on real-world systems (e.g., YouTube).
To overcome the mentioned issues, the following
question should be answered: how can we generate
tags being either semantically related to the original
tags and potentially relevant for users’ searches?
To answer to this question, in this paper we pro-
pose an enhanced tagging algorithm able, on the one
hand, to discover trending search queries (trends)
which can be used as additional tags for videos. On
the other hand, our proposal is able to suggest seman-
tically related hot trends. In particular, the trends se-
lection is performed by querying Google Trends. The
novelty of the work is the suggestion of tags being (i)
semantically related to original tags and (ii) “trendy”
for user’s interest. To the best of our knowledge, no
state-of-the-art approaches are based on trends selec-
tion. Let us point out that, in this preliminary work,
we consider as input a “limited” set of original tags.
As already remarked, manual tags might be irrelevant
or noisy. To this end, as we are focused on investigat-
ing the impact of trends in tag enrichment, we deem
to perform this task in absence of noisy input, by se-
lecting the most meaningful original tags.
The remaining of this paper is organized as fol-
lows. Section 2 briefly describes relevant related work
in the literature. Section 3 introduces the method-
ology of our proposal, whereas Section 4 discusses
the experiments we have carried out, together with
the data-set that we have used to validate our ap-
proach and details of our experimental setup and de-
tailed evaluation results. Section 5 highlights our
findings during the evaluation whereas 6 ends the pa-
per with conclusions and future directions where we
are headed.
WEBIST 2020 - 16th International Conference on Web Information Systems and Technologies
184

2 RELATED WORK
With the widespread use of large video reposito-
ries (e.g., video sharing websites), a critical issue is
the overwhelming load of irrelevant information pre-
sented to users. For online video uploaders or chan-
nel creators, video optimization represents a crucial
solution in addressing the problem above and with it
the efficient usage of methods for accessing, manag-
ing, and selecting relevant data in large data repos-
itories (Cristani and Tomazzoli, 2014). One of the
most enacted strategies is through video tagging. A
typical approach is to encourage users or uploaders
to extensively annotate videos with tags, which can
be manually filtered by online video providers (Bal-
lan et al., 2015). However, the quality of tags is often
lacking, as manual textual information is usually in-
complete or inappropriate (Santos-Neto et al., 2014).
In fact, users tend to annotate videos with (i) am-
biguous and subjective tags, or (ii) popular tags that
are irrelevant for a given video (Yang and Toderici,
2011). Our proposal is mainly motivated by the major
issue of proposing an automated method for support-
ing uploaders and content creators in optimizing their
videos.
Many state-of-the-art approaches focus on the
meta data (text) provided by uploaders (Filippova and
Hall, 2011). Our proposal, on a first look, is based on
the same assumption, as we consider the original tags
as the input of our model.
Recent state-of-the-art approaches formulate the
problem of tag enrichment mainly from a machine
learning perspective, proposing to adopt supervised
learning models, e.g., nearest neighbours, which ex-
ploit tags of visual neighbours of videos (Sun et al.,
2017), latent learning (Cristani and Tomazzoli, 2016;
Zeng et al., 2018), SVMs and LogitBoost (Yang and
Toderici, 2011), and deep neural networks (Khan
et al., 2020). Furthermore, many approaches focus
on learning tags from multimodal features extracted
from user-tagged online videos, e.g., analyzing visual
or audio features (Ballan et al., 2015; Shen et al.,
2016). Typically, such machine learning models re-
quire a lot of effort in terms of computational re-
sources. Our proposed method is more flexible and
scalable, and requires less resources, from a compu-
tational perspective (see Section 3 for details).
Various proposals rely on the “propagation” of
video tags to automatically annotate untagged videos.
These methods have significant weaknesses. First,
tags can be propagated only among similar videos.
Furthermore, this may introduce a bias as the the sys-
tem relies on tag statistics from the training set or
their neighbourhoods (Zhang et al., 2012).In other
words, they are data-driven approaches, which reflect
a “static” context. As already pointed out, social me-
dia is, conversely, highly dynamic; our method falls
in this latter context, as we rely on popular trends.
Moreover, our work is compliant, from one side,
with several proposals as it is based on extracting
video context from several Web resources (e.g., (Chen
et al., 2010)). One innovation of our work resides in
employing a widely used application which can re-
turn the most popular concepts. On the other side,
as many works use semantic resources for knowl-
edge extraction and entities identifications, e.g., us-
ing WordNet and Wikipedia (Mukherjee and Bhat-
tacharyya, 2012), our model is able to identify seman-
tically related trends by adopting word embedding.
3 THE PROPOSED APPROACH
Our goal is to enrich the original user-generated tags
space by efficiently identifying a set of words from
the perspective of what a user may query in a video
search engine. In doing so, we investigated the capa-
bility of trends (i.e., the popular search queries in a
given period) of improving the popularity of a video.
We deem that our approach can fulfill the widespread
request of annotating a video with tags being highly
(i) related to the original tag set, and (ii) able to cap-
ture “ trendy” topics a user may be interested in, at
the moment of the search. We present in Algorithm 1
a schematic overview of our approach.
Given a video, the input of our algorithm is its set
of original tags, denoted as OT . Also, each video
is annotated with a category V C. K represents the
maximum number of trends expected as output in ST .
The output is represented by the set of selected trends
(ST ). In the following subsections we will give de-
tails of our algorithm.
3.1 Candidate Trends
In the context of rapid information dynamics, it can be
hard to grasp how people’s needs are evolving. Fac-
ing such a context, to identify candidate tags, Google
Trends engine represents the optimal choice. More-
over, integrating information obtained from Google
Trends has proven its applicability in various do-
mains, e.g. short term economic prediction (Choi and
Varian, 2012) or medical disease tracking (Carneiro
and Mylonakis, 2009).
Briefly, Google Trends provides several function-
alities able to return information about web searches
performed on Google platforms over time. Also,
Automated Tag Enrichment by Semantically Related Trends
185

Algorithm 1: Proposed algorithm.
Input: OT : original tags
VC: video category; K: # of output trends
Data:
G: granular tags; C: candidate trends
G
ε
: embedded granular tags
C
ε
: embedded candidate trends
Ψ
tr
: filtered trends
σ: distance score
Output: Selected trends (S
T
)
1: begin
/* Candidate trends retrieval */
2: CT ← get candidateTrends(VC)
/* Granular tags generation */
3: GT ← get granularTags(OT )
/* Word Embedding */
4: for t ∈ GT do
5: G
ε
←− G
ε
S
embedding(t)
6: for tr ∈ CT do
7: C
ε
←− C
ε
S
embedding(tr)
/* Trends filtering */
8: Ψ
tr
= {}
9: for tr
ε
∈ C
ε
do
10: for t
ε
∈ G
ε
do
11: if σ(t
ε
,tr
ε
) = 1 then
12: Ψ
tr
←− Ψ
tr
S
{tr
ε
}
/* Trends ranking */
13: ST ←− rank(Ψ
tr
)
/* Trends selection */
14: ST ←− ST .top(K)
15: return S T
Google Trends allows filtering results across tar-
geted Google platforms, e.g., Google Search, Im-
age Search, News Search, Google Shopping, and
YouTube Search. For obvious reasons, we are target-
ing only YouTube Search queries. Moreover, search
information is organized into 23 categories that can be
used to further refine the data. In this work, we focus
on four categories: Autos & Vehicles, Computers &
Electronics, Food & Drinks, Pets & Animals.
Therefore, as described in Step 2 of Algorithm 1,
given a video category we collect the set of the most
popular searches in a given period (all those returned
by Google Trends in a given period and with the video
category as input), and we consider them all as candi-
date trends (CT ).
3.2 Granular Tags Representation
In order to infer semantic information from the orig-
inal tags, it is essential to determine a meaningful
grouping strategy and, consequently, a representation
of the original tags (see Step 3 of Algorithm 1). The
motivations of this requirement relies in the need of (i)
scrutinizing whether any of the aforementioned rep-
resentations can capture the semantic context of the
original tags, and, at the same time, (ii) discarding the
less relevant concepts. To this end, we propose three
different levels of granular representation: word level
(WL), sentence level (SL), and cluster level (CL).
We denote with “granular tags” (GT ) the group-
ing of OT , as defined by the granularity level used.
Example 1.
Example 1 : Let us consider a video having
OT ={‘banana’, ‘banana bread’, ‘ba-
nana bread recipe’, ‘quick bread’,
‘breakfast’}.
Word Level (WL): We use a one − to − one map-
ping between OT and GT : each tag represents a
group.
For Example 1 we would have
GT ={‘banana’,‘banana bread’,
‘banana bread recipe’, ‘quick
bread’, ‘breakfast’}.
Sentence Level (SL): We define a “sentence”
as the concatenation of all the tags in OT .
Using a coarse–grained level may capture in
a better way the whole semantic context un-
derlying the original tags. For Example 1: the
representation corresponding to the original
tag set is GT ={‘banana banana bread
banana bread recipe quick bread
breakfast’}
Cluster Level (CL): Usually, a video may refer to
several main topics. To this end, we try to identify
clusters within the original tags, which may repre-
sent such topics. In this preliminary work, we use
one of the most known clustering algorithm, i.e.,
k-means (Kanungo et al., 2002) using the cosine
similarity as distance between the embeddings of
two tokens in OT .
For Example 1, when choosing to group the
tags in three clusters we obtain {‘breakfast
recipe bread’}, {‘banana’}, and
{‘quick’}, thus GT = {‘breakfast
recipe bread’, ‘banana’, ‘quick’}.
3.3 Word Embedding
We apply a word embedding model (Mikolov et al.,
2013) for representing, in the same semantic space,
both granular tags and candidate trends (Steps 5 and
7 of Algorithm 1). To this end, they are tokenized,
WEBIST 2020 - 16th International Conference on Web Information Systems and Technologies
186
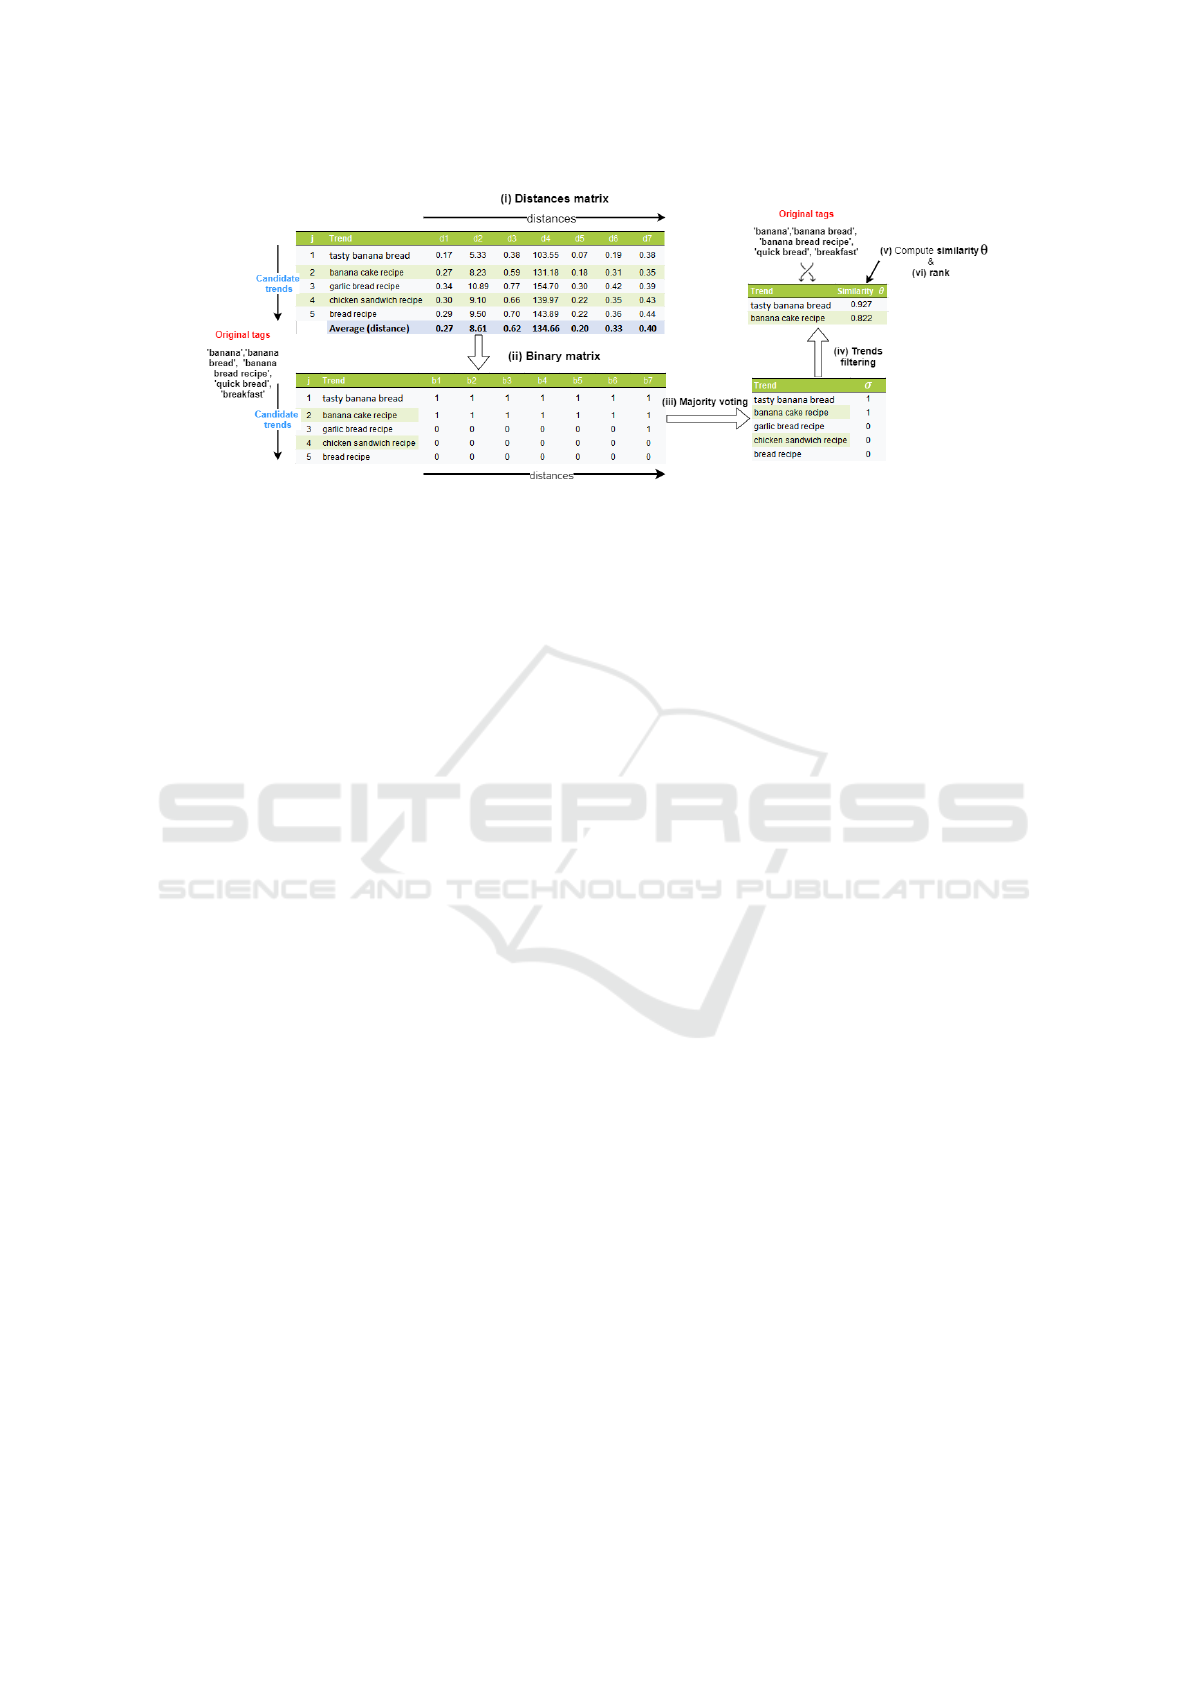
Figure 1: Walk-Through example of the algorithm for the Sentence Level representation.
and each token (unigram) is represented with an em-
bedding vector that denotes its position in the word
embedding space. To obtain the embedding for com-
pound expressions (e.g., tags and trends may be com-
posed by multiple words) we use the unweighted av-
erage of token-by-token embedding.
3.4 Trends Filtering
We aim at identifying the most relevant trends among
the set of potential candidates retrieved with Google
Trends. To this end, we need to filter the set C T , dis-
carding all irrelevant trends (called “distractors”) and
keeping only the potentially topic-related elements.
To address the problem, we adopt a majority voting
strategy to filter candidate trends, which applies vari-
ous distance metrics between tags and trends. In par-
ticular, each candidate trend tr is compared with every
granular tag t, applying the majority voting distance
strategy (described below). For each comparison we
obtained a binary score (see Step 11 of Algorithm 1):
if the score is 0, the trend is considered a distractor,
and it will be discarded from the following steps; con-
versely, a score 1 means the trend would potentially
be suggested as a new tag. The set of filtered trends
is represented as Ψ
tr
. Let us give all details on the
distanceScore function, which encompasses the fol-
lowing steps: (i) computation of distances; (ii) bina-
rization of distances; (iii) majority voting.
Distance Metrics
A distance function d(x, y) defines the distance be-
tween a granular tag x and a candidate trend y as a
non-negative real number, which measures how close
x and y are. If d = 0, both elements are equiva-
lent under a specific distance. We take into account
seven distance measures (Deza and Deza, 2014):
Minkowski, Manhattan, Euclidean, Canberra, Cosine,
Bray-Curtis and Word Mover’s distance.
Binarization
Each distance value d
i
(x, y) is then binarized as re-
ported in Equation 1, in which, given a distance met-
ric d
i
, ϑ
i
is the average value of all computations of
d
i
. We denote the resulting binary value with b
i
.
b
i
(x, y) =
1 i f d
i
(x, y) ≤ ϑ
i
0 otherwise
(1)
Let us point out that each distance metric has a
different value range and, as such, we set a different
binary threshold for each distance.
Majority Voting
A given pair (trend x, granular tag y) is
represented by a set of binarized distances
{b
1
(x, y), b
2
(x, y), ...b
N
(x, y)}, N being the num-
ber of considered metrics (7, in our case). We then
compute the distance score σ (Step 11) with the
majority voting, in particular we rely on a com-
plete agreement among the metrics, as reported in
Equation 2.
σ(x, y) =
1 i f b
i
= 1 ∀i ∈ {1, ...N}
0 otherwise
(2)
At the end of this step Ψ
tr
will contain only trends
having, for one or more comparisons with granular
tags, a distance score σ equal to 1.
Automated Tag Enrichment by Semantically Related Trends
187

3.5 Trends Ranking
After filtering, our algorithm needs to identify the
most relevant trends in Ψ
tr
. To this end, a simple
approach is to rank all filtered trends (Step 13). In
this preliminary work, we rely on computing the co-
sine similarities (θ hereinafter) between a trend and
all original tags, and sorting them in descending or-
der.
3.6 Trends Selection
Finally, the algorithm selects the top K ranked trends,
and returns them as new proposed tags. A refined ver-
sion of the algorithm would be able to return trends by
setting a threshold, rather than a number of elements.
The most suitable method for setting a threshold is
currently under investigation.
Figure 1 presents a walk-through example for the
proposed algorithm for the Sentence Level represen-
tation, highlighting its main steps. To be noted that for
illustrative purposes we considered only a very lim-
ited number of candidate trends, i.e. 5.
The basic concept used by our trend selection
model is that of “voting” or “recommendation”.
When one distance for one trend is below the aver-
age of all the others in the same column, it is basi-
cally casting a vote for that trend. If a trend (a row)
has 1 for each distance (column) then it is selected
and included in the set Ψ
tr
. Then, we sort in descend-
ing order the trends that have been selected out of this
procedure according to the cosine similarity against
the whole set of input tags and select the top K. To
note that in case of Word or Cluster level representa-
tion, we would have multiple figures like Figure 1 for
each token (Word level) or centroid (Cluster level).
4 EXPERIMENTS
4.1 Datasets
Videos - For our experiments we extracted a real-
world dataset from YouTube. In particular, we man-
ually selected videos belonging to four different cate-
gories (Autos & Vehicles, Computers & Electronics,
Food & Drinks, Pets & Animals). From each video
we downloaded its metadata from which we extracted
the set of original tags. To perform this task, we used
Python scripts that wrap YouTube API
3
.
3
https://github.com/SMAPPNYU/youtube-data-api
Table 1: Video dataset statistics.
Category Avg. #
of orig-
inal
tags
Avg.
# of
tokens
per
tags
# of
videos
Autos & Vehicles 8.21 1.59 25
Computers & Elec-
tronics
9.03 1.89 29
Food & Drinks 9.29 1.91 29
Pets & Animals 8.4 2.09 27
Overall 8.75 1.87 110
Table 2: Candidate trends dataset statistics.
Category # of trends
Autos & Vehicles 148
Computers & Electronics 153
Food & Drinks 570
Pets & Animals 306
Total 1177
As previously stated, user-provided tags are usu-
ally noisy and often irrelevant. To this end, we man-
ually discarded tags being unrelated to video con-
tents, together with tags related to channel name or
owner. We also discarded videos having too few tags
or none. Next, we processed tags by removing stop-
words, symbols, emoticons or numeric tags. The final
dataset contains 110 videos.
Trends - We used Google Trends platform to retrieve
relevant trends. The retrieval has been narrowed to
only YouTube search queries and with the input cate-
gory corresponding to the underlying video. Further-
more we have retrieved trends from the “past 30 days”
from the time of our study, as smaller periods im-
ply a smaller number of candidate trends. Similarly
to the video dataset, candidate trends have been pre-
processed, as they often contain abbreviations or too
specific concepts that are not found in our word em-
bedding vocabulary.
Tables 1 and 2 report statistics about the final
videos and trends
4
, respectively.
4.2 Experimental Settings
We set a fixed number of both original tags |OT | and
suggested trends K. We empirically set |OT | = 5.
Clusters - When evaluating the clustering level,
the number of clusters is empirically set to 3, as this
avoids losing semantic context in the original tags,
4
Trends collection has been performed only once to
keep the tests results consistent in time
WEBIST 2020 - 16th International Conference on Web Information Systems and Technologies
188

while benefiting from fine–grained comparisons of to-
kens.
Word Embedding Model - We used GoogleNews
pre-trained model as word embedding representation.
4.3 Evaluation
Relevance Scores
To determine the relevance of each suggested trend
we adopted a similar approach presented by (Kon-
jengbam et al., 2019). As such, we manually assessed
each suggested trend with a relevance score belonging
to the following five-point relevance scale:
• Non-relevant (Score 1): The trend has no associ-
ation with original tags or it is not well formed.
• Ordinary (Score 2): The trend has an ambiguous
or unfair association with the original tag set.
• Marginally Relevant (Score 3): The trend al-
though might not fit with the specific topic of the
video, may belong to a more generic or somewhat
related concept.
• Relevant (Score 4): The trend concept is fairly
related to the original tag set.
• Highly Relevant (Score 5): The trend has either
a primary or a secondary concept present in the
original tag set, and highly reflects the specific
context of original tags.
We differentiate between “correct” and “incor-
rect” trends as follows: trends assessed with rele-
vance score higher or equal to 3 are considered cor-
rect, while the rest are considered as incorrect.
Evaluation Metrics
The evaluation was carried out using: (i) precision
metrics, and (ii) ranking metrics, a common approach
in literature (Konjengbam et al., 2019; Khan et al.,
2020).
Precision at K (P@K) - corresponds to the per-
cent of correct trends among the top K suggested
trends, averaged over all the videos;
Mean Average Precision (mAP) - can be formalized
as follows:
mAP =
1
N
N
∑
j=1
(
1
R
j
K
∑
k=1
P
j
@k),
where P
j
@k represents the precision at a cutoff
value k for video j, R
j
the number of correct
trends for video j, and N the total number of
videos.
Normalized Discounted Cumulative Gain
(NDCG) - introduced by (J
¨
arvelin and
Kek
¨
al
¨
ainen, 2002), represents a popular method
for measuring the quality of ranking.
NDCG =
1
IDCG
K
∑
i=1
2
rel
i
− 1
log
2
(i + 1)
,
where IDCG =
|Rel
K
|
∑
i=1
2
rel
i
− 1
log
2
(i + 1)
given that rel
i
is the relevancy score assigned to a
trend at the ith ranking position, and Rel
K
repre-
sents the list of relevant trends (ordered by their
relevance) up to position K. We computed NDCG
for K = 10, and averaged across the set of videos.
The value range for NDCG is between 0 and 1,
the higher the better.
4.4 Baseline
For comparing our algorithm, we used a WordNet-
based baseline (Miller, 1995), which undergoes the
same steps of our algorithm: (i) computation of the
similarities between a tag t ∈ OT and a candidate
trend tr ∈ C T ; (ii) ranking tr ∈ C T according to sim-
ilarity and selection of top K trends; (iii) manual as-
sessment and evaluation as presented in previous sub-
sections. To compute similarity between tr and t we
rely on NLTK WordNet implementation and on its
shortest path distance similarity δ (Bird et al., 2009).
The similarity is computed as follows:
ˆ
δ(t,tr) =
1
N
N
∑
i=1
max
v
j
∈tr
(δ(w
i
, v
j
)) (3)
ˆ
δ(tr, t) =
1
M
M
∑
j=1
max
w
i
∈t
(δ(v
j
, w
i
)) (4)
ζ(t,tr) =
1
2
ˆ
δ(t,tr) +
ˆ
δ(tr, t)
(5)
ζ =
1
|O T |
∑
t∈OT
ζ(t,tr) (6)
First, for each word w
i
∈ t, where i ∈ [1, N] and N
is the number of words tag t consists of, we search
for the best matching word in trend tr, we record its
δ score and then average these scores (3). Then, the
same process is applied for each word v
j
of trend tr,
for j ∈ [1, M] where M is the number of words the
trend tr consists of(4). Cross-comparison is necessary
as δ is not symmetric (
ˆ
δ(x, y) 6=
ˆ
δ(y, x)). A symmetric
similarity is obtained by averaging the two similarity
scores obtained before (5). Furthermore, to obtain the
similarity of a trend tr w.r.t. the whole set of original
tags we average again the similarity scores between
Automated Tag Enrichment by Semantically Related Trends
189
Table 3: Word similarity scores.
Words in the tag Words in the trend δ
chicken onion 0.06
chicken soup 0.08
salad onion 0.06
salad soup 0.33
dinner onion 0.06
dinner soup 0.20
the trend and each tag t ∈ OT (6). This similarity
score has a value between 0 and 1, with a score of 1
indicating identical text, and a score of 0 indicating
no similarity between the two texts.
Due to space constraints we are providing a simpli-
fied example with only one original tag and one can-
didate trend both consisting of multiple words. Ex-
ample 2: Original tag - ‘chicken salad din-
ner’, and candidate trend - ‘onion soup’. Table 3
shows the similarities between all pair of words in
tag t and trends tr. Using the similarity values pro-
vided in Table 3, and starting from words in the tag we
have three matches as we take the maximum similar-
ity for each word in the tag: (“chicken”, “soup”) -
0.08, (“salad”, “soup”) - 0.33, (“dinner”, “soup”)
- 0.20. This yields
ˆ
δ(t,tr) =
1
3
(0.20 + 0.08 + 0.33) =
0.2. Similarly, starting from words in the trend we
have two matches. The maximum similarity for each
word in the trend is: (“onion”, “dinner”) - 0.06,
and (“soup”,“salad”) - 0.33 with
ˆ
δ(tr, t) =
1
2
(0.06+
0.33) = 0.19. The similarity ζ(t,tr) =
1
2
[0.20 +
0.19] = 0.2, thus ζ = 0.2.
4.5 Results
For each video we computed P@K, with K varying in
the range [1, 10]. Results in terms of P@K are shown
in Figure 2. Each plot corresponds to the mentioned
precision of the associated algorithm (i.e., baseline,
WL, SL, or CL). Furthermore we evaluate the model
by calculating also mAP and NDCG, both computed
considering K = 10. The comparison of the two met-
rics for each algorithm is reported in Table 4. We
further conduct more in depth evaluations from two
perspectives:
(i) quantitative, by displaying in Figure 3 the frac-
tion (in percentage, y-axis in the Figure) of cor-
rect trends out of the number of trends having θ
(cosine similarity, see Section 3.5) higher than a
given similarity threshold, which is varying on the
x-axis.
(ii) qualitative, by presenting in Figure 4 three charts
(sub-figures a, b and c), one for each variant of our
algorithm, being compared with the baseline. In
Table 4: Performance of WL, SL, CL algorithms against the
baseline. The metrics are reported for a cut-off value K=10.
mAP NDCG
WL 0.696 0.685
SL 0.659 0.686
CL 0.694 0.712
baseline 0.561 0.518
Figure 2: Evaluation of top K trends precision - P@K.
each chart, we depicted, for both the baseline and
our algorithm, two kinds of plots: (i) the percent
of videos (y-axis) having simultaneously at least
one suggested trend with θ > 0.6 and an assigned
relevance score higher than a variable threshold
displayed on the x-axis; (ii) the same logic, but
for θ > 0.7.
5 DISCUSSION
Results presented in Table 4 and Figure 2 clearly
highlight that our approaches outperform the base-
lines. This meets our expectations, as incorporat-
ing multiple semantic similarity measures and com-
bining them in several ways significantly increases
the likelihood of matching between two textual el-
ements. Regarding the quantitative perspective, the
best performances are achieved using WL and CL,
with a mAP of 0.696 and 0.694, representing a signif-
icant improvement with respect to the baseline (more
than 25%). This behavior is confirmed in Figure 2,
in which there is an overlapping of the plots associ-
ated to the two approaches. The lowest precision is
achieved for SL, thus indicating the fact that applying
the distance measures in a broader context decreases
their efficiency, by comparison to WL or CL. How-
ever, the SL approach still outperforms the baseline.
When comparatively assessing the algorithm ef-
fectiveness, the NDCG measure offers an interesting
insight. The CL algorithm is able to discard more
efficaciously the distractor trends, and place higher in
the ranking the most relevant trends, whereas WL and
SL obtain almost similar results.
WEBIST 2020 - 16th International Conference on Web Information Systems and Technologies
190
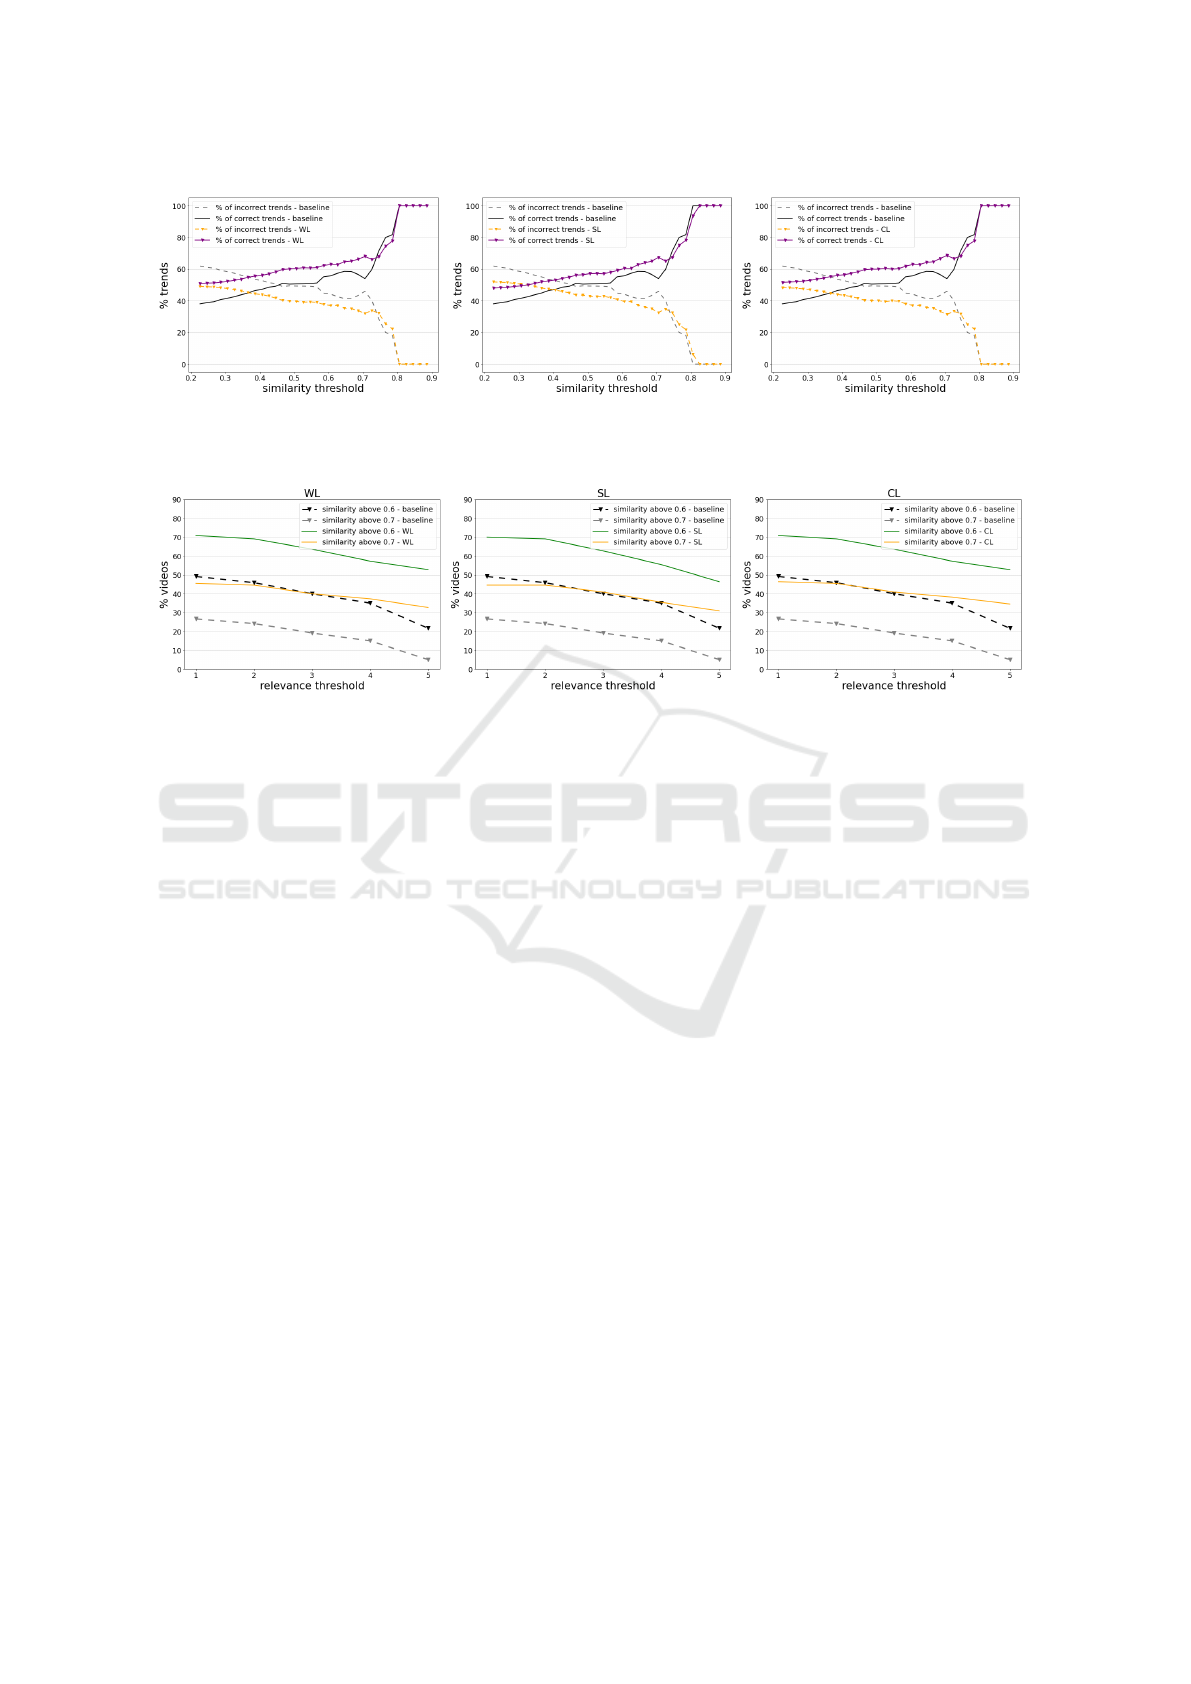
(a) Word Level (b) Sentence Level (c) Cluster Level
Figure 3: Percentage of correct and incorrect trends variation for different values of similarity threshold.
(a) Word Level (b) Sentence Level (c) Cluster Level
Figure 4: Percentage of videos having at least one suggested trend with similarity above 0.6, or with similarity above 0.7.
From Figure 3 we can conclude that there is high
similarity between the trends chosen by our algo-
rithms and input tags and that our algorithms beat the
baseline. This is more pronounced for similarity val-
ues higher than 0.6, fact that is cross-checked in the
experiment shown in Figure 4. Here, we can see that
a less restrictive criterion, i.e. a similarity threshold
of 0.6, yields encouraging results. Namely, more than
50% of the videos have been matched with relevant
trends. In turn, for a threshold of 0.7 the percentage
of videos with relevant trends is fluctuating around
40%. Nonetheless, it is worth mentioning that these
results are strongly influenced by the number of avail-
able trends.
6 CONCLUSIONS
In this paper, we have proposed an unsupervised
video tag enrichment model utilizing an initial set of
tags. We solved the problem of selecting the appro-
priate tags by using trending searches available on
the Internet and by using several levels of granular-
ity for representation: sentence level, cluster level and
word level. To test our approach, we created an anno-
tated dataset of videos. The performances of our al-
gorithms beat those of the baseline approach we have
created leveraging distances between words in Word-
Net. It turned out that finer grained methods such
as word level and especially cluster level prove to
be more effective than sentence level algorithm, yet
significantly outperforming the baseline. Finally, our
proposed approach has the main advantage of being
computationally inexpensive. As a drawback, its per-
formance is highly dependent on the quality and avail-
ability of trends.
We would like to explore several directions and
extend the performance evaluation such as (i) employ-
ing different word embeddings (or creating domain-
dependent embeddings and comparing their usage
against state-of-the-art embeddings); (ii) varying the
number of clusters in the cluster level method and
testing different clustering algorithms; (iii) extracting
and annotation a higher number of videos; (iv) using
a number of categories higher than 4; (v) not limiting
the number of input tags to be processed or at least
finding a mechanism to automatize the whole process;
(vi) creating a platform that can include our proposed
approach and can help the video content generators in
providing tags tips for their videos.
ACKNOWLEDGEMENTS
This research has been partially supported by
the ”Bando Aiuti per progetti di Ricerca e
Automated Tag Enrichment by Semantically Related Trends
191

Sviluppo”—POR FESR6832014-2020—Asse 1,
Azione 1.1.3. Project VideoBrain- Intelligent Video
Optmization.
REFERENCES
Ames, M. and Naaman, M. (2007). Why We Tag: Moti-
vations for Annotation in Mobile and Online Media.
CHI ’07. Association for Computing Machinery, New
York, NY, USA.
Ballan, L., Bertini, M., Serra, G., and Bimbo, A. D. (2015).
A data-driven approach for tag refinement and local-
ization in web videos. Comput. Vis. Image Underst.,
140(C):58–67.
Bird, S., Klein, E., and Loper, E. (2009). Natural Language
Processing with Python. O’Reilly Media, Inc., 1st edi-
tion.
Carneiro, H. A. and Mylonakis, E. (2009). Google trends:
a web-based tool for real-time surveillance of disease
outbreaks. Clinical infectious diseases, 49(10):1557–
1564.
Carta, S., Gaeta, E., Giuliani, A., Piano, L., and Recu-
pero, D. R. (2020). Efficient thumbnail identification
through object recognition. Proceedings of the WE-
BIST 2020 - 16th International Conference on Web
Information Systems and Technologies.
Chen, Z., Cao, J., Song, Y., Guo, J., Zhang, Y., and Li, J.
(2010). Context-oriented web video tag recommenda-
tion. CoRR, abs/1003.4637.
Choi, H. and Varian, H. (2012). Predicting the present with
google trends. Economic record, 88:2–9.
Consoli, S., Mongiovi, M., Nuzzolese, A., Peroni, S., Pre-
sutti, V., Recupero, D., and Spampinato, D. (2015). A
smart city data model based on semantics best practice
and principles. pages 1395–1400. cited By 18.
Consoli, S., Presutti, V., Reforgiato Recupero, D., Nuz-
zolese, A., Peroni, S., Mongiovi’, M., and Gangemi,
A. (2017). Producing linked data for smart cities: The
case of catania. Big Data Research, 7:1–15. cited By
18.
Cristani, M. and Tomazzoli, C. (2014). A multimodal ap-
proach to exploit similarity in documents. In Pro-
ceedings, Part I, of the 27th International Conference
on Modern Advances in Applied Intelligence - Volume
8481, IEA/AIE 2014, page 490–499, Berlin, Heidel-
berg. Springer-Verlag.
Cristani, M. and Tomazzoli, C. (2016). A multimodal ap-
proach to relevance and pertinence of documents. In
Fujita, H., Ali, M., Selamat, A., Sasaki, J., and Kure-
matsu, M., editors, Trends in Applied Knowledge-
Based Systems and Data Science, pages 157–168,
Cham. Springer International Publishing.
Deza, M. and Deza, E. (2014). Encyclopedia of Distances.
Springer Berlin Heidelberg.
Filippova, K. and Hall, K. B. (2011). Improved video cat-
egorization from text metadata and user comments.
In Proceedings of the 34th international ACM SIGIR
conference on Research and development in Informa-
tion - SIGIR ’11, page 835, New York, New York,
USA. ACM Press.
J
¨
arvelin, K. and Kek
¨
al
¨
ainen, J. (2002). Cumulated gain-
based evaluation of ir techniques. ACM Trans. Inf.
Syst., 20(4):422–446.
Kanungo, T., Mount, D. M., Netanyahu, N. S., Piatko,
C. D., Silverman, R., and Wu, A. Y. (2002). An ef-
ficient k-means clustering algorithm: analysis and im-
plementation. IEEE Transactions on Pattern Analysis
and Machine Intelligence, 24(7):881–892.
Khan, U. A., Mart
´
ınez-Del-Amor, M.
´
A., Altowaijri, S. M.,
Ahmed, A., Rahman, A. U., Sama, N. U., Haseeb, K.,
and Islam, N. (2020). Movie tags prediction and seg-
mentation using deep learning. IEEE Access, 8:6071–
6086.
Konjengbam, A., Kumar, N., and Singh, M. (2019). Un-
supervised tag recommendation for popular and cold
products. Journal of Intelligent Information Systems,
54:545 – 566.
Lehmann, J., Isele, R., Jakob, M., Jentzsch, A., Kon-
tokostas, D., Mendes, P. N., Hellmann, S., Morsey,
M., van Kleef, P., Auer, S., and Bizer, C. (2015).
DBpedia - a large-scale, multilingual knowledge base
extracted from wikipedia. Semantic Web Journal,
6(2):167–195.
Mikolov, T., Sutskever, I., Chen, K., Corrado, G., and Dean,
J. (2013). Distributed representations of words and
phrases and their compositionality. In Proceedings of
the 26th International Conference on Neural Informa-
tion Processing Systems - Volume 2, NIPS’13, page
3111–3119, Red Hook, NY, USA. Curran Associates
Inc.
Miller, G. A. (1995). Wordnet: A lexical database for en-
glish. Commun. ACM, 38(11):39–41.
Mukherjee, S. and Bhattacharyya, P. (2012). Youcat:
Weakly supervised youtube video categorization sys-
tem from meta data & user comments using wordnet
& wikipedia. In COLING.
Presutti, V., Consoli, S., Nuzzolese, A., Recupero, D.,
Gangemi, A., Bannour, I., and Zargayouna, H. (2014).
Uncovering the semantics of wikipedia pagelinks.
Lecture Notes in Computer Science (including sub-
series Lecture Notes in Artificial Intelligence and Lec-
ture Notes in Bioinformatics), 8876:413–428. cited
By 19.
Santos-Neto, E., Pontes, T., Almeida, J., and Ripeanu, M.
(2014). On the choice of data sources to improve con-
tent discoverability via textual feature optimization. In
Proceedings of the 25th ACM Conference on Hyper-
text and Social Media, HT ’14, page 273–278, New
York, NY, USA. Association for Computing Machin-
ery.
Shen, J., Wang, M., and Chua, T. (2016). Accurate online
video tagging via probabilistic hybrid modeling. Mul-
timedia Syst., 22(1):99–113.
Siersdorfer, S., San Pedro, J., and Sanderson, M. (2009).
Automatic video tagging using content redundancy.
In Proceedings of the 32nd international ACM SIGIR
conference on Research and development in informa-
WEBIST 2020 - 16th International Conference on Web Information Systems and Technologies
192

tion retrieval, SIGIR ’09, pages 395–402, New York,
NY, USA. ACM.
Sun, M., Zeng, K., Lin, Y., and Farhadi, A. (2017). Se-
mantic highlight retrieval and term prediction. IEEE
Transactions on Image Processing, 26(7):3303–3316.
Toderici, G., Aradhye, H., Pasc¸a, M., Sbaiz, L., and Yag-
nik, J. (2010). Finding meaning on youtube: Tag
recommendation and category discovery. In 2010
IEEE Computer Society Conference on Computer Vi-
sion and Pattern Recognition, pages 3447–3454.
Udrea, O., Recupero, D., and Subrahmanian, V. (2006).
Annotated rdf. Lecture Notes in Computer Science
(including subseries Lecture Notes in Artificial Intel-
ligence and Lecture Notes in Bioinformatics), 4011
LNCS:487–501. cited By 17.
Wu, L., Yang, L., Yu, N., and Hua, X.-S. (2009). Learn-
ing to tag. In Proceedings of the 18th International
Conference on World Wide Web, WWW ’09, page
361–370, New York, NY, USA. Association for Com-
puting Machinery.
Yang, W. and Toderici, G. (2011). Discriminative tag learn-
ing on youtube videos with latent sub-tags. In CVPR
2011, pages 3217–3224.
Zeng, Z., Xue, C., Gao, N., Wang, L., and Liu, Z. (2018).
Learning from audience intelligence: Dynamic la-
beled lda model for time-sync commented video tag-
ging. In ICONIP.
Zhang, X., Huang, Z., Shen, H. T., Yang, Y., and Li, Z.
(2012). Automatic tagging by exploring tag infor-
mation capability and correlation. World Wide Web,
15(3):233–256.
Automated Tag Enrichment by Semantically Related Trends
193
