
Using Affective Features from Media Content Metadata for Better
Movie Recommendations
John Kalung Leung
1a
, Igor Griva
2
and William G. Kennedy
3b
1
Computational and Data Sciences Department, Computational Sciences and Informatics, College of Science,
George Mason University, 4400 University Drive, Fairfax, Virginia 22030, U.S.A.
2
Department of Mathematical Sciences, MS3F2, Exploratory Hall 4114, George Mason University,
4400 University Drive, Fairfax, Virginia 22030, U.S.A.
3
Center for Social Complexity, Computational and Data Sciences Department, College of Science,
George Mason University, 4400 University Drive, Fairfax, Virginia 22030, U.S.A.
Keywords: Affective Computing, Affective Aware Top-N Recommendations, Deep Learning, Text-based Emotion
Mining.
Abstract: This paper investigates the causality in the decision making of movie recommendations through the users'
affective profiles. We advocate a method of assigning emotional tags to a movie by the auto-detection of the
affective features in the movie's overview. We apply a text-based Emotion Detection and Recognition model,
which trained by tweets short messages and transfers the learned model to detect movie overviews’ implicit
affective features. We vectorize the affective movie tags to represent the mood embeddings of the movie. We
obtain the user's emotional features by taking the average of all the movies' affective vectors the user has
watched. We apply five-distance metrics to rank the Top-N movie recommendations against the user's
emotion profile. We found Cosine Similarity distance metrics performed better than other distance metrics
measures. We conclude that by replacing the top-N recommendations generated by the Recommender with
the reranked recommendations list made by the Cosine Similarity distance metrics, the user will effectively
get affective aware top-N recommendations while making the Recommender feels like an Emotion Aware
Recommender.
1 INTRODUCTION
Emotion affects human experience and influences our
daily activities on all levels of the decision-making
process. When a user ponders over a list of
recommended items such as songs, books, movies,
products, or services, his affective state of preferences
influences his decision making on which
recommended item he chooses to consume. Emotion
plays a role in our decision-making process in
preference selection (Naqvi et al., 2006). However,
the information retrieval (IF) and Recommender
Systems (RS) field give little attention to include
human emotion as a source of user context (Ho and
Tagmouti, 2006). Our goal in this paper is to make
affective awareness a component in making movie
recommendations for users. The challenge is that no
a
https://orcid.org/0000-0003-0216-1134
b
https://orcid.org/0000-0001-9238-1215
film database or movie dataset in the public domain
contains any explicit textual oriented human
emotional tag in the metadata. However, the film
metadata fields such as plot, overview, storyline,
script, watcher reviews, and critics reviews contain
excellent subjective data that describes the general
mood of a movie. We can apply Machine Learning
(ML) techniques to identify and extract affective
features implicitly from the film metadata and
leverage the film's emotional characteristics when
making movie recommendations to users.
No two films are created the same. The moods of
a movie act like an affective fingerprint of the film.
We envision an affective movie feature represents by
a low dimension continuous emotional vector
embedding denotes as the movie's emotional vector
(mvec). Some film databases, such as the MovieLens,
Leung, J., Griva, I. and Kennedy, W.
Using Affective Features from Media Content Metadata for Better Movie Recommendations.
DOI: 10.5220/0010056201610168
In Proceedings of the 12th International Joint Conference on Knowledge Discovery, Knowledge Engineering and Knowledge Management (IC3K 2020) - Volume 1: KDIR, pages 161-168
ISBN: 978-989-758-474-9
Copyright
c
2020 by SCITEPRESS – Science and Technology Publications, Lda. All rights reserved
161

track users' movie-watching history and feedback
(Harper and Konstan, 2016). Using the user's movie-
watching history, we formulate a low dimension
continuous emotion vector embedding denotes as the
user emotional vector (uvec). We obtain a user's uvec
embedding value by taking the average of all the
movies' mvecs the user has watched. Note that uvec
may not be unique if two users watched the same set
of movies. The difference between mvec and uvec is
that mvec of a movie is static, with value unchanged
throughout its lifetime.
In contrast, uvec is dynamic, with its value
changes as the user watched and rated a movie. The
advantage of using the dynamic nature of uvec in the
movie recommendation-making process is that we are
taking the most updated user's affective preference
into consideration of the user's decision-making
process. As the user emotional preference change, the
movie recommender will adjust the recommendation-
making process accordingly. We may be the first
party making use of the novelty in leveraging the
dynamic nature of uvec over mvec to enhance the
movie Recommender recommendation-making
process.
Table 1: Affect values, mvec, of movies "The Godfather
(1972)" derived from balanced and unbalanced moods.
Moods
Balanced
Moods
Dataset
Rank
Unbalanced
Moods
Dataset
Rank
Neutral 0.0840931 6 0.04276474 6
Joy 0.059261046 7 0.16501102 3
Sadness 0.08991193 5 0.076094896 4
Hate 0.23262443 1 0.4305178 1
Anger 0.20177138 2 0.1993026 2
Disgust 0.19720455 3 0.053966276 5
Surprise 0.13513364 4 0.03234269 7
Moreover, we can leverage the range and strength
of a film's moods, i.e., mvec, to analyse a film’s
emotional features. In this study, we track six primary
human affective features in emotion: “joy”,
“sadness”, “hate”, “anger”, “disgust”, and “surprise”.
We added "neutral" as the seventh affective feature
for convenience in affective computation. We
normalized the affective features when we compute
mvec for a film. Thus, all affective features in mvec
will add up to one (1). For example, Internet Movie
Database (IMDb) is a popular online movie
information database that has rated “The Godfather
(1972)” as the top movie of all time (IMDb, 2020).
Our emotion detector classified the movie's dominant
affective class as “hate” and depicted the movie's
mvec in Table 1.
2 RELATED WORK
Detecting primary human emotion expression in text
is a relatively new research area in Natural Language
Processing (NLP). A common approach in
identifying the general thought, feeling, or sense in
writing is to classify the contextual polarity
orientation (positive, neutral, and negative) of
opinionated text through the polarity Sentimental
Analysis (SA) (Wilson et al., 2005), and (Maas et al.,
2011). When applying fine-grained Sentiment
Analysis (Fink et al., 2011), researchers can identify
the intensity level of the polarity as a multi-class
single-label classification problem (e.g., very
positive, optimistic, neutral, negative, and very
negative) (Bhowmick et al., 2009). However, to
determine the mental, emotional state or composure
(i.e., mood) in subjective text, Emotional Analysis
(EA) can better suit to handle the task (Tripathi et al.,
2016). The researcher wants to know the writing
feeling under examination is one of the following
primary human emotions or moods.
The study of basic human emotional expressions
started in the era of Aristotle in around 4th century
BC (Konstan and Konstan, 2006). However, not until
Charles Darwin (1872 – 1998) revisited the
investigation of human emotional expression in the
19th century, which propelled the field to its present
stage of modern psychology research (Ekman, 2006).
Paul Ekman et alia in the 1970s developed a Facial
Action Coding System (FACS) to carry out a series
of research on facial expressions that have identified
the following six primary universal human emotions:
happiness, sadness, disgust, fear, surprise, and anger
(Ekman, 1999). Ekman later added contempt as the
seventh primary human emotion to his list (Ekman et
al., 2013). Robert Plutchik invented the Wheel of
Emotions, advocated eight primary emotions: anger,
anticipation, joy, trust, fear, surprise, sadness, and
disgust. Adding to the primary eight emotions are
secondary and complementary emotions for 32
emotions depicted on the initial Wheel of Emotions
(Plutchik, 2001). More recent research by Glasgow
University in 2014 amended that couple pairs of
emotions such as fear and surprise elicited similar
facial muscles response, so are disgust and anger. The
study broke the raw human emotions down to four
fundamental emotions: happiness, sadness,
fear/surprise, and disgust/anger (Tayib and
Jamaludin, 2016).
Like many researchers have based their work on
Ekman’s six primary human emotions (Canales and
Martínez-Barco, 2014), we also focus our emotion
detection and recognition (EDR) on Ekman’s six
KDIR 2020 - 12th International Conference on Knowledge Discovery and Information Retrieval
162

primary human emotions. We make use of the
WordNet-Affect, a linguistic resource for a lexical
representation of affective knowledge in affective
computing on human interaction such as attention,
emotions, motivation, pleasure, and entertainment
(Valitutti et al., 2004). Emotional expression research
usually aims to detect and recognize emotion types
from human facial expression and vocal intonation
(De Silva et al., 1997). However, our EDR study
focuses on the mood of text expression instead.
Nevertheless, the question remains how much of an
emotion we can convey through writing.
3 METHODOLOGY
In the absence of any publicly available explicit
emotion labeled movie metadata dataset, we build an
affective text aware model in two steps. First, through
readily available tweets data from the Twitter
database, we developed a Tweet Affective Classifier
(TAC). TAC can classify any tweet text into an
affective vector embedding containing seven basic
human emotions in probabilistic values. Next, we
feed the movie text metadata, such as overviews, to
TAC to classify the movie's mvec affective values.
3.1 Data Preparation
One of the challenges in this study is to obtain a large
enough movie metadata set with mood labels. No
such dataset is readily available. We need to build the
required dataset by deriving it from four different
sources:
1. For the movie rating datasets, we obtained the
datasets from the MovieLens datasets stored in
the GroupLens repository (Harper and
Konstan, 2016).
2. We scraped The Movie Database (TMDb)
(TMDb, 2018) for movie overviews and other
metadata.
3. We derived our emotional word sense set as
contextual emotional words synonymous with
WordNet (Miller, 1995).
4. Finally, we scraped the Twitter database for
tweets with keyword tags that matched our
contextual emotion word synonymous (Marres
and Weltevrede, 2013).
MovieLens contains a “links” file containing
cross-reference links between MovieLens’ movie id
and TMDb’s tmdb id. We connect MovieLens and
TMDb datasets through the “links” file.
We build a seven text-based emotion predictor for
movie overviews from the seven-emotion tweet
classifier model. We run the predictor through all the
452,102 overviews scraped from the TMDb database.
We joined the affective aware movie overviews with
four Movielens datasets: ml-latest-small (a.k.a. ml-
latest-small hereafter), ml20m, ml25m and ml-latest
(a.k.a. ml27m hereafter), as depicted in the following
Table 2. Not all movies listed in the MovieLens
datasets has a corresponding movie extracted from
TMDb.
Table 2: MovieLens dataset statistics merged with number
of overviews from TMDb.
Dataset users ratings movies overviews
mlsm 610 100836 9742 9625
ml20m 138493 20000263 27278 26603
ml25m 162641 25000095 62423 60494
ml27m 283228 27753444 58098 56314
3.1.1 Extract Emotion Synonymous from
WordNetAffecteMotionLists
WordNet developed an affective knowledge
linguistic resource known as WordNet-Affect for
lexical representation (Strapparava et al., 2004). The
selection and tagging of a subset of synsets convey
the emotional meaning of a word in WordNet-Affect.
WordNet-Affect emotion lists contain lists of
concepts extracted from WordNet-Affect, synsets
with six emotions of interest: anger, disgust, hate, joy,
sadness, and surprise stored in a compressed file:
“WordNetAffectEmotionLists.tar.gz” (Poria et
al., 2012).
We downloaded the “.gz” file and uncompressed
it into six emotion text files. Each emotion file
contains two columns of information: synsets and the
synonymous. Here, the synonymous set of the synset
corresponds to an emotion class and store in the
corresponding emotion text file. We extract the
synonymous column from each emotion text file. We
removed duplicate synonymous, sorted the cleansed
synonymous, and stored the result in comma-
separated values (CSV) format in the corresponding
emotion synonymous file. Table 3 contains the
statistic of the six emotion synonymous files after
performed the data cleansing task.
Table 3: Synonymous statistics of six emotions.
Mood Count Synonymous List
Joy 400 “admirable”,...,“zestfulness”
Sadness 202 “aggrieve”,...,“wretched”
Hate 147 “affright”,...,“unsure”
Anger 255 “abhor”,...,“wrothful”
Disgust 53 “abhorrent”,...,“yucky”
Surprise 71 “admiration”,...,“wondrously”
Using Affective Features from Media Content Metadata for Better Movie Recommendations
163

3.1.2 Extract Tweets from Twitter Database
There are many types of tweets on Twitter, a popular
social network, and the microblogging platform. This
study only works with the regular tweet, 140
characters, or less short message, which posts on
Twitter. Almost every user’s tweets are extractable
and available to the public. Each tweet is searchable
by keyword. We wrote a simple Python script to
extract tweets through Twitter’s API (Makice, 2009).
We treat each synonymous in an emotion
corresponding file as a keyword of a tweet. By
looping through all the synonymous in Twitter’s
search-by-keyword API, we extract all the tweets
with such keyword and store them in a CSV file. The
alternative is to extract tweets and store them in a
JSON file, as illustrated in (Makice, 2009). For
example, if the emotion synonymous belongs to the
anger concept, we will store the retrieved tweet
in anger raw.csv file. As depicted in Table 3, the
anger emotion corresponding file, the anger syn.txt,
has 255 synonymous. We will store all tweets
retrieved from the corresponding keywords in anger
raw.csv.
After performing text cleansing steps, it yields the
following affective feature records depicted in Table
4. Our affective dataset extracted from Twitter shows
an unbalanced dataset. We decide to balance the
affective dataset by subsampling each affective
attribute dataset size to 15,000. We further split each
affective dataset into a training dataset with 80% of
the samples (12,000) and 20% of the test dataset
(3,000).
Using a brute force method, we scrape the TMDb
database for movie metadata and movie, which
contains the subjective writing movie description to
classify the text’s mood. Our effort yields 452,102
records after cleansing the raw data we scraped from
TMDb.
Table 4: Moods records gathered from Twitter.
Mood Class Size
Neutral 19180
Joy 138019
Sadness 60381
Hate 38651
Anger 17830
Disgust 19887
Surprise 15002
No. of unbalance 7 mood classes 308878
No. of each balanced mood 15000
No. of each balanced mood train 12000
No. of each balanced mood test 3000
3.2 Emotion Modeling
Intrigue by the recent publication in Natural
Language Processing (NLP) for text classification
described by (Sosa, 2017), we develop a text-based
EDR model by concatenating Long Short-Term
Memory (LSTM) architecture and Conv-1D of
Convolutional Neural Network (CNN) architecture.
We follow a similar method used in (Liu, 2020) to
build our EDR model. We define our model
architecture consists of two halves. The first half is
RNN LSTM-CNN Conv-1D architecture, as
described in (Sosa, 2017) that text input process by an
LSTM architecture before following up data
processing by a CNN Conv-1D architecture. In
contrast, the second half of the model is to reverse the
processing order of architecture, CNN Conv-1D-
RNN LSTM. Input first process by a CNN Conv-1D
architecture before feeding it to an RNN LSTM
architecture. The two halves of the architecture then
combine to feed data into a max-pooling layer of a
CNN for a pooling operation to select the dominant
feature in the filter’s regional feature map. Next, data
passes into a CNN flattening layer to convert data into
a one-dimensional array before feed data to a fully
connected CNN layer. The dense layer’s output will
feed to a set of nodes equal to the number of classes
the architecture aims to classify. Each of the output
nodes holds the output distribution value of its class.
In the final act, a softmax activation function examine
and activate the appropriate class node accordingly.
We use bi-directional RNN LSTM and CNN
Conv1D architectures to build our model. In the first
half of the model, the RNN LSTM-CNN Conv-1D
phase, we use two bi-directional LSTM for the RNN
LSTM architecture and seven Conv1D CNN
architecture. In the second half of the model, the
CNN-LSTM phase, we apply seven pairs of Conv1D
of the CNN architecture and two bi-directional LSTM
for the LSTM architecture. Follow the idea illustrated
in (Kim, 2014); we prepared two identical input
layers of embedding matrix constructed from a pre-
trained GloVe embedding matric similar to
(Pennington et al., 2014). We build the two input
layers of the embedding matrix with one of the input
embedding layers set to “trainable,” while the other is
not, i.e., “frozen.” During the processing of the first
half of the model, the RNN LSTM-CNN Conv-1D
phase, the “trainable” input layer occupies one of the
bi-directional LSTM architectures. In contrast, the
“frozen” input layer fills the other.
Similarly, when processing the second half of the
model, the CNN Conv-1D – RNN LSTM phase, a
“trainable” input layer, and a “frozen” input layer will
KDIR 2020 - 12th International Conference on Knowledge Discovery and Information Retrieval
164
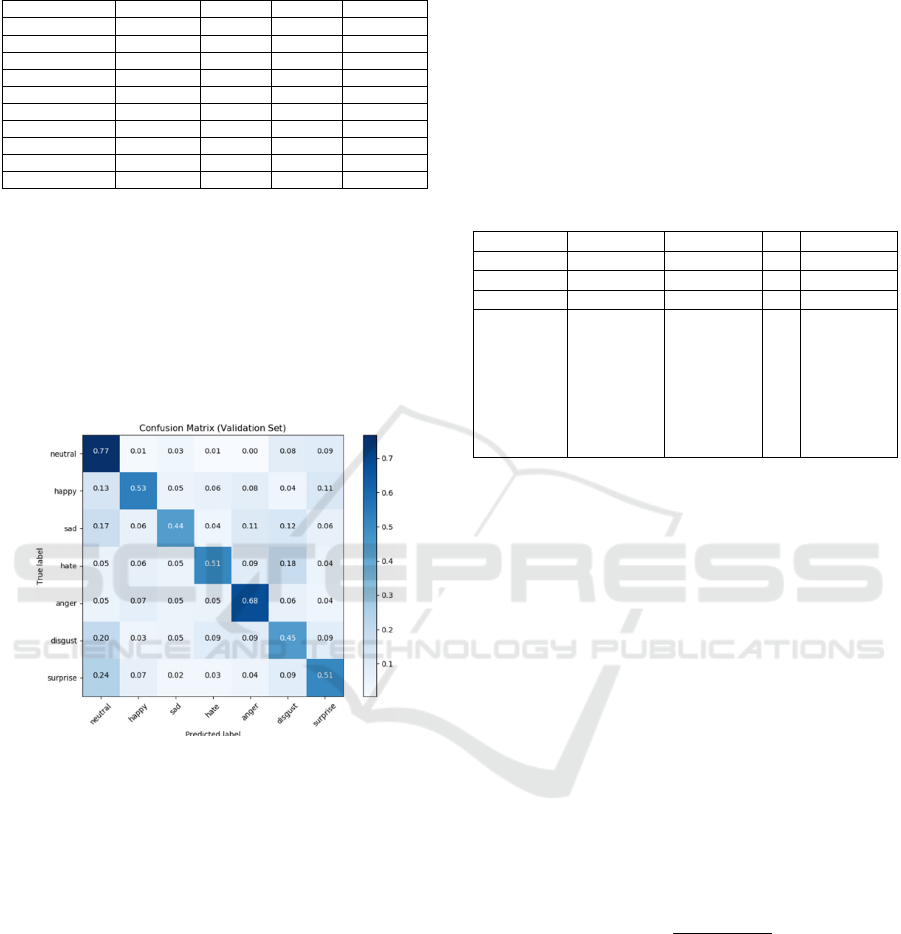
Table 5: Emotion Detection Recognition on balanced
moods tweets.
Precision Recall F1-score Support
Neutral 0.47 0.77 0.59 2992
Joy 0.63 0.53 0.58 3030
Sadness 0.64 0.44 0.52 3034
Hate 0.64 0.51 0.57 2933
Anger 0.62 0.68 0.65 2984
Disgust 0.44 0.45 0.44 2987
Surprise 0.55 0.51 0.53 3040
Accuracy 0.56 21000
Macro avg 0.57 0.56 0.55 21000
Weighted avg 0.57 0.56 0.55 21000
occupy each pair of the Conv1D units. We obtain
55.6% accuracy in classifying the emotion class of the
tweets’ balanced dataset, as depicted in Table 5, and
the confusion matrix in figure 1 depicts the
performance of the seven-emotion classifier. The
classification result is acceptable to serve our purpose
since our goal is not to build the best emotion text
classifier, but a usable one to classify the emotion
class of movie overviews.
Figure 1: Confusion matrix of 7 balanced emotions dataset.
4 IMPLEMENTATIONS
4.1 UVEC and MVEC
We selected all users in the MovieLens ml-latest-
small dataset as test users. We split the number of
movies watched by each user into the user training set
and validation set. Table 6 illustrates of the
computation results of uvecs from a 20-80% split of
train and validation sets. Table 8 depicts an example
of user id 400 uvec statistics. We sorted user id 400
by the timestamp attribute in the ml-latest-small
ratings data file to simulate the movie watching order.
We take the 20% split train set to compute the uvec
for the test user. We used the test user’s last watched
movie, “Lucky Number Slevin (2006),” as input to
the SVD-CFRS Recommender to generate a top-20
recommendations list. We applied the five-distance
metrics against the top-20 recommendation list to
obtain five corresponding re-ranked top-20
recommendation lists, as depicted in Table 8. We then
compared the number of movies matched in each
recommendation list against the movies in the
validation set of the to-be-watched list to report as the
hit percentage.
Table 6: MLSM dataset test user uvec, movie watched
count, 20% train and 80% validate.
User ID 1 2 … 610
Wcount 2698 1864 … 2108
x%train …
y%validate …
UVEC
Neutral
Joy
Sadness
Hate
Anger
Disgust
Surprise
0.16635188
0.09730581
0.1180924
0.1641951
0.11517799
0.17250315
0.16637367
0.17283309
0.09685813
0.11604573
0.16120733
0.11227607
0.17098578
0.16979389
…
0.16885831
0.09974659
0.1187206
0.16087716
0.11261272
0.17191968
0.16726495
4.2 Comparative Platform
We developed a movie Recommender System to
evaluate the performance of user emotion profile,
uvec, and movie emotion profile, mvec. We envision
uvec and mvec play a role in the tail end process of
making movie top-N Recommendations. Any movie
Recommenders can refit to support uvec and mvec
processes. We developed an SVD based
Collaborative Filtering movie Recommender System
(SVD-CFRS). We added functions to support uvec
and mvec operations as enhancement of making
movie recommendations.
The five-distance metrics we employed in the
comparative platform were Euclidean distance,
Manhattan distance, Minkowski distance, Cosine
similarity, and Pearson correlation with their formula
illustrated in equation 1 through 6.
x,y
2
1
(1)
x,y
1
(2)
Using Affective Features from Media Content Metadata for Better Movie Recommendations
165

x,y
1
1
(3)
x,y
〈
,
〉
(4)
CosSim
x,
y
∑
x
i
y
i
i
∑
x
i
2
i
∑
y
i
2
i
x,
y
|
x
|
|
y
|
(5)
x,
y
,
(6)
Where (x, y) are vectors x = (x
1
, … , x
n
) and y =
(y
1
, …, y
n
).
5 EVALUATION
5.1 Findings
We derived the following methods to evaluate the
performance of the recommendations list generated
by the SVD-CF Recommender and the reranking of
the recommendations list by the five-distance metrics
algorithms. We join the ml-latest-small dataset's
ratings and movie data files with the emotion TMDb
dataset to obtain the movie dataset with emotion
labels. Table 7 illustrates the pseudo-code of
grouping users and sorted their activity by timestamp
to simulate their movie watching order. The pseudo-
code also shows splitting each user's activity into a
test and validation set and compute uvec. It also
shows in the pseudo-code the top-20, top-10, and top-
5 of recommendations lists and the reranking of the
recommendations list by the five-distance metrics.
Lastly, the pseudo-code computes the hit rate in
percent for top-20, top-10, and top-5
recommendations.
Table 7: Pseudocode of getting users uvecs, topN, and hit
rates.
1 Group user by userId
2 For each user do
3 Sort user row by timestamp
4 Split user into test and validation set: 20/80
5 Get uvec for test user
6 Get top20/10/5 by test user’s last watched film
7 Rerank top20 by 5 distance metrics, get top10/5
8 Get hit% by validation set for top20/10/5
9 Get hit% by validation set for 5-dist top20/10/5
Table 8 shows an example of test user id 400 of last
watched movie statistics and the movie's mvec.
Table 8: Test user id 400 last watched movie and mvec.
uwerId 400 tmdbId 186
movieId 44665 rating 4.0
title Lucky
Number
Slevin
(2006)
genres Crime,
Drama,
Mystery
timestamp 1498870148 m_neutral 0.204775
m_happy 0.075458 m_sad 0.127180
m_hate 0.171851 m_anger 0.112534
m_disgust 0.166984 m_surprise 0.141217
Table 9 depicts a 20-80 split sampling result of the
test user id 400. The column "Mid" shows the movie
ids of top-20, top-10, and top-5 recommendations list
generated by the SVD-CF Recommender and the
recommendations lists' reranking by the five-distance
metrics. Also, the table shows the hit rates of top-20,
top-10, and top-5 for each category.
Table 9: Sampling on 20-80 split of 43 watched movies of
ml-latest-small user id 400 into 8 watched movies for uvec
computation and 35 to-be-watched movies for validation on
the top20 and top5 recommendations list generated by
SVD-CFRS and five distance.
400 Mid Euc Mht Mki Cos Pear
1 296 58559 58559 58559 2959 2959
2 50 7153 7153 7153 2329 58559
3 858 356 5952 356 527 2028
4 2959 5952 356 5952 2858 2329
5 593 593 1089 593 1213 527
6 4993 1089 593 1089 858 858
7 58559 1221 1221 608 79132 1089
8 7153 608 50 1221 2028 2858
9 608 4993 4993 4993 47 1213
10 1221 2028 2028 2028 50 47
11 527 296 608 296 296 79132
12 79132 50 296 47 4993 4993
13 1213 47 47 79132 608 1221
14 5952 858 858 50 1089 7153
15 2858 79132 79132 858 1221 296
16 356 1213 2858 1213 593 608
17 47 2858 527 2858 5952 593
18 2329 527 2329 527 356 5952
19 1089 2329 1213 2329 58559 50
20 2028 2959 2959 2959 7153 356
T20% 70 70 70 70 70 70
T5% 100 80 60 80 40 40
T10% 100 70 70 70 60 50
5.2 Find the Winner of TopN Ranked
by Distance Metrics
Table 10 shows the average categorical hit rate of all
test users. The first column, “Mid” shows the average
hit rate obtained through various split sizes of top-20,
top-10, and top-5 for the non-affective aware
KDIR 2020 - 12th International Conference on Knowledge Discovery and Information Retrieval
166

recommendations lists. The other five columns show
the affective aware hit rate results. To make the
regular non-affective aware recommender become an
effective aware Recommender, choose the winner
from the five-distance metric. In our case, the Cosine
Similarity hit rate as shown in the “Cos” column
yields the best result across the top-20, top-10, and
top-5 when comparing among the others.
Table 10: Sampling on various split sizes for each test user
to obtain the respective recommendations list and the
reranking recommendations lists by five-distance metrics
and hit rates on each user’s category for reporting the
average results.
Top20
Split
Mid
Hit%
Euc
Hit%
Mht
Hit%
Mki
Hit%
Cos
Hit%
Pear
Hit%
10-90 69.34 69.34 69.34 69.34 69.34 69.34
20-80 64.98 64.98 64.98 64.98 64.98 64.98
30-70 59.86 59.86 59.86 59.86 59.86 59.86
40-60 54.24 54.24 54.24 54.24 54.24 54.24
50-50 48.42 48.42 48.42 48.42 48.42 48.42
60-40 41.53 41.53 41.53 41.53 41.53 41.53
70-30 34.37 34.37 34.37 34.37 34.37 34.37
80-20 25.75 25.75 25.75 25.75 25.75 25.75
90-10 16.42 16.42 16.42 16.42 16.42 16.42
Top5
Split
Mid
Hit%
Euc
Hit%
Mht
Hit%
Mki
Hit%
Cos
Hit%
Pear
Hit%
10-90 82.26 69.41 69.41 69.67 69.80 69.80
20-80 78.20 64.30 64.13 64.00 65.87 65.57
30-70 72.46 59.57 59.67 59.51 60.23 60.23
40-60 67.11 54.10 55.02 54.33 54.33 54.03
50-50 60.98 49.84 49.51 49.38 48.10 47.87
60-40 53.34 42.13 42.03 41.87 40.82 40.79
70-30 44.03 34.46 34.69 34.59 34.69 34.13
80-20 34.56 25.48 25.54 25.28 25.41 26.07
90-10 21.80 17.11 16.67 17.18 15.41 16.00
Top10
Split
Mid
Hit%
Euc
Hit%
Mht
Hit%
Mki
Hit%
Cos
Hit%
Pear
Hit%
10-90 76.89 68.82 68.97 68.93 69.89 69.54
20-80 72.49 64.26 64.23 64.05 65.66 65.08
30-70 67.31 59.33 59.41 59.44 60.41 60.00
40-60 61.59 53.90 54.08 54.03 54.54 54.43
50-50 55.13 48.57 48.74 48.59 48.18 48.30
60-40 47.77 41.92 42.02 41.93 41.13 41.39
70-30 39.66 34.64 34.66 34.52 34.13 34.00
80-20 29.93 25.54 25.85 25.60 25.90 25.75
90-10 19.28 16.54 16.66 16.54 16.25 16.08
6 FUTURE WORK
We plan to elaborate our work in mvec and uvec from
making the Recommender become emotion aware of
the recommendations making process, a bottom-up
approach, to build an Emotion Aware Recommender
from the top down. We also plan to use affective
features in users’ emotion profiles to enhance Group
Recommender in group formation, group dynamics,
and group decision-making.
7 CONCLUSIONS
We illustrate a strategy to transform a non-affective
aware Recommender to become affective aware. We
started by developing an Emotion Detection and
Recognition (EDR) model to classify seven
emotional features in tweets through emotion tags
stored in the Twitter database. We then transferred the
EDR model's learning from classifying the affective
features of tweets to classify a movie's emotion
through the movie overview. We generated emotional
features, mvec, for each collected movie from TMDb
and joined it with the ratings dataset found in the
MovieLens repository. We use the emotion labeled
ratings dataset to make the top-N recommendations
list through an SVD-CF Recommender while adding
functions to support uvec and mvec for affective
computing and analysis. We reranked all test
users'users' top-N recommendations lists through
five-distance metrics. We systematically evaluated
the recommendations lists' performance and the
reranked recommendation lists and found Cosine
Similarity distance metrics performed the best. We
conclude that the Cosine Similarity algorithm is the
most suitable distance metrics to use in making a non-
affective aware SVD-CF Recommender affective
aware.
REFERENCES
Bhowmick, P.K., Basu, A., Mitra, P., Prasad, A., 2009.
Multi-label text classification approach for sentence
level news emotion analysis, in: International
Conference on Pattern Recognition and Machine
Intelligence. Springer, pp. 261–266.
Canales, L., Martínez-Barco, P., 2014. Emotion detection
from text: A survey, in: Proceedings of the Workshop
on Natural Language Processing in the 5th Information
Systems Research Working Days (JISIC). pp. 37–43.
De Silva, L.C., Miyasato, T., Nakatsu, R., 1997. Facial
emotion recognition using multi-modal information, in:
Proceedings of ICICS, 1997 International Conference
on Information, Communications and Signal
Processing. Theme: Trends in Information Systems
Engineering and Wireless Multimedia
Communications (Cat. IEEE, pp. 397–401.
Ekman, P., 2006. Darwin and facial expression: A century
of research in review. Ishk.
Ekman, P., 1999. Basic emotions. Handbook of cognition
and emotion 98, 16.
Ekman, P., Friesen, W.V., Ellsworth, P., 2013. Emotion in
the human face: Guidelines for research and an
integration of findings. Elsevier.
Fink, C.R., Chou, D.S., Kopecky, J.J., Llorens, A.J., 2011.
Coarse- and Fine-Grained Sentiment Analysis of Social
Using Affective Features from Media Content Metadata for Better Movie Recommendations
167

Media Text. Johns hopkins apl technical digest 30, 22–
30.
Harper, F.M., Konstan, J.A., 2016. The movielens datasets:
History and context. ACM Transactions on Interactive
Intelligent Systems (TiiS) 5, 19.
http://dx.doi.org/10.1145/2827872
Ho, I.L., Ai Thanh, Menezes, Tagmouti, Y., 2006. E-mrs:
Emotion-based movie recommender system, in:
Proceedings of IADIS E-Commerce Conference. USA:
University of Washington Both-Ell. pp. 1–8.
IMDb, 2020. Top 100 Greatest Movies of All Time (The
Ultimate List) [WWW Document]. URL
http://www.imdb.com/list/ls055592025/ (accessed
5.17.20).
Kim, Y., 2014. Convolutional neural networks for sentence
classification. arXiv preprint arXiv:1408.5882.
Konstan, D., Konstan, D., 2006. The emotions of the
ancient Greeks: Studies in Aristotle and classical
literature. University of Toronto Press.
Liu, T., 2020. Multi-class Emotion Classification for Short
Texts [WWW Document]. URL
https://tlkh.github.io/text-emotion-classification/
(accessed 5.18.20).
Maas, A.L., Daly, R.E., Pham, P.T., Huang, D., Ng, A.Y.,
Potts, C., 2011. Learning Word Vectors for Sentiment
Analysis, in: Proceedings of the 49th Annual Meeting
of the Association for Computational Linguistics:
Human Language Technologies. Association for
Computational Linguistics, Portland, Oregon, USA, pp.
142–150.
Makice, K., 2009. Twitter API: Up and running: Learn how
to build applications with the Twitter API. O’Reilly
Media, Inc.
Marres, N., Weltevrede, E., 2013. Scraping the social?
Issues in live social research. Journal of cultural
economy 6, 313–335.
Miller, G.A., 1995. WordNet: a lexical database for
English. Communications of the ACM 38, 39–41.
Naqvi, N., Shiv, B., Bechara, A., 2006. The role of emotion
in decision making: A cognitive neuroscience
perspective. Current directions in psychological science
15, 260–264.
Pennington, J., Socher, R., Manning, C.D., 2014. Glove:
Global vectors for word representation, in: Proceedings
of the 2014 Conference on Empirical Methods in
Natural Language Processing (EMNLP). pp. 1532–
1543.
Plutchik, R., 2001. The nature of emotions: Human
emotions have deep evolutionary roots, a fact that may
explain their complexity and provide tools for clinical
practice. American scientist 89, 344–350.
Poria, S., Gelbukh, A., Cambria, E., Yang, P., Hussain, A.,
Durrani, T., 2012. Merging SenticNet and WordNet-
Affect emotion lists for sentiment analysis, in: 2012
IEEE 11th International Conference on Signal
Processing. IEEE, pp. 1251–1255.
Sosa, P.M., 2017. Twitter Sentiment Analysis using
Combined LSTM-CNN Models. Eprint Arxiv.
Strapparava, C., Valitutti, A., others, 2004. Wordnet affect:
an affective extension of wordnet., in: Lrec. Citeseer, p.
40.
Tayib, S., Jamaludin, Z., 2016. An Algorithm to Define
Emotions Based on Facial Gestures as Automated Input
in Survey Instrument. Advanced Science Letters 22,
2889–2893.
TMDb, 2018. TMDb About [WWW Document]. URL
https://www.themoviedb.org/about?language=en
(accessed 5.11.18).
Tripathi, V., Joshi, A., Bhattacharyya, P., 2016. Emotion
analysis from text: A survey. Center for Indian
Language Technology Surveys.
Valitutti, A., Strapparava, C., Stock, O., 2004. Developing
affective lexical resources. PsychNology Journal 2, 61–
83.
Wilson, T., Wiebe, J., Hoffmann, P., 2005. Recognizing
contextual polarity in phrase-level sentiment analysis,
in: Proceedings of Human Language Technology
Conference and Conference on Empirical Methods in
Natural Language Processing. pp. 347–354.
KDIR 2020 - 12th International Conference on Knowledge Discovery and Information Retrieval
168
