
Ontology-based Methods for Classifying Scientific Datasets into Research
Domains:
Much Harder than Expected
Xu Wang, Frank Van Harmelen and Zhisheng Huang
Vrije University Amsterdam, De Boelelaan 1105, 1081 HV Amsterdam, The Netherlands
Keywords:
Ontology Classification, Domain Classification, Semantic Similarity, Data Science, Google Distance.
Abstract:
Scientific datasets are increasingly stored, published, and re-used online. This has prompted major search
engines to start services dedicated to finding research datasets online. However, to date such services are limited
to keyword search, and provide little or no semantic guidance. Determining the scientific domain for a given
dataset is a crucial part in dataset recommendation and search: ”Which research domain does this dataset
belong to?”. In this paper we investigate and compare a number of novel ontology-based methods to answer
that question, using the distance between a domain-ontology and a dataset as an estimator for the domain(s)
into which the dataset should be classified. We also define a simple keyword-based classifier based on the
Normalized Google Distance, and we evaluate all classifiers on a hand-constructed gold standard. Our two main
findings are that the seemingly simple task of determining the domain(s) of a dataset is surprisingly much harder
than expected (even when performed under highly simplified circumstances), and that (again surprisingly), the
use of ontologies seems to be of little help in this task, with the simple keyword-based classifier outperforming
every ontology-based classifier. We constructed a gold-standard benchmark for our experiments which we
make available online for others to use.
1 INTRODUCTION
Scientific datasets play a crucial role in scientific re-
search. Dataset search engines collect many scientific
datasets online, and provide these to researchers. Some
existing dataset search engines that aim to satisfy this
demand are Google DataSet Search
1
, Mendeley Data
2
and Elsevier DataSearch
3
.
Determining the research domain of a dataset is
a key point for researchers when reusing this dataset,
because topical relevance is a very import information
to consider for secondary data (Gregory et al., 2020).
If we represent each candidate domain by a domain-
specific ontology, the task of domain-classification
turns into the task of ontology-selection: which ontol-
ogy (and therefore which domain) should be selected
based on the description of the dataset? Ontology
selection is the process of selecting and ranking a
list of ontologies, sorted by how well they meet a
certain ontology evaluation task (Sabou et al., 2006).
1
https://toolbox.google.com/datasetsearch
2
https://data.mendeley.com/
3
https://datasearch.elsevier.com/
Existing ontology selection approaches can be classi-
fied into three types: based on popularity (Patel et al.,
2003) (Ding et al., 2005) (Buitelaar et al., 2004), based
on richness of knowledge (Alani and Brewster, 2005)
and based on topic coverage (Lopez et al., 2006). We
provide a new ontology selection task. In this pa-
per, the ontology selection task is to find the ontology
which best describes a given dataset. Ontology se-
lection becomes a process of finding an ontology for
a given dataset, which is why our new task is called
”ontology classification”.
We develop and test a number of ontology-based
methods for classifying a dataset into a particular
domain, using ontology-based similarity measures.
There are many existing ontology-based similarity
measures to calculate similarity between terms, such
as (Wu and Palmer, 1994) and (Resnik, 1995), Lin (Lin
et al., 1998). We develop and test a number of
ontology-based classification methods, and compare
them against a simple domain-name classifier using
Normalized Google Distance. To our surprise, the
simple keyword-based classifier outperforms all the
ontology-based approaches.
Wang, X., Van Harmelen, F. and Huang, Z.
Ontology-based Methods for Classifying Scientific Datasets into Research Domains: Much Harder than Expected.
DOI: 10.5220/0010056101530160
In Proceedings of the 12th International Joint Conference on Knowledge Discovery, Knowledge Engineering and Knowledge Management (IC3K 2020) - Volume 1: KDIR, pages 153-160
ISBN: 978-989-758-474-9
Copyright
c
2020 by SCITEPRESS – Science and Technology Publications, Lda. All rights reserved
153

2 MOTIVATION
A number of existing dataset search engines exist to
find datasets provided by other researchers. Users
of such dataset search engines often want to classify
datasets by research domain, and then explore the
datasets from the particular domain which they are
interested in. The most obvious approach would be
to rely on domain-labelling provided by the author of
the dataset. However, user-provided labels are known
to be notoriously unreliable (Hovy and Lavid, 2010).
For datasets from scientific papers, the domain of the
paper or the domain of the journal or conference of the
paper could be a good way to determine the domain
of a dataset. However, this approach obviously only
applies to datasets that have an associated publication
in a journal or conference.
An inspection of three popular dataset search en-
gines, Google Dataset Search, Mendeley Data and
Elsevier DataSearch reveals that we can easily sort
datasets by source, data type, date and so on. How-
ever, none of them consider the domain of datasets.
This is because many dataset providers do not anno-
tate their dataset with a clear domain. Consequently,
in this paper we aim to find an effective approach to
automatically classify scientific datasets into the right
domain.
3 PRELIMINARIES
In this section, we introduce our approach to keyword
extraction from the dataset description, as well as the
similarity measures used in our classifiers.
3.1 Keyword Extraction Approach
In this paper, we will extract keywords from text
(the description of the dataset), without having any
pre-training model for keywords extraction available.
Consequently, unsupervised keyword extraction ap-
proaches are our only choice. There are many popular
unsupervised keywords extraction approaches, such
as TextRank (Mihalcea and Tarau, 2004), Rake (Rose
et al., 2010), TF-IDF (Salton and Buckley, 1988) and
so on. We choose to use TextRank because it consid-
ers not only context but also recursive information of
text, and we use the TextRank implementation from
Gensim
4
.
4
https://radimrehurek.com/gensim/summarization/
keywords.html
3.2 Similarity Measures
We use several similarity metrics for calculating the
similarity between a dataset and an ontology. The cov-
erage metric is a simple measure, which just considers
the intersection of two sets. The Jaccard metric con-
siders not only the intersection but normalises this by
the union of the two sets. The Normalized Google Dis-
tance (NGD) is a semantic similarity measure based
on the number of co-occurences in the Google search
engine. Word2vec measures are based on a text corpus
converted into a set of vectors and returns the cosine
similarity between two word vectors.
Jaccard Similarity.
Given two sets of keywords
A
and B, the Jaccard similarity between A and B is:
Jaccard(A,B) =
A ∩ B
A ∪ B
(1)
Google Distance.
The Google Distance between a
dataset and an ontology is based on the Normalized
Google Distance (NGD) (Cilibrasi and Vitanyi, 2007),
which is a semantic similarity measure computed from
results of the Google search engine. The NGD be-
tween two terms a and b is defined as:
NGD(a, b) =
max{log f (a),log f (b)} − log f (a,b)
logM − min{log f (a),log f (b)}
(2)
where
f (a)
is the number of Google hits of
a
;
f (a, b)
is
the number co-occurences of
a
and
b
on the same web
page; and
M
is the total number of web pages searched
by Google times the average number of search terms
occurring on pages (estimated to be
25x10
9
). Roughly
speaking this computes the normalised probability of
two terms co-occurring on a web-page (adjusted log-
arithmically for scale). Using NGD, we can provide
the definition of the Google Distance GD between two
sets of keywords A and B as:
GD(A,B) =
{
∑
NGD(a, b)|a ∈ A,b ∈ B}
|A| ∗ |B|
(3)
where |A| and |B| is the size of A and B, respectively.
Word2Vec.
Word2Vec (Mikolov et al., 2013) is a
very popular NLP algorithm, which produces a vector
space of words based on a given corpus. With the help
of this vector space, similarity measures between two
vectors can be calculated, such as the Cosine distance
or Euclidean distance. We use the DL4J-Word2Vec
library
5
for learning the word embedding of all the
5
http://deeplearning4j.org/docs/latest/
deeplearning4j-nlp-word2vec
KDIR 2020 - 12th International Conference on Knowledge Discovery and Information Retrieval
154

keywords in our experiments. The training corpus we
used for word2vec is the Google News corpus
6
en-
riched with a corpus trained on the Mendeley datasets
that we used in this paper. We use the cosine similarity
measure to calculate the similarity between terms.
4 ONTOLOGY CLASSIFIER AND
DOMAIN-NAME CLASSIFIER
We will now introduce our approaches to classify the
research domain for scientific datasets. The domain
classifier is a simple baseline method that finds the
domain for a dataset by calculating the similarity be-
tween the dataset and the name of the domain (e.g.
”Computer Science”). Beyond this baseline method,
the ontology classifiers will consider the ontology of
a research domain, in other words we will reduce the
problem of domain classification to the problem of
ontology classification.
4.1 Domain-name Classifier Approach
As baseline, we use a simple classifier that calculates
the Google Distance between the keywords from the
metadata of the dataset and a single term that repre-
sents the domain name (e.g. ”Computer Science”).
To allow comparison with the ontology classifiers,
we ensure that this domain name includes everything
that is covered by the ontology. Therefore, the defini-
tion of domain in this paper is the broadest term for
each scientific domain, which means that ”Semantic
Web” or ”Machine Learning” are not domain names
in this paper but ”Computer Science” and ”Physics”
are, ensuring that the domain name has the same cov-
erage as the corresponding ontology. We use this very
simple approach as a baseline to compare with all
the ontology-based approaches. Different from the
ontology-based classifiers, the domain-name classi-
fier just considers keywords from (the meta-data of)
the datasets and the domain names. Intuitively, the
Google search engine can be considered as a huge
”knowledge source”, which covers most concepts and
relationships across every research field. Using the
Google search engine, the domain-name classifier can
show how close a dataset is to each domain by cal-
culating the similarity between the description of the
dataset and the name of the domain.
Def. 1
(
Google Distance between Dataset and
Domain-name
)
.
Given a set of keywords
K
D
ex-
tracted from dataset
D
and a domain which has name
6
https://code.google.com/archive/p/word2vec/
Domain
N
, the Google Distance between these is:
GD(D,Domain
N
) =
{
∑
NGD(d,Domain
N
)|d ∈ K
D
}
|K
D
|
(4)
where
|K
D
|
is the number of keywords extracted from
dataset D.
Then we can introduce our domain-name classifier
algorithm, denoted as DnC(D, List
Domain
).
Algorithm 1: DnC(D,List
Domain
).
Input :D: a dataset, List
Domain
: a list of domain
names
Output :Most similar domain Domain
D
Sim
max
← 0.0;
Domain
D
← empty;
foreach Domain name DN ∈ List
Domain
do
Sim
D,DN
← GD(D,DN);
if Sim
D,DN
> Sim
max
then
Domain
D
← DN;
Sim
max
← Sim
D,DN
;
end
end
return Domain
D
;
4.2 Ontology Classifier Approaches
Different from the ontology selection introduced in
(Sabou et al., 2006), our approach to ontology selec-
tion is to find a suitable ontology based on the sim-
ilarity between the keywords from a dataset and the
keywords from the ontology. We use the keywords
extraction method from the Gensim implementation of
TextRank introduced above to extract keywords from
the title and the description of datasets.
In order to apply the similarity metrics defined
above, we need to extract the keywords of the candi-
date ontologies (each representing a particular scien-
tific domain). However, for an ontology with rich con-
cepts, it’s not a good choice to consider all the concepts
as keywords because especially for large ontologies,
many concepts from the ontology will be irrelevant for
any specific dataset, adversely affecting the distance
metric even for datasets belonging to the same domain
as the ontology. Additionally, the calculation of the
similarity between a dataset and an ontology will be
more efficient when not all the concept from the on-
tology will be considered. We therefore introduce a
new notion called an ”ontology specific view”, to cal-
culate the similarity between an ontology and a dataset
more effectively and efficiently. Given a dataset
D
and
an ontology
O
, the ontology specific view of
D
on
O
is the set of keywords from
D
which match with the
name of some concepts in
O
. To retrieve such names,
we used the commonly used semantic web vocabulary
Ontology-based Methods for Classifying Scientific Datasets into Research Domains: Much Harder than Expected
155

”rdfs:label”. In other words, the ontology specific view
gives a way to recognize keywords that match with the
concepts from an ontology.
Informally, just like looking at the world with col-
ored glasses, we consider the ontology specific view
as the ”colored glasses”. The ontology we use deter-
mines the ”color of the glasses”, and we see the set of
keywords only through this ”ontological color”. The
”coloured glasses” that give the best view of the set of
keywords is the best selection.
Def. 2
(
Ontology Specific View
)
.
Given a dataset
D
and an ontology
O
, the ontology specific view
OSV
D,O
of
D
based on
O
is a set of concepts which are both
concepts from the ontology
O
as well as keywords
appearing in the dataset D:
OSV
D,O
= {c|c ∈ W
D
∩C
O
} (5)
where
C
O
is the set of concepts from ontology
O
and
W
D
is the set of keywords from dataset D.
We consider the ontology specific view as the
”domain-specific keywords of a dataset”. Then, we
can calculate similarity between a dataset and an on-
tology using the keywords of dataset and the ontology
specific view.
Def. 3
(
Similarity between Dataset and Ontology
)
.
Given a dataset
D
and an ontology
O
, the similarity
sim
D,O
between
D
and
O
is the average of the similar-
ity between the keywords from D and OSV
D,O
:
sim
D,O
=
{
∑
|K
D
|
i=1
∑
|OSV
D,O
|
j=1
sim(d
i
,o
j
)|d
i
∈ K
D
,o
j
∈ OSV
D,O
}
|K
D
||OSV
D,O
|
(6)
where K
D
is the set of keywords of dataset D.
Before we introduce the definition of ontology clas-
sifier, we first look back at the similarity measures
introduced in the last section. All the similarity mea-
sures are defined between two sets of terms, and can be
applied to determine the similarity between a dataset
(reduced to the ontology-specific view of its extracted
keywords) and an ontology. This is because both the
keywords from a dataset and from the ontology spe-
cific view are sets of terms. This results in the follow-
ing definitions of similarity measures:
Def. 4
(
Jaccard Similarity between Dataset and
Ontology
)
.
Given a dataset
D
and an ontology
O
,
the Jaccard similarity between D and O is:
Jaccard(K
D
,OSV
D,O
) =
K
D
∩ OSV
D,O
K
D
∪ OSV
D,O
(7)
where
K
D
is the set of keywords from
D
, and
OSV
D,O
is the ontology specific view of D based on O.
Def. 5
(
Google Distance between Dataset and On-
tology
)
.
Given a dataset
D
and an ontology
O
, the
Google Distance GD
D,O
of D and O is:
GD(D,O) =
{
∑
NGD(d,o)|d ∈ K
D
,o ∈ OSV
D,O
}
|K
D
| ∗ |OSV
D,O
|
(8)
We also provide a simple ontology classifier ap-
proach with coverage similarity. Coverage similarity
just considers the size of the ontology specific view,
which means that it only considers the coverage of the
ontology concepts.
Def. 6
(
Coverage Similarity between Dataset and
Ontology). Coverage similarity between a dataset D
and an ontology
O
measures the size of the ontology
specific view OSV
D,O
of D and the size of O:
Cover(D,O) =
|OSV
D,O
|
|O|
(9)
where |O| is the number of concepts in ontology O.
Using these similarity measures between dataset
and ontology, we can now provide the definition of an
ontology classifier.
Def. 7
(
Ontology Classifier Task
)
.
Given a dataset
D
and a list of ontology candidates
List
O
, an ontology
classifier should find the suitable ontology
O
i
so that
Sim
D,O
i
≥ Sim
D,O
j
for each O
i
,O
j
∈ List
O
.
Based on the ontology classifier task, we can intro-
duce our algorithm
OC(D, List
O
,Sim)
for an ontology
classifier, in which the similarity measure
Sim
could
be any one of the similarity measures between dataset
and ontology.
Algorithm 2: OC(D,List
O
,Sim).
Input :D: a dataset, List
O
: a list of ontology
candidates, Sim: similarity measure
between dataset and ontology
Output :most similar ontology O
Sim
max
← 0.0;
O ← empty;
foreach ontology O
0
∈ List
O
do
if Sim
D,O
> Sim
max
then
O ← O
0
;
Sim
max
← Sim
D,O
;
end
end
return O
5 EXPERIMENTS AND RESULTS
In this section we will introduce the datasets and on-
tology candidates used in experiments, pipeline of
experiment, evaluation method for experiment and re-
sults.
KDIR 2020 - 12th International Conference on Knowledge Discovery and Information Retrieval
156

5.1 Experiments Setup
Dataset.
The datasets we used in our experiments
are from Mendeley Data
7
. We choose from Mendeley
Data 960 datasets, which are associated with a pub-
lished paper in a known journal. The distribution of
research domains across all the datasets are:
• 60 datasets from the biomedical domain.
• 33 datasets from the computer science domain.
• 180 datasets from the physics domain.
• 683 datasets from the finance domain.
• 4 datasets from the environment domain.
The URI’s of all of these datasets are made available
by us
8
.
We chose these these 960 datasets for the following
reason. First, all of these datasets are retrieved from
Mendeley, which means these are scientific datasets
actually shared by scientists; secondly, these datasets
are all annotated with a link to an associated paper
in their metadata, which means we can retrieve the
gold standard label through the link to the journal of
the paper associated with the dataset. The first reason
ensures the ecological validity of our benchmark, the
second reason ensures that we have a gold standard to
evaluate our results against.
On inspection of the 960 datasets in our gold stan-
dard, we find that there is a strong bias on the distri-
bution of the domains of these datasets, with 70% la-
belled with ”finance”. To compensate for this, we add
a balanced-distribution experiment to check whether
this bias influences experiment results or not. In
the balanced-distribution experiment, we choose 217
datasets (60 from biomedical, 60 from physics, 60
from finance, 33 from computer science and 4 from
environment).
i d : 10 9 5 3 1 2 1 1 2 2 5 4 1 1812111 9 1 1 9 9 8 :MENDELEY DATA,
t i t l e : ” D a t a f o r : D i s t r i b u t i o n n e t w o r k p r i c e s an d
s o l a r PV: R e s o l v i n g r a t e . . . ” ,
d e s c r i p t i o n : ” A b s t r a c t o f a s s o c i a t e d a r t i c l e :
1−in −4 d e t a c h e d h o u s e h o l d s i n . . . ” ,
s u b j e c t A r e a s : F i n a n c e ,
Keywords CSO : [ a r t i c l e , h o u s e h o l d , r a t e , . . . ] ,
K e y w o r d s P h y s i c s : [ a r t i c l e , r a t e , d i s t r i b u t i o n , . . . ] ,
Keywords FINANCE : [ a r t i c l e , h o u s e h o l d , r a t e , . . . ] ,
Ke yw ords Envo : [ a r t i c l e , s o l a r , r a t e , d i s t r i b u t i o n , . . . ] ,
Ke y w o rds Bio : [ s i g n a l r e c o g n i t i o n p a r t i c l e 7 s r n a , . . . ] ,
Keywor ds : [ r a t e , t a r i f f , h o u se h o l d , n e t w o r k , . . . ] ,
d a t a s e t u r l : h t t p s : / / d a t a . mendel e y . com / d a t a s e t s / bwwyv6zy5m ,
DOI : 1 0 . 1 7 6 3 2 / bwwyv6zy5m . 1 ,
l i c e n c e : ”CC BY NC 3. 0 ”
Figure 1: Meta-Data of Mendeley Dataset in JSON.
7
https://data.mendeley.com/
8
https://github.com/eva01wx/WISE
ClassifiactionPaper Datasets
We give an example of the meta-data of a Mendeley
dataset in Figure 1. There are the descriptive metadata
(id, title, description, etc.) and administrative metadata
(licence) in the Mendeley collection. The metadata
”id” is the unique identifier used to index the dataset.
The metadata-fields ”title” and ”description” give a
description of the content and usage of the dataset. We
use these to extract keywords of datasets and in order
to compute the ontology specific view. The metadata-
field ”extractedKeywords” is the set of keywords of
a dataset given in Mendeley. We compute five other
metadata fields for ontology-specific ”extractedKey-
words”, such as ”extractedKeywords CSO”, where for
example ”extractedKeywords CSO” is the ontology
specific view of the computer science ontology CSO
for this dataset, and similar for the other ontologies.
The metadata-field ”dataset url” is the URL linked to
the Mendeley Data search engine. Through this URL,
one can find the description of the dataset (such as title,
associated paper, etc.).
We only use the title and description of datasets for
our classification task, without considering any other
information from the dataset itself. This is because
that we treat the dataset itself as a ”black box” from
which we cannot get any information except for the
title and description. Many scientific datasets have
highly specialised data formats (gene sequences, im-
ages, geo-coordinates, etc.), and these are not suitable
for extracting information in a general purpose search
engine. So we chose to take the hardest case possible,
namely assuming that no information can be gained
from the dataset itself, and all we have are the human
readable descriptions.
Ontology Candidates.
We use five ontology can-
didates from five domain for our ontology selec-
tion task: FIBO
9
(Finance), UMLS
10
(Biomedical),
CSO
11
(Computer Science), ENVO
12
(Environment)
and OPB
13
+physics
14
(Physics). We chose these on-
tology candidates because they are the richest or most
popular ontologies in their domain. For the physics
domain, since there is not any existing ontology that
can cover most concepts in physics domain, we com-
bined physics for biology ontology with a physics for
astronomy ontology.
9
https://spec.edmcouncil.org/fibo/
10
https://www.nlm.nih.gov/research/umls/
11
https://cso.kmi.open.ac.uk/home
12
http://environmentontology.org/
13
https://sites.google.com/site/
semanticsofbiologicalprocesses/projects/
the-ontology-of-physics-for-biology-opb
14
http://www.astro.umd.edu/
∼
eshaya/astro-onto/owl/
physics.owl
Ontology-based Methods for Classifying Scientific Datasets into Research Domains: Much Harder than Expected
157
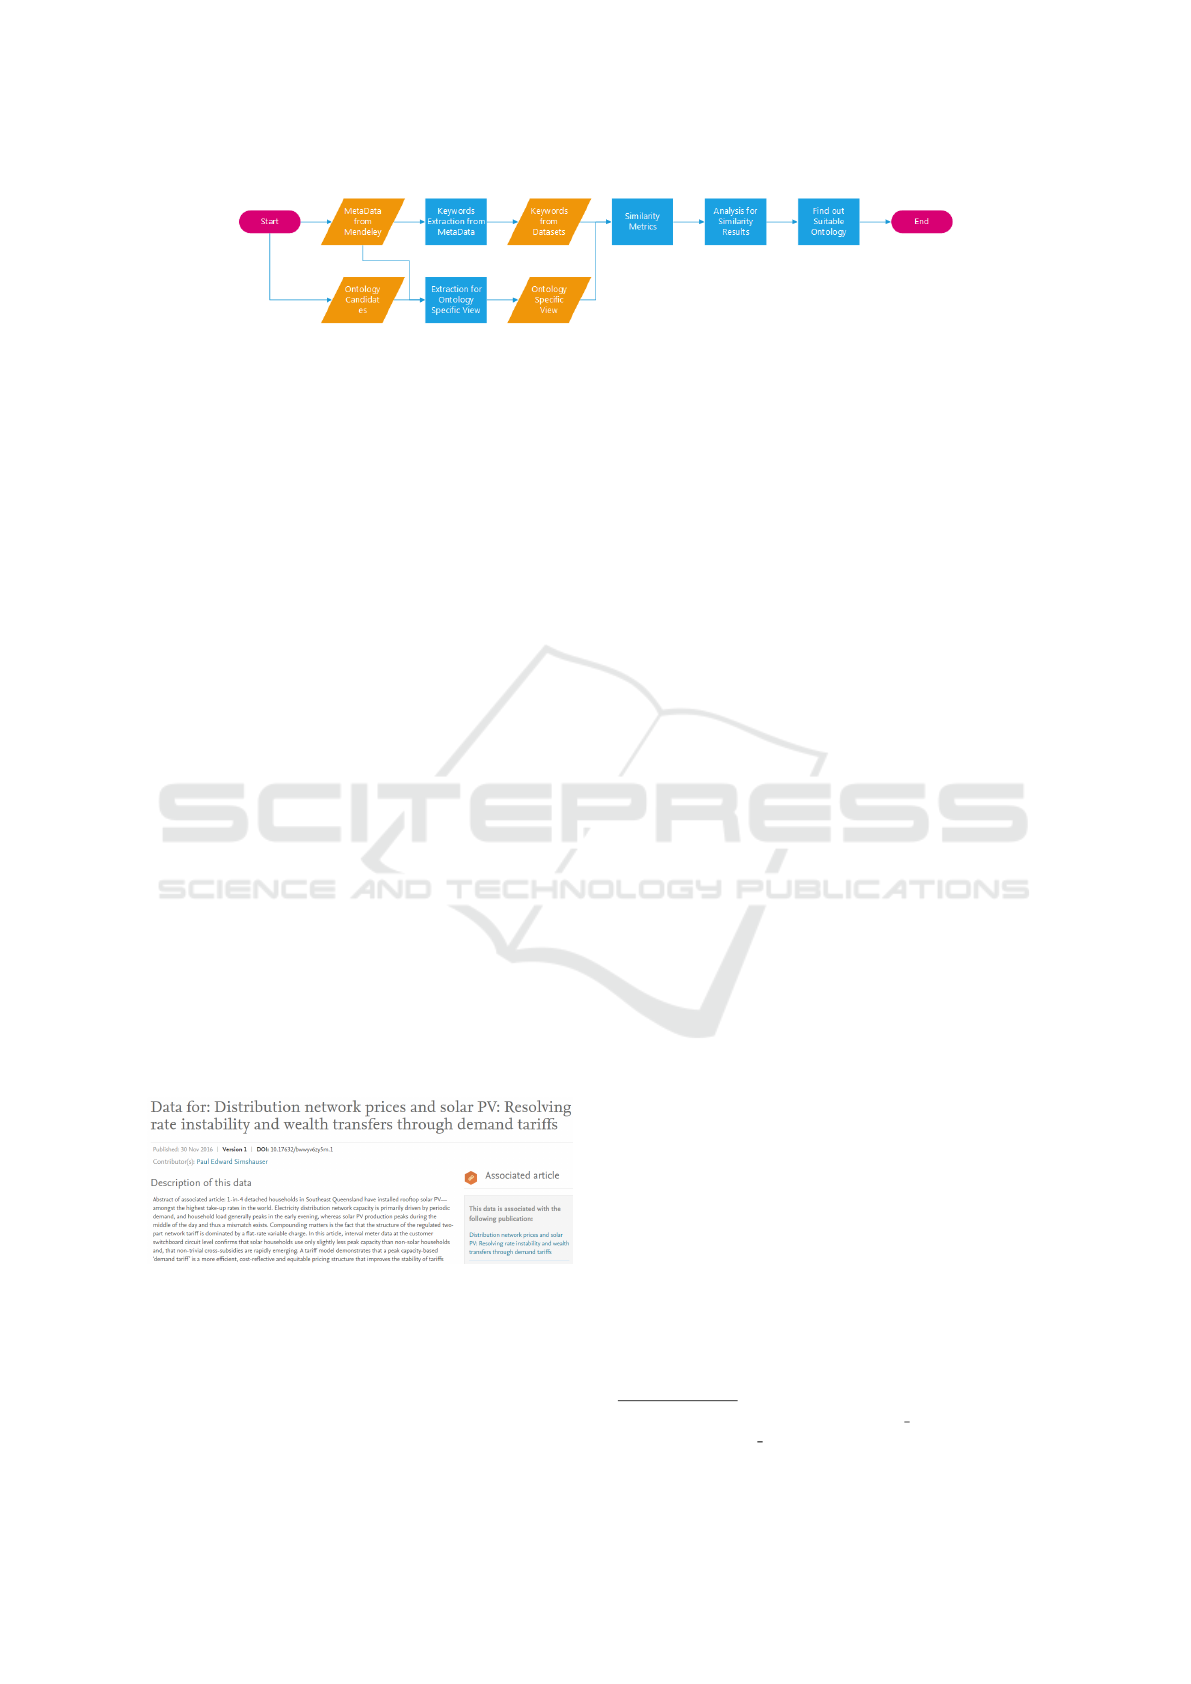
Figure 2: Pipeline for Ontology Classifier Experiemnt.
Pipeline for Ontology Classifier Experiment.
The
whole pipeline for the ontology classifier experiment
is depicted in Figure 2. Given a list
List
D
of Mende-
ley datasets and a list
List
O
of ontology candidates
the process of the ontology classifier experiment is as
follows:
1.
Extract keywords
K
D
from Mendeley datasets
D ∈
List
D
.
2.
For each ontology
O ∈ List
O
, extract the ontology-
specific view OSV
O,D
based on O from D ∈ List
D
.
3.
Calculate the similarity between
K
D
and
OSV
O,D
by using different similarity metrics, and consider
this as the similarity between dataset
D
and ontol-
ogy O.
4.
Choose the most suitable ontology from
List
O
for
D ∈ List
D
based on the similarity between
D
and
each O ∈ List
O
.
5.2 Evaluation
We use the associated paper of each of our datasets as
the gold standard for our evaluation. This is because
Mendeley does not list a domain for the datasets in
the above collection. Instead, we constructed a gold
standard by following for each of the listed datasets the
link to the journal in which the paper was published
that is mentioned in the dataset’s metadata, and then
determining by hand what is the appropriate domain
based on the information about the journal.
Figure 3: Mendeley dataset (https://data.mendeley.com/
datasets/bwwyv6zy5m).
As we can see in Figure 1, each Mendeley dataset
used in our experiment is associated with a Mendeley
dataset link. Through the Mendeley dataset link, we
can find the associated paper (Figure 3). Then we
find the associated journal which the associated paper
is published in. It’s easy to decide which domain a
journal belongs to through the link to the journal of the
associated paper. So with the help of the associated
journal, we can decide the gold standard domain of
all Mendeley datasets. We publish this gold standard
online
15
.
According to the gold standard above, we use two
measures to evaluate the experiment results. The first
one is simple accuracy, which means that we just con-
sider the score of the number of datasets, which are
classified to right domain, divided by the total num-
ber of datasets as accuracy. The second one is F1-
measure (Chinchor, 1992), which is always used to
evaluate the accuracy of results of classification mea-
sures. In our experiments, F1-measure is used to eval-
uate results for each domain.
For F1-measure in our experiments, given a partic-
ular domain, we define True-Positive, True-Negative,
False-Positive and False-Negative as follow:
• True-Positive:
The list of datasets which are not
only classified to given domain in gold standard but
also are classified to given domain by classification
measures.
• True-Negative:
The list of datasets which are not
classified to given domain by both gold standard
and classification measures.
• False-Negative:
The list of datasets which are
classified to given domain by gold standard but
not by classification measures.
• False-Positive:
The list of datasets which are clas-
sified to given domain by classification measures
but not by gold standard.
We also introduce a novel approach to evaluate
the result of F1 measure. In classification task, there
are always several classification targets, which are the
candidates the given data/datasets would be classified
into. For instance, if we want to classify dataset into
research domain, and we have three domain candidates.
Then we can say that these three domain candidates
are the classification targets.
Based on the number of classification targets, we
can have the random accuracy. For example, if we have
15
https://github.com/eva01wx/WISE
ClassifiactionPaper Datasets
KDIR 2020 - 12th International Conference on Knowledge Discovery and Information Retrieval
158
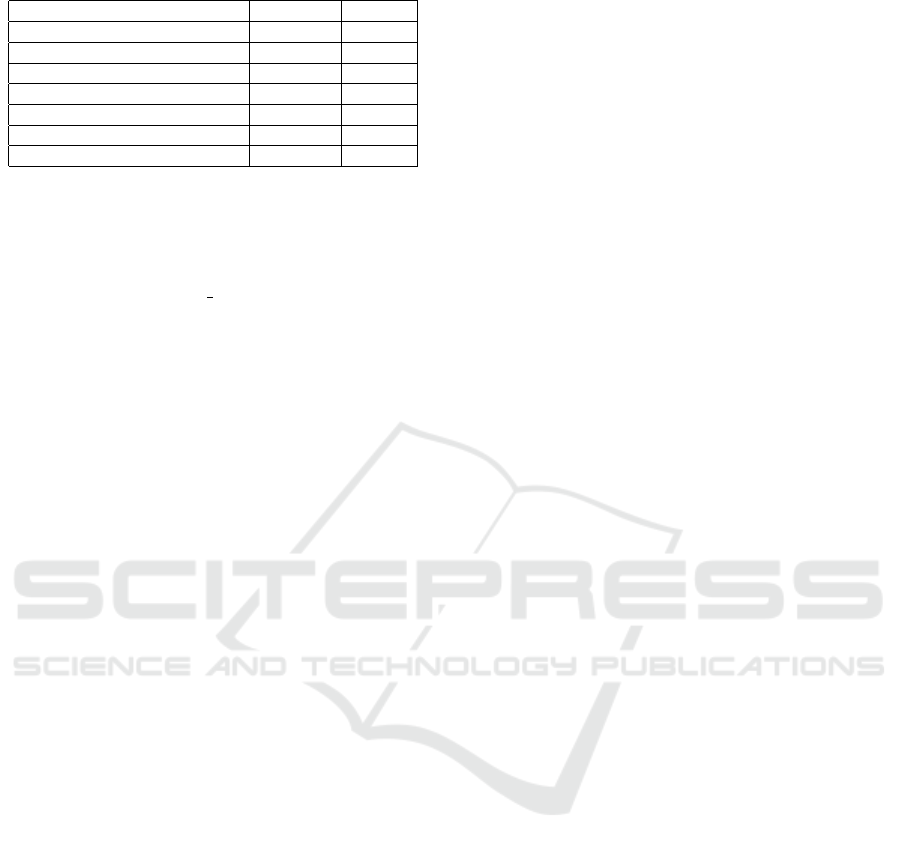
Table 1: Simple Accuracy Results.
Measures UnBalanced Balanced
Google Distance (with Domain Name) 72.5% 63.5%
Coverage 76.8% 47.5%
Jaccard 22.4% 31.8%
Coverage + Jaccard 48.9% 30.2%
Word2Vec(Google News) 30.6% 27.5%
Word2Vec(Self-training) 29.6% 16.4%
Google Distance 36.1% 26.2%
three classification targets, we have random accuracy
33.3% (1/3) for classifying dataset into right domain.
With the help of random accuracy, we can compute
the random F1 score:
Random F1 = 1/n (10)
where
n
is the number of classification targets. Let’s
continue the example above. When we have random
accuray 33.3% (1/3) with three classification targets,
we have random F1 socore 33.3% (1/3). This is be-
cause if random accuracy is 33.3% (1/3), then we can
know that True positive, True negative, False negative
and False positive is 11.1% (1/9), 44.4% (4/9), 22.2%
(2/9) and 22.2% (2/9), respectively. Then we can easily
know that precision is 33.3% (1/3) and recall is 33.3%
(1/3). With precision and recall, we can compute that
F1 score is 33.3% (1/3). We compare the F1 scores of
our experiments against this random F1 score.
5.3 Results
We run two versions of our experiments: with the
unbalanced distribution of the datasets (with a strong
bias in favour of the finance domain), and a balanced
distribution of datasets which compensates for this
bias, as described in the section on our experimental
setup. Both experiments aim to find out the best metric
to use for classifying datasets into right domain. The
balanced experiment is to see if the bias of distribution
will impact the performance of these metrics.
All results are given as the accuracy of the domain-
classification by comparing it with the results from the
gold standard. As we can see in Table 1, we tested
7 different approach for both the balanced and the
unbalanced scenario, including both the domain-name
classifier and the different ontology-based classifiers.
In the unbalanced experiment, two measures reach a
high accuracy (
>
70%). In the balanced experiment,
only one measure reaches 60% accuracy.
We also split out these results for each of the dif-
ferent domains, again for both the balanced and the
unbalanced scenario, in tables 2 and able 2, compar-
ing against the random f-1 score, which is 20% in our
experiment.
Unsurprisingly, in the unbalanced scenario in Ta-
ble 2, all methods have a good F1-score on the finance
domain and outperform the random F1 score. But dis-
appointingly, for any of the other domains only the
Google Distance (distance from the domain name) and
the Coverage metric have a better than random F1
score an any of the other domains. For the balanced
scenario, which is shown in Tabel 2, the scores are
even lower: only the Google Distance from the Do-
main Name performed reasonably well, outperforming
the random score in three domain. The coverage metric
managed to do this in two domains, as did the mixture
measure of Coverage+Jaccard in the same domains.
Summarising, across both the unbalanced and the
balanced scenario, the simple domain-name classifier
based on Google Distance outperforms the Coverage-
based ontology classifier approach, which by itself was
already the best performing among all the ontology-
based approaches.
6 CONCLUSION
In this paper we have defined the novel task of domain
classification for research datasets. We ran several
experiments not only with ontology-based classifiers,
but also with a simple domain-name classifier, to test
the performance of these classifier approaches. Our
surprising finding is that our experimental results show
that the simple domain classifier approach outperforms
all the ontology-based approaches when classifying
the research domain for a collection of datasets for
which we had obtained gold standard answers. This is
contrary to our initial intuition, where we had expected
that a rich vocabulary as contained in a high quality
domain-specific ontology would provide a better clas-
sifier then simply the single word name of the research
domain.
There are some possible improvements in future
work. In this paper we just considered title and de-
scription of datasets for classification. Other parts of
the content of datasets could be considered in future
work, such as other metadata of datasets and the actual
underlying data in datasets (such as a figure or a table).
Considering these additional information would im-
prove the outcome of classification. In this paper we
ran experiments with 960 datasets from Mendeley, and
only 217 datasets in the balanced scenario. In future
work, we aim to do our classification experiments with
large scale datasets.
We intended to use this domain classification for
further steps in future work. Users often publish their
datasets without mentioning the domain (as is clear
from the dataset on Mendeley). A service that reliably
determines the domain of dataset (our currents score
is over 70%) will make datasets much easier to find by
Ontology-based Methods for Classifying Scientific Datasets into Research Domains: Much Harder than Expected
159
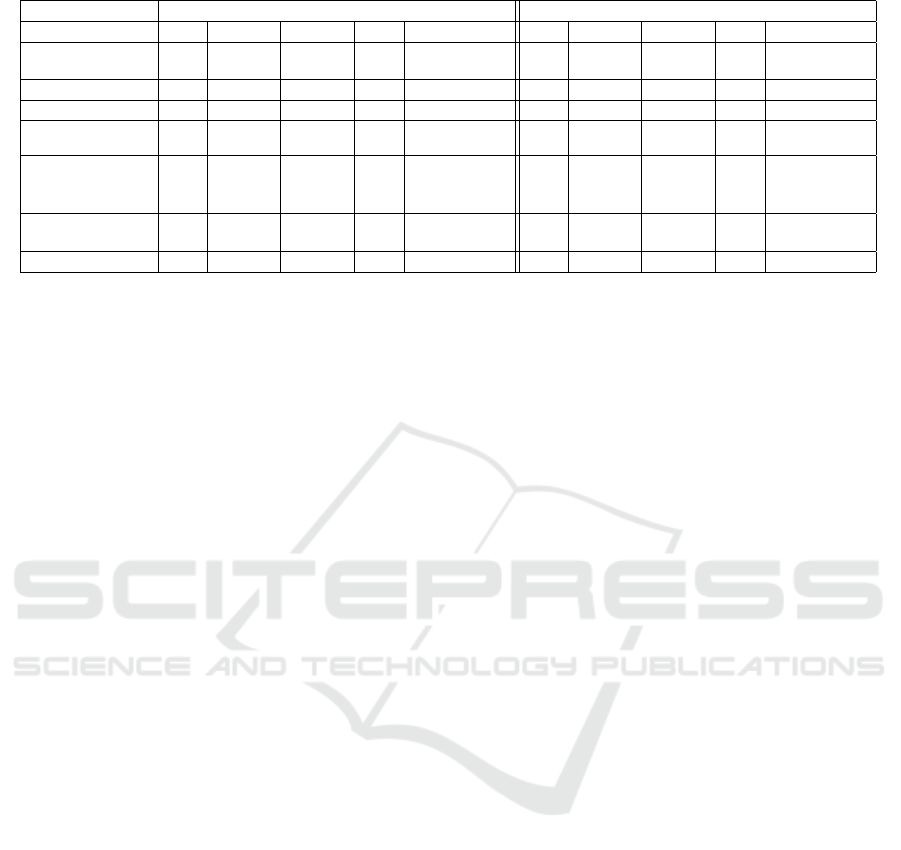
Table 2: F1-Score Results for Unbalanced and Balanced Scenario.
Unbalanced scenario Balanced scenario
Measure CS Physics Finance Bio Environment CS Physics Finance Bio Environment
Google Distance
(Domain Name)
0.03 0.24 0.71 0.05 0.01 0.11 0.31 0.37 0.26 0.02
Coverage 0.0 0.27 0.76 0.01 0.0 0.0 0.38 0.38 0.02 0.0
Jaccard 0.04 0.06 0.25 0.05 0.0 0.16 0.12 0.09 0.21 0.0
Coverage
Jaccard
0.01 0.18 0.55 0.01 0.01 0.03 0.21 0.24 0.03 0.03
Word2Vec
(Google
News)
0.01 0.13 0.36 0.02 0.0 0.03 0.19 0.18 0.10 0.0
Word2Vec
(Self-trained)
0.0 0.10 0.38 0.01 0.01 0.0 0.08 0.15 0.05 0.03
Google Distance 0.01 0.14 0.43 0.02 0.01 0.02 0.17 0.19 0.09 0.01
other scientists. Once we have classified a dataset into
the correct domain, we can try to find similar datasets
from the same domain. This will be an important
support function to help researchers find more datasets
for their research.
ACKNOWLEDGEMENTS
This work has been funded by the Netherlands Science
Foundation NWO grant nr. 652.001.002 which is also
partially funded by Elsevier. The first author is funded
by by the China Scholarship Council (CSC) under
grant number 201807730060.
REFERENCES
Alani, H. and Brewster, C. (2005). Ontology ranking based
on the analysis of concept structures. In Proc. of KCAP
2005, pages 51–58. ACM.
Buitelaar, P., Eigner, T., and Declerck, T. (2004). Ontoselect:
A dynamic ontology library with support for ontology
selection. In ISWC Demo session. Citeseer.
Chinchor, N. (1992). Muc-4 evaluation metrics. In Proc.
the 4th Conf. on Message Understanding, MUC4 ’92,
page 22–29. ACL.
Cilibrasi, R. L. and Vitanyi, P. M. B. (2007). The google
similarity distance. IEEE Transactions on Knowledge
and Data Engineering, 19:370–383.
Ding, L., Pan, R., Finin, T., Joshi, A., Peng, Y., and Kolari,
P. (2005). Finding and ranking knowledge on the se-
mantic web. In ISWC 2005, pages 156–170. Springer.
Gregory, K., Groth, P., Scharnhorst, A., and Wyatt,
S. (2020). Lost or found? discovering data
needed for research. Harvard Data Science Review.
https://hdsr.mitpress.mit.edu/pub/gw3r97ht.
Hovy, E. and Lavid, J. (2010). Towards a ‘science’of corpus
annotation: a new methodological challenge for corpus
linguistics. Internat. J. of translation, 22:13–36.
Lin, D. et al. (1998). An information-theoretic definition of
similarity. In ICML, volume 98, pages 296–304.
Lopez, V., Motta, E., and Uren, V. (2006). Poweraqua:
Fishing the semantic web. In Sure, Y. and Domingue, J.,
editors, The Semantic Web: Research and Applications,
pages 393–410. Springer.
Mihalcea, R. and Tarau, P. (2004). TextRank: Bringing order
into text. In Conf. on Empirical Methods in Natural
Language Processing, pages 404–411. ACL.
Mikolov, T., Sutskever, I., Chen, K., Corrado, G. S., and
Dean, J. (2013). Distributed representations of words
and phrases and their compositionality. In Advances
in neural information processing systems, pages 3111–
3119.
Patel, C., Supekar, K., Lee, Y., and Park, E. (2003). On-
tokhoj: A semantic web portal for ontology search-
ing, ranking and classification. Proceedings of the
Interntational Workshop on Web Information and Data
Management, pages 58–61.
Resnik, P. (1995). Using information content to evaluate
semantic similarity in a taxonomy. In IJCAI’95, pages
448–453.
Rose, S., Engel, D., Cramer, N., and Cowley, W. (2010).
Text Mining: Applications and Theory, chapter Auto-
matic Keyword Extraction from Individual Documents,
pages 1 – 20. Wiley.
Sabou, M., Lopez, V., Motta, E., and Uren, V. (2006). Ontol-
ogy selection: ontology evaluation on the real semantic
web. In WWW Conference 2006.
Salton, G. and Buckley, C. (1988). Term-weighting ap-
proaches in automatic text retrieval. Information Pro-
cessing and Management, 24(5):513 – 523.
Wu, Z. and Palmer, M. (1994). Verbs semantics and lexical
selection. In ACL, pages 133–138.
KDIR 2020 - 12th International Conference on Knowledge Discovery and Information Retrieval
160
