
Consumer Purchased Behavior using Data Mining:
A Case Study of Coffee Shop Service Business
Chantich Santasup and Kallayanee Tengpongsathon
Program of Foodservice Technology and Management, King Mongkut's Institute of Technology Ladkrabang (KMITL),
Ladkrabang Bangkok, Thailand
Keywords: Data Mining Technique, Association Rule Analysis, Market Basket Analysis, Consumer Behaviour,
Coffee and Bakery Business, Foodservice Business.
Abstract: Data mining is the process of discovering patterns in a large data set. It has many methods to find data. The
association rule technique as one of the data mining techniques used to analyze a data set of consumers
purchasing behaviours in a coffee shop located at Phra - Nakhon district Bangkok, Thailand. In this research,
this consumer data was analyzed by using the RapidMiner Studio program. This research aimed to find out
relationships of purchasing between beverage and bakery products and used them to create the promotion.
The results showed the relationship among various product items available in this coffee shop was the most
interesting because the association rule was 63.4 percentage of probability. It meant that if consumers
purchased croissant products, then they would buy coffee beverages at the same time. When considered the
results to create the promotion, we could get various types of product sets. Then, a business owner can use
this information to make a profit and achieve his business target.
1 INTRODUCTION
Data mining is the process of discovering patterns and
relationships in a large data set. It is a tool used to
predict future trends. There are many techniques for
analyzing data in data mining. The association rule or
market basket analysis is one of the data mining
technique. (Pandya and Morena, 2017) It is used in
the discovery of relationships among various items. If
we know that customers purchase one product, and
then they will likely trend to buy another product. It
helps create the right selected promotion from
consumer behavior and generating more profits in the
future.(Nidhi and Snehil, 2018) In 2016, Jeeranun
used the association rule to find a relationship
between beverage and bakery on sales data reports in
"Ban Pong-Fah" restaurant, Thailand. She analyzed
data by using the rapid minor studio program version
6.5 and used order "FP-Growth" algorithm to find out
some relationships in data. From her results, it was
found that there were five rules for "sit-in" service
and nine rules for "take away" service. However, an
interesting rule in this data was "when the customer
purchased milk cake and green tea cake, and then they
had always to purchase coconut cake".(Jeeranan,
2016)
The information about the business values of
coffee in Thailand from food intelligence centre
Thailand statistics was found in 2017 showed the cost
was 2.12 billion baht. In 2018, this value of the coffee
business was growing up around 0.23 billion baht
comparing. And in 2019, they predicted the value of
the coffee business would be 2.59 billion baht.
Nowadays, the coffee-drinking behaviour of Thai
people is changed from the past. They drink coffee
more than 300 cups per person per year, and in the
next 20 years of the future, it will be 1,000 cups per
person per year. Then, the coffee business is an
exciting business for study in this research. (Varee,
2018)
2 MATERIALS
We clarify and separate material are 2 groups.
2.1 Raw Data
We use data from the transaction and sale report from
January 2018 to December 2018, collected from a
coffee shop, was located at Phra-Nakhon district
Bangkok, Thailand.
Santasup, C. and Tengpongsathon, K.
Consumer Purchased Behavior using Data Mining: A Case Study of Coffee Shop Service Business.
DOI: 10.5220/0009998200002964
In Proceedings of the 16th ASEAN Food Conference (16th AFC 2019) - Outlook and Opportunities of Food Technology and Culinary for Tourism Industry, pages 263-267
ISBN: 978-989-758-467-1
Copyright
c
2022 by SCITEPRESS – Science and Technology Publications, Lda. All rights reserved
263

2.2 Programs
Microsoft Excel version 2016
mPos system version 6.3
Rapid Miner Studio Program version 9.2
(educational edition)
3 METHODOLOGY
In this research, there were three stages for studying
consumer data as a case study.
The first stage called preparing data, the second
stage called studying and analyzing consumer
behavior. The third stage called finding out the
relationships of product categories by using the
association rule.
3.1 Preparing Data
Considering and classifying product categories sold
in this coffee shop from the transaction and sale
report. There could be grouped into 10 categories of
1.coffee, 2.tea, 3.chocolate, 4.non-caffeine drink,
5.croissant, 6.puff, 7.sandwich, 8.brownie, 9.cake,
and 10.donut and muffin). After that the transaction
and sale data was downloaded from January 2018 to
December 2018 from the mPos system (version 6.3)
into excel files. And then, selected only bills which
had got at least 2 products purchasing or more than 2
products up per 1 bill. If there was only 1 product in
a bill, it could not find relationship
The next step, recording this data into the
Microsoft Excel files, and finally, transferring data
from the format of qualitative variables to be the
binary format variables (0 or 1). If it has occurred one
product-categories from 10 product categories above
in the transaction data, the number "1" would be
recorded, but if it has not happened any class from 9
categories, the number "0" would be recorded
3.2 Studying and Analysing Consumer
Behaviour
After transferring data, the data from Table2 above
would be analysed consumer behaviour by using the
order filter search function, sum function, and
percentage function from the Microsoft Excel
(version 2016) program. These analysis methods
were used in order to find out "a peak day of
purchasing" and "a peak period of purchasing of each
day."
3.3 Finding out the Relationships of
Product Categories by using the
Association Rule
Importing the transferred data file to the Rapid Miner
Studio (version 9.2) program in order to analyze data
by using the association rule of data mining methods.
The command orders were started with "select
attribute," "numerical to binomial," "FP-Growth,"
and "create association rules".(Eakasit, 2016) After
that, these results would be sorted by "confidence
values" results from a minimum value to a maximum
amount. And then, the critical relationships of each
product category have selected by considering the
values of "confidence value," "support value," and
"lift value" of each link. The calculation of these three
values was done by three equations ((1), (2), (3))
below. The essential relationships would be strong
association rules by considering the confidence value
that should be more than 0.50 or 50 percent. While,
the support value, which should be more than 0.05 or
5%, and the lift value should be more than 0.50 or
50%.(Eakasit, 2014)
The confidence value is the conditional
probability of occurrence given the antecedent.
Confidence
𝐴→𝐵
=
(1)
Support value is an indication of how frequently
the items appear in the data.
Support 𝐴 → 𝐵 =
(2)
Lift value is a value used to compare confidence
with expected confidence.
Lift 𝐴 → 𝐵=
(3)
4 RESULT AND DISCUSSION
4.1 The Purchasing Behaviour of
Consumer on 10 Product
Categories in a Coffee Shop
Results from the study and analysis of consumer
behaviour on 10 product categories in a coffee shop
as a case study were separated into three parts below
16th AFC 2019 - ASEAN Food Conference
264
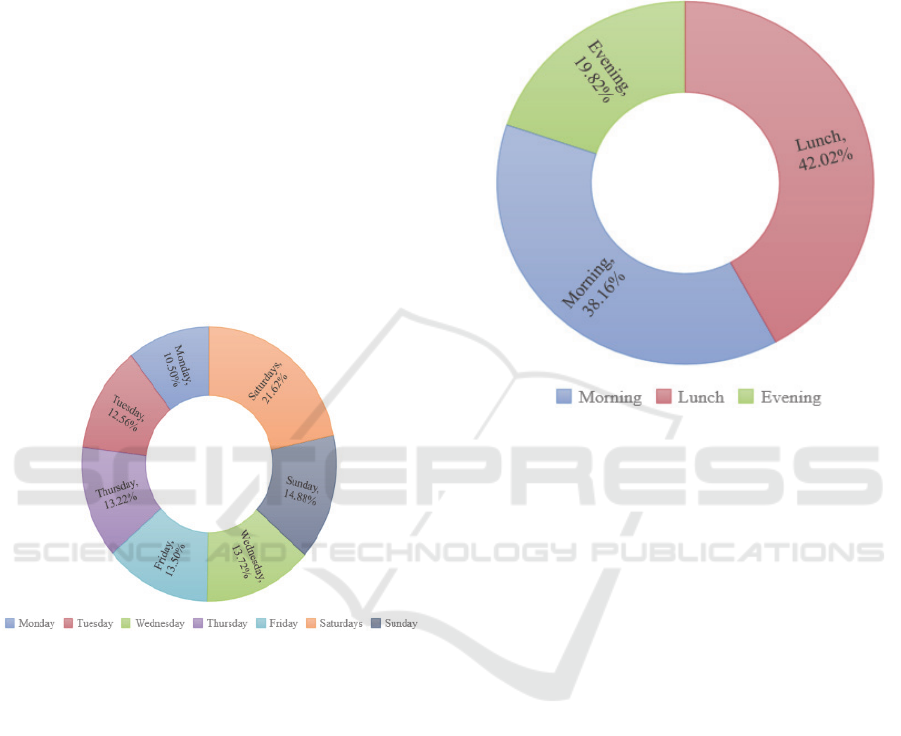
4.1.1 The Result of Percentages of Shared
Purchasing on Seven Days Which
Consumer Purchased Product
Categories
The most popular day on which consumer purchased
product was Saturday (21.62%) And followed by on
Sunday (14.88%), on Wednesday (13.72%), on
Friday (13.50%), on Thursday (13.22%), on Tuesday
(12.56%), and the least of percentages of purchasing
occurred on Monday (10.50%). This result could be
concluded that consumers trended to purchase the
product categorizes from this coffee shop on the
weekend period (Saturday and Sunday) when
compared with the weekday period. This result was
related to the research of Kanda Suejamsil8 in 2012
who studied about the consumer behaviour of coffee
buying at the "Amazon Café." Kanda's result was
shown that consumers would buy the most coffee
products on Saturday and on Sunday. (Kanda, 2012)
Figure 1: The value of shared purchasing in 7 days.
4.1.2 A Result of Purchasing Time Period
per Each Day
The time period that consumers purchased the most
product categories was in the afternoon from 12.00
p.m. - 3.59 p.m. (42.02% of purchasing) and followed
by in the morning from 8.00 a.m. -11.59
a.m.(38.16%), and the least purchasing was in the
evening from 4.00 p.m. - 8.00 p.m. was accounted
only 19.82%. Then, it could be concluded that most
purchasing of consumers was in the afternoon period
from 12.00 p.m. - 3.59 p.m. of each day, It was
because the location of the coffee shop as the case
study in this research was located near many traveling
destinations of the tourists and also closed to the
official places of government agencies having the
official working period from 8.30 a.m. - 4.30 p.m. and
having a lunch break period from 12.00 p.m. - 1.00
p.m., Thus, it was a reason why the number of
consumers was higher during this period. Moreover,
this evidence was also related to results from Kanda
Suejamsil's research in 2012. From Kanda's result
showed that consumers would buy the coffee product
in the period from 12.01 p.m. - 3.00 p.m.
Figure 2: Product categories' purchasing time period per
day.
4.1.3 A Result of Frequency of Product
Purchasing in a Coffee Shop
That from 10,982 orders of purchasing, the highest
order was coffee beverage category (29.06% of
purchasing), followed by tea beverage (18.50% of
purchasing), croissant (18.50 % of purchasing),
donuts and muffin (9.03% of purchasing), non-
caffeine drink (8.98% of purchasing), chocolate
beverage(8.00% of purchasing), brownies(5.25% of
purchasing), from cake(4.66% of purchasing),
sandwich(4.45% of purchasing), and the least amount
of purchasing was puff from 10 categories which only
3.76 % of purchasing from 413 orders, respectively.
However, the results from three parts showing
based on basic cycle graphs and bar graphs showed
important consumer behaviours on the coffee shop
service business, which can be considered for
creating the new promotional campaign. Moreover, if
we like to know more details of consumer behaviours,
we will use an advanced method of data mining by
using the association rule or market basket analysis in
the next step of this research.
Consumer Purchased Behavior using Data Mining: A Case Study of Coffee Shop Service Business
265
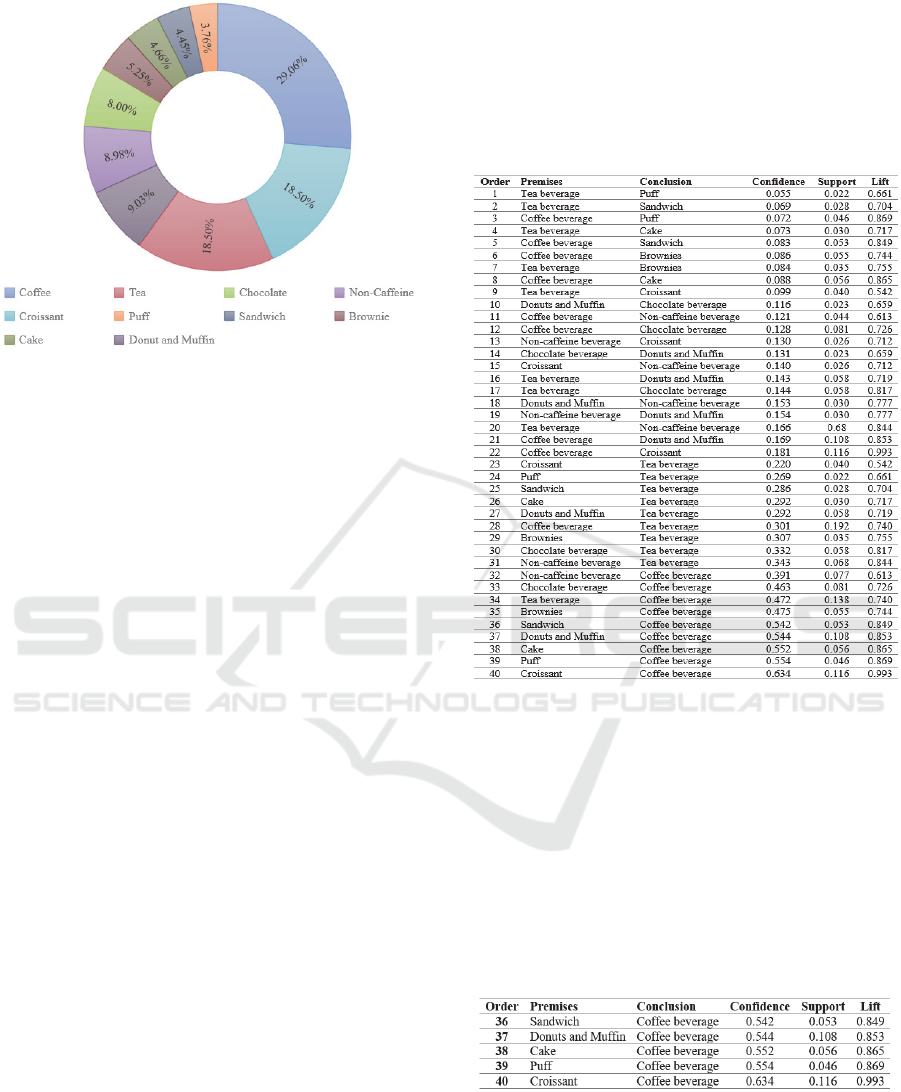
Figure 3: The frequency of 10 product categories
purchasing in a coffee shop.
4.2 The Relationships of Consumer
Purchasing on 10 Product
Categories by using the Association
Rule
The results from this analysis method were separated
into two parts of considers below:
4.2.1 The Study to Find out the Association
Rules of Consumer Purchasing
It was found that results from the association rule of
data mining from analyzing all 5,000 transactions
(5000 data records) were 40 association rules, which
were organized and shown in Figure 4. When
considering the association rule from 23rd order to
31st order in Figure 4. It was indicated that when the
first product category (Premises) was bought, then the
following purchased product categories (Conclusion)
must be a "tea beverage" category. And then, when
considering the association rule from 32nd order to
40th order, it was found that when the first product
category was bought, the following bought product
category must be a "coffee beverage" category. These
kinds of association rules were important association
rules because these results were relevant to the studies
of frequency purchasing products in a coffee shop
showing that tea and coffee beverages had got the
highest percentage of buying and were in the top 2
ranks from all 10 product categories.
In addition to the study of the relationship
between each product category, there were only 2
product categories per 1 association rule, and there
were not any three or up product categories per 1
association rule in this result. Then, there were some
exciting association rules from the results that could
be used for considering and creating the promotion
campaign in the future. The criteria screening values
to select which association were selected were the
confidence value, which should be more than 0.50 or
50%, the support value, which should be more than
0.05 or 5%, and the lift value should be more than
0.50 or 50%.
Figure 4: Showing orders of 40 association rules from 5,000
transactions of consumer purchasing.
4.2.2 The Study to Find out the Strong
Association Rules of Consumer
Purchasing
Selecting exciting association rules. From 3 criteria
screening values above (confidence, support, and
lift), There were only five selected association rules
passed the tests filtering values, which were 36th
order, 37th order, 38th order, 39th, and 40th order
shown in Figure 5.
Figure 5: Showing the selected orders of association rules
from buying 10 product categories.
The exciting association rules were concluded
into five states. The first rule explained in the 36th
order that if consumers purchased a "sandwich"
16th AFC 2019 - ASEAN Food Conference
266

category first, then there was a 54.2% possibility
(confidence = 0.542) that also they would buy a
"coffee beverage" category with 5.3% support value
(Support = 0.053). The second rule explains in the
37th order that if consumers purchased a "donuts and
muffins" category first, then there was a 54.4%
possibility that they would buy a "coffee beverage"
category with a 10.8% support value. The third rule
explained in the 38th order that if consumers
purchased a "cake" category first, there was 55.2%
possibility that they would buy a "coffee beverage"
category with a 5.3% support value. The fourth rule
explained in the 39th order that if consumers
purchased a "puff" category first, there was 55.4%
possibility that they would buy a "coffee beverage"
category with a 4.6% support value. The last rule
explained in the 40th order that if consumers
purchased a "croissant" category first, there was a
63.4% possibility that they would buy a "coffee
beverage" category with 11.6% support value. And
all five selected association rows were more than 8 %
lift values. Therefore, all five selected association
rules showed the unusual consumer purchasing
behaviors which could be applied to marketing
strategies for the promotion of a coffee shop in the
future.
5 CONCLUSIONS
After analyzing transaction data by using the
association rule, in conclusion, the results were
shown that on Saturday had the highest percentage of
the number of consumers who purchase 10 product
categories in a coffee shop. On the other hand, on
Monday had the least rate of the number of
consumers. For the time period, most consumers
bought the product in the afternoon from 12.00 pm -
15.59 pm, and it was shown that the least buying
amount was in the evening period from 16.00 pm -
20.00 pm. From the 5000 transaction data set in this
research, there were 40 association rules from the
analysis that had only two orders per 1 association
rule, and there did not find more than two orders up
per 1 association rule. The exciting and selected
association rules were only five rules, which the most
interesting one was "if consumers purchased a
"croissant" category first, there were 63.4%
possibility that they would buy a "coffee beverage"
category." This data mining method can be used to
create marketing strategies for promoting the coffee
shop for helping sales and profit increasing.
Moreover, it can be adjusted in order to work
smoothly with different types of management, which
will make the highest profit and achieve goals.
ACKNOWLEDGEMENTS
I would like to thank Asst.Prof.Dr. Kallayanee
Tengpongsathon, Faculty of Agro-Industry for her
time and thoughtful advice on this research. And the
last one, I would like to thank King Mongkut's
Institute of Technology Ladkrabang (KMITL) for all
of the supports.
REFERENCES
Eakasit, P. 2014. An Introduction to Data Mining
Techniques, Bangkok, Asia Digital Printing Co.,Ltd.
Eakasit, P. 2016. Introduction to Business Analytics with
RapidMiner Studio Version 6, Bangkok, Asia Digital
Printing Co.,Ltd.
Jeeranan, C. 2016. An Association inFood Ordering by
Data Mining Twchnique : A Case Study of Barn Fa
Prong Restaurant, Sakon Nakhon, Thailand.
Rajamangala Surin Conference. Surin.
Kanda, S. 2012. Behaviors of Consumers in Pathum Thani
towards Cafe Amazon Cafe. Master Degree,
Rajamangala University of Technology Thanyaburi.
Nidhi, M. K. & Snehil, D. 2018. Market Basket Analysis
using Apriori Algorithm. International Journal of
Trend in Scientific Research and Development
(IJTSRD), 2, 6.
Pandya, P. J. & Morena,. R. D. 2017. A Survey on
Association Rule Mining Algorithms Used in Different
Application Areas. International Journal of Advanced
Research in Computer Science, 8, 6.
Varee, S. 2018. Thai Coffee in the Future. In: BUSINESS,
Prachachat. retrieved august 7 , 2018 avaliable in
www.prachachat.net
Consumer Purchased Behavior using Data Mining: A Case Study of Coffee Shop Service Business
267
