
Correlation between Electrical Conductivity and Salt Content in
Tuna Meat
Petcharat Wiroonsri, Saowakon Wattanachant and Wirote Youravong
Department of Food Technology, Faculty of Agro-industry, Prince of Songkla University, Hatyai, Songkhla, Thailand
Keywords: Electrical Conductivity, Prediction Correlation, Salt Content, Skipjack Tuna.
Abstract: In tuna industry, salt content in tuna meat is necessary to be determined for quality control by traditional
method, in which some chemicals are expensive and not environmental friendly. Therefore, applications of
simple analytical methodologies that ensure quality are in demand. This research studied the ability of
electrical conductivity (EC) value to predict the salt content in a flesh of skipjack tuna meat compared with
the traditional method which used automatic titration. Tuna samples sampling from different sizes (all 8
sizes ranged from 0.10-0.99 to 6.10-9.00 kg) and three different sources were determined chemical
composition, salt content and EC value. Salt content and EC value varied depending on tuna size (P<0.05)
and sources (P<0.05). Prediction model was built with a total of 170 tuna samples. As per the result, the
Pearson correlation (r) showed the relationship of salt content and EC value as 0.92 with P<0.05. This result
indicated that EC value had a high correlation with salt content in flesh of tuna meat in a positive direction
with statistically significant (P<0.01). The coefficient of determination (R
2
) of the prediction model was
obtained at 0.85; the linear regression model had a good fit. Comparison of actual and predicted salt content
with paired samples t-test indicated that two variables had a high correlation with a positive direction
(r=0.91) with non-significant difference (P≥0.05). In conclusion, EC is really promising for application to
predict salt content in tuna meat.
1 INTRODUCTION
Skipjack tuna (Katsuwonus pelamis) is the species
most commonly used in canned tuna. Canned tuna
processing industries in Thailand has imported
frozen raw tuna approximately 90% of the total
(National Food Institute, 2016). Tuna freezing has
occurred aboard vessels after catching for preserves
the quality of fish. The preservation technique is
brine immersion freezing, which involves storing
fish in brine (water-saturated or nearly saturated
with salt, usually, sodium chloride) and reducing the
temperature of the brine until the fishes are frozen.
The main risk of this preservation method is the
penetration of salt into fish meat. A high
concentration of salt in tuna would affect the meat
quality and might reduce its commercial value. The
factors influencing salt penetration are the rise of
brine temperature, the concentration of brine, and
the storage duration. These parameters investigated
by tuna industries are controlled aboard vessels to
avoid any fish deterioration. Also, some biological
factors such as fish species, fish size, muscle type,
and muscle composition are affecting salt
penetration (Bodin et al., 2014).
The salt content in tuna is one of the tuna trade
requirements according to the guideline quality
standard for frozen raw tuna as recognized by all
members of the Thai Tuna Industry Association
(TTIA) (Thai Tuna Industry Association, 2016). The
quality control laboratory of the industry measures
the salt content of tuna by traditional method in
which the salt content is titrated using auto-titrator,
where sodium chloride is a calibration substance and
silver nitrate is a titrant, in which some chemicals
are expensive and not environmental friendly.
Therefore, applications of simple analytical
methodologies that ensure quality are in demand.
Electrical conductivity (EC) of any solution is
depended on the total ion concentration in the
solution. The EC is an ability of the material to pass
an electric current, which is carried by cations and
anions in the solution. A solution that contains many
ions (strong electrolyte solution), will conduct
electricity better than a low-ion solution (weak
electrolyte solution). Salts are ionic compounds
256
Wiroonsri, P., Wattanachant, S. and Youravong, W.
Correlation between Electrical Conductivity and Salt Content in Tuna Meat.
DOI: 10.5220/0009992100002964
In Proceedings of the 16th ASEAN Food Conference (16th AFC 2019) - Outlook and Opportunities of Food Technology and Culinary for Tourism Industry, pages 256-262
ISBN: 978-989-758-467-1
Copyright
c
2022 by SCITEPRESS – Science and Technology Publications, Lda. All rights reserved

which consist of positive sodium ions (Na
+
) and
negative chloride ions (Cl
-
). Previous research
reported that the EC of a NaCl salt solution
increased with increasing salt concentration
(Kaewthong et al., 2017). Kaewthong and
Wattanachant (2017) reported that the EC of breast
meat marinated with salt solutions was significantly
increased in correlation with increasing
concentration of the salt solution. Thus, It’s was
probable that EC value can be used to determine salt
content. Therefore, this work aimed to determine the
correlations between the EC and the salt content in
tuna meat. The feasibility of predicting the salt
content in tuna meat using EC was evaluated.
2 MATERIALS AND METHODS
2.1 Sampling
Tuna meat samples from skipjack tuna (Katsuwonus
pelamis) with the weight of 0.10 to 9.00 kg were
obtained from Chotiwat Manufacturing Co., Ltd.,
Thailand.
A total of 270 skipjack tuna samples (n=270)
was used in this study. The sample was divided into
3 sets; (1) 80 skipjack tuna samples were obtained
from Western Pacific for study of effect of size tuna
on proximate composition, salt content and EC of
the tuna meat samples, in this part, the tuna samples
were divided into 8 sizes, 10 tuna samples per sizes,
(2) 90 skipjack tuna samples were obtained from
three sources, Western Pacific, Western Pacific
(MSC) and Indian Ocean, for study of effect of
source of tuna on proximate composition, salt
content and EC of the tuna meat samples, In this
part, the 90 tuna samples were divided by source of
tuna by the following 30 tuna samples were obtained
from the Western Pacific which fishing during
December 2018, 30 tuna samples were obtained
from the Western Pacific which fishing during
October 2018 and carrying the blue MSC label and
30 tuna samples were obtained from the Indian
Ocean which fishing during September to November
2018. In each source, tuna samples were divided into
3 sizes, 10 tuna samples per size and (3) 100
skipjack tuna samples for verification of a prediction
equation.
A shoulder (Dorsal Loin) meat of frozen flesh
tuna was taken following the sampling procedure of
the guideline (figure 1A.). Each tuna meat sample
was kept in a tightly sealed plastic bag
(nylon/LLDPE) (figure 1C.) after that the sample
was thawed and blended with the blender
(Kenwood, CH500) for 1 minute. Then, the EC, pH,
proximate composition and salt content of the tuna
meat samples were determined.
Figure 1: Sampling position of tuna carcass.
2.2 Proximate Composition
Moisture, ash and lipid were determined by the
method of the AOAC (1999). Nitrogen was
determined by the Kjeldahl method. Protein was
then obtained by multiplying the nitrogen by a factor
of 6.25. The moisture content of each sample was
analyzed according to oven drying method (at 105°C
until it obtained a constant weight). The oven dried
samples were further used to determine the fat
content and protein content.
2.3 Electrical Conductivity
The EC of tuna meat was analyzed using an EC
meter (Mettler Toledo, SevenGo, Switzerland). The
EC of tuna ground meat was directly measured at the
tuna temperature range between 17.83±7.23℃
(adapted from Kaewthong and Wattanachant, 2017).
2.4 pH Value
The pH value of tuna meat was analyzed using a pH
meter (Mettler Toledo, SevenGo SG2-FK2,
Switzerland). The pH value of tuna ground meat was
directly measured.
2.5 Salt Content
The salt concentration of tuna meat was determined
by 2 methods using auto-titrator and manual titration
method. The salt content was determined in
duplicate for auto-titration method (Potentiometric
A
B
B
C
Correlation between Electrical Conductivity and Salt Content in Tuna Meat
257

Method) (Mettler Toledo, G20, Switzerland) and
triplicate for manual titration method (AOAC
official method 937.09) (AOAC, 2000).
2.6 Statistical Analysis
A completely randomized design (CRD) was applied
to determine the effect of size and source tuna on the
EC, pH, proximate composition and salt content of
the tuna meat samples. The coefficient of
determination (R
2
) between salt content and EC of
the tuna meat was determined by the linear
regression model. Furthermore, Pearson correlation
coefficients (r) between salt content and EC of the
tuna meat were generated by using the Pearson’s
Correlation Coefficient option of the SPSS computer
program. Pairwise t-tests were performed for
evaluating the differences in actual and predicted
salt content. Significant differences among the
results of different treatments’ means were analyzed
by Duncan’s multiple range tests using the SPSS
computer program (SPSS program, SPSS Inc.,
Chicago, IL).
3 RESULTS AND DISCUSSION
3.1 Effect of Size Tuna on Proximate
Composition, Salt Content and EC
of the Tuna Meat Samples
The effects of tuna size on the proximate
composition are shown in Table 1. It was found that
the size of tuna affected the chemical composition,
including moisture content, ash, fat and protein in
tuna meat (P<0.05). In general, moisture content of
tuna fish was reported in the range of 60 - 80%. The
amount of ash content was found in wide range
between 0.4 - 1.5%. The fat content was varied in
the range from 0.2 to 1%
and the protein content was
in the range of 16 - 25%. The amount of chemical
composition of the fish could varied according to the
species, nutritional status and growth stage of the
fish (Mahaliyana et al., 2015).
The results of the salt content in tuna meat, both
using the auto titration and the manual titration
method are shown in Table 2. It was found that the
salt content of tuna in different size was significantly
different (P<0.05). Balogun and Talabi (1985)
reported that salt was not a normal constituent of
marine fish species. The salt content of tuna related
to the absorption of salt into the tissue during brine
preservation on board rather than to changes in
oceanographic conditions of salinity (Balogun et al.,
1985). From the result, the amount of salt in tuna
tended to be inversely to the size of the fish. The fish
size is one of the factors influencing salt penetration
(Bodin et al., 2014). Small tunas are more sensitive
than large tunas. Small tunas are more sensitive to
salt penetration due to a larger surface area to
volume ratio. The amount of salt which analyzed by
manual titration method was higher than that using
auto-titrator at approximately 15% (average salt
content in tuna which analyzed by manual titration
method and using auto-titrator were 1.63 and 1.42,
respectively).
The manual method, the concentrated HNO
3
must be applied to hydrolyze the tuna meat during
boiling. The strong acidic environment gives
advantage for halide (such as chloride ion) analysis
(L. D. Michaud, 2016). The protons from nitric acid
can release the silver ions that adsorbed. This will
increase the silver ion interaction with chloride ion
result in more precipitates (Shing, 2014). However,
Table 1: Proximate composition (%) of the flesh from different size of skipjack tuna.
Size (kg)
Moisture
Ash
Fat
Protein
0.10-0.99
71.35 ± 0.27
c
2.91 ± 0.08
ef
1.16 ± 0.06
e
22.06 ± 0.19
a
1.00-1.40
71.22 ± 0.15
bc
2.51 ± 0.09
cd
2.03 ± 0.07
f
22.54 ± 0.55
a
1.41-1.80
70.41 ± 0.31
ab
2.68 ± 0.22
de
1.15 ± 0.06
e
22.73 ± 0.42
a
1.81-2.40
69.89 ± 0.54
a
3.00 ± 0.18
f
0.98 ± 0.06
d
23.79 ± 0.93
b
2.41-3.40
71.48 ± 0.13
c
2.31 ± 0.37
bc
0.41 ± 0.16
c
22.52 ± 0.01
a
3.41-4.50
70.81 ± 0.13
bc
2.11 ± 0.06
ab
0.32 ± 0.07
bc
23.73 ± 0.20
b
4.51-6.00
72.29 ± 0.17
d
1.80 ± 0.01
a
0.07 ± 0.01
a
24.05 ± 0.12
b
6.10-9.00
73.06 ± 0.80
e
1.96 ± 0.02
a
0.23 ± 0.01
b
22.54 ± 0.55
a
Sig.
0.00
0.00
0.00
0.00
Total Mean
71.38 ± 1.16
2.41 ± 0.44
0.81 ± 0.67
22.98 ± 0.80
a–f
Means ± SD, different small letters within the same column indicate a significant difference (P < 0.05).
8 treatments x 3 replication (n=24).
16th AFC 2019 - ASEAN Food Conference
258

Table 2: Electrical conductivity and salt content of the flesh of skipjack tuna.
Size (kg)
*Electrical conductivity
(mS/cm)
Salt content (%)
*By auto titration
**By manual titration
0.10-0.99
20.33 ± 4.65
bc
1.71 ± 0.62
b
2.03 ± 0.03
d
1.00-1.40
16.31 ± 1.79
ab
1.44 ± 0.26
ab
1.62 ± 0.05
c
1.41-1.80
18.28 ± 5.63
ab
1.56 ± 0.72
ab
1.73 ± 0.03
c
1.81-2.40
24.42 ± 8.93
c
1.74 ± 0.96
b
2.25 ± 0.08
e
2.41-3.40
15.82 ± 3.18
ab
1.44 ± 0.51
ab
1.93 ± 0.01
d
3.41-4.50
15.48 ± 1.62
a
1.32 ± 0.26
ab
1.36 ± 0.03
b
4.51-6.00
15.25 ± 2.64
a
1.02 ± 0.38
a
1.12 ± 0.17
a
6.10-9.00
15.46 ± 2.26
a
1.05 ± 0.47
a
1.14 ± 0.17
a
Sig.
0.00
0.05
0.00
Total Mean
17.38 ± 4.86
1.42 ± 0.60
1.63 ± 0.44
a–e
Means ± SD, different small letters within the same column indicate a significant difference (P<0.05), pH value as 5.71 ± 0.13.
*8 treatments x 10 replication (n=80) **8 treatments x 3 replication (n=24).
in auto-titration systems, chloride ions in sample are
directly titrated with silver nitrate without acidic
condition adjusted and then automatically control
endpoint detection. The titrator determines the
endpoint by directly measuring changes in mV
potential (Hanna Instruments, 2016) of chloride ion
in the system.
Electrical conductivity is an electrical property,
which is measured by the concentration and
movement of ions (Shi et al., 2014). It was found
that the electrical conductivity value of tuna in
different size was significantly different (P<0.05)
(Table 2).
3.2 Effect of Source of Tuna on
Proximate Composition, Salt
Content and EC of the Tuna Meat
Samples
The results of the composition analysis are shown in
Table 3. It was found that the source of tuna
influenced the chemical composition, including
moisture content, ash, fat and protein in tuna meat
(P<0.05). The environment and seasonal are some of
the factors which affect the chemical composition of
the fish (Mahaliyana et al., 2015).
The results of the salt content analysis, both
using the auto titration method and the manual
titration method of tuna sample are shown in Table
4. It was found that the salt content of tuna in
difference source was significantly different
(P<0.05). The salt content of tuna related to the brine
preservation on board
(Bodin et al., 2014). Different
sources, it is possible to have different rigidity of
controlled aboard vessels which affecting salt
penetration. The electrical conductivity value of tuna
in difference source was significantly different
(P<0.05) (Table 4).
The Pearson correlation (r) between the salt
content which analyzed by auto titration and
proximate composition on EC value are shown in Table
5. From the results, it was found that the salt content
and ash content of meat tuna have a high correlation
in positive direction with EC value (P<0.01). The
ash content is a measure of the total amount of
minerals present within a food, whereas the mineral
content is a measure of the amount of specific
inorganic components present within a food, such as
Ca, Na, K and Cl. The results were in agreement
with Kaewthong and Wattanachant (2017) who
found that the EC of salt solutions increased with
increasing concentration and the EC of salted meat
increased with increasing concentration of salt
solutions. The higher number of NaCl molecules
provides more ionic strength in the solution, leading
to a higher EC. The high mobility of the chloride ion
(Cl
−
) and sodium ion (Na
+
) also enhance the ability
of NaCl solutions to conduct electric current
(Kaewthong and Wattanachant, 2017).
Correlation between Electrical Conductivity and Salt Content in Tuna Meat
259

Table 3 : Proximate composition (%) of the flesh of skipjack tuna from different sources.
Source
Size
Moisture
Ash
Fat
Protein
WP
S
70.90 ± 0.07
ab
2.68 ± 0.08
f
0.22 ± 0.01
a
24.02 ± 0.65
bc
M
71.88 ± 0.19
c
2.37 ± 0.05
e
0.26 ± 0.03
a
24.51 ± 0.06
bc
L
70.58 ± 1.03
a
2.06 ± 0.09
cd
0.41 ± 0.00
b
25.60 ± 0.22
de
WP
(MSC)
S
70.80 ± 0.11
ab
2.44 ± 0.35
ef
1.47 ± 0.04
h
22.54 ± 0.70
a
M
71.78 ± 0.42
c
2.30 ± 0.17
de
1.21 ± 0.03
e
23.43 ± 0.66
ab
L
71.39 ± 0.16
bc
1.94 ± 0.07
c
1.28 ± 0.03
f
24.07 ± 0.37
bc
IO
S
71.83 ± 0.24
c
1.80 ± 0.18
bc
0.88 ± 0.03
c
24.23 ± 0.38
b
M
71.46 ± 0.33
bc
1.51 ± 0.05
a
1.36 ± 0.03
g
24.65 ± 0.06
cd
L
71.92 ± 0.11
c
1.56 ± 0.05
ab
0.97 ± 0.02
d
25.72 ± 0.29
e
Sig.
0.01
0.00
0.00
0.00
Total Mean
71.43 ± 0.61
2.07 ± 0.41
0.87 ± 0.46
24.31 ± 1.01
Sources of
skipjack tuna
WP
71.15 ± 0.84
x
2.37 ± 0.28
y
0.28 ± 0.08
x
24.71 ± 0.78
y
WP
(MSC)
71.73 ± 0.30
y
2.23 ± 0.30
y
1.30 ± 0.11
z
23.35 ± 0.83
x
IO
71.39 ± 0.51
xy
1.63 ± 0.17
x
1.03 ± 0.21
y
24.86 ± 0.72
y
Sig.
0.03
0.00
0.00
0.00
a–h, x–z
Means ± SD, different small letters within the same column indicate a significant difference (P<0.05).
WP: Western Pacific, IO: Indian Ocean and MSC: Tuna carrying the blue Marine Stewardship Council (MSC) label.
Size: S; the skipjack tuna with a weight of 1.4 to 1.8 kg, M; 1.8 to 2.4 kg and L; 4.51 – 6.0 kg. 9 treatments x 3 replication (n=27).
Table 4: Electrical conductivity and salt content of the flesh of skipjack tuna.
Sources of
tunas
Sizes of
tunas
*Electrical conductivity
(mS/cm)
Salt content (%)
*By auto titration
**By manual method
WP
S
18.75 ± 2.42
d
1.72 ± 0.30
e
2.44 ± 0.13
c
M
15.57 ± 1.68
c
1.42 ± 0.27
d
2.36 ± 0.06
c
L
12.02 ± 0.35
a
0.94 ± 0.17
c
1.41 ± 0.11
b
WP
(MSC)
S
18.23 ± 3.23
d
1.52 ± 0.52
de
2.38 ± 0.08
c
M
17.42 ± 1.75
d
1.40 ± 0.31
d
1.98 ± 0.11
c
L
13.80 ± 2.14
b
0.81 ± 0.25
bc
1.30 ± 0.56
b
IO
S
11.90 ± 1.71
a
0.60 ± 0.20
ab
0.67 ± 0.02
a
M
10.53 ± 0.82
a
0.43 ± 0.10
a
0.77 ± 0.05
a
L
10.77 ± 1.22
a
0.43 ± 0.14
a
0.81 ± 0.05
a
Sig.
Total Mean
0.01
0.00
0.00
14.34 ± 3.57
1.03 ± 0.54
1.57 ± 0.73
Sources of
skipjack tuna
WP
15.57 ± 3.19
z
1.38 ± 0.41
z
2.07 ± 0.52
z
WP
(MSC)
16.49 ± 3.08
z
1.24 ± 0.48
z
1.88 ± 0.55
z
IO
11.07 ± 1.39
y
0.49 ± 0.17
y
0.75 ± 0.07
y
Sig.
0.00
0.00
0.00
a–h, y–z
Means ± SD, different small letters within the same column indicate a significant difference (P<0.05). pH value as 5.71 ± 0.13.
WP: Western Pacific, IO: Indian Ocean and MSC: Tuna carrying the blue Marine Stewardship Council (MSC) label.
Size: S; the skipjack tuna with a weight of 1.4 to 1.8 kg, M; 1.8 to 2.4 kg and L; 4.51 – 6.0 kg.
*9 treatments x 10 replication (n=90) **9 treatments x 3 replication (n=27).
16th AFC 2019 - ASEAN Food Conference
260
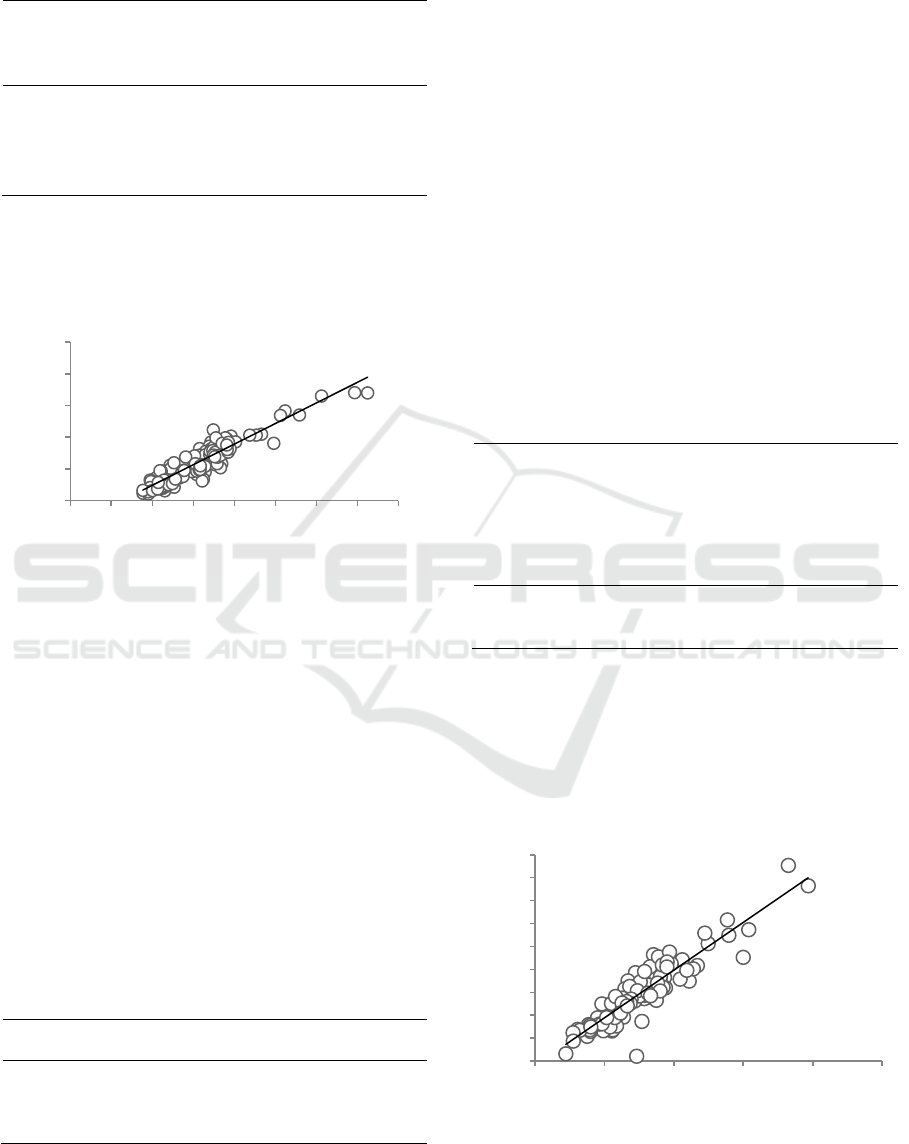
Table 5: The Pearson correlation (r) between salt content
and proximate composition on EC value in tuna meat.
Composition (%)
EC value
Pearson
Correlation
(r)
Sig. (2-
tailed)
Salt content
0.90
**
0.00
Moisture content
-0.46
0.07
Ash content
0.92
**
0.00
Fat content
0.07
0.78
Protein content
-0.59
*
0.01
**. Correlation is significant at the 0.01 level (2-tailed).
*. Correlation is significant at the 0.05 level (2-tailed).
3.3 Correlation between EC and Salt
Content of the Tuna Meat Samples
Figure 2: The regression equation for variables used in the
prediction of the salt content of the flesh of skipjack tuna.
The data (n=170) from the two of the previous part
were studied regression analysis.
The relationship between EC and salt content are
shown in Figure 2 which is provided the following
prediction equation:
Y = 0.1298X – 0.8129
(1)
which Y as salt content and X as EC value. The
R-Square value of the regression model is 0.85
which is high. The higher the R-square meant the
better the model fits. Thus the regression model
obtained a good fit.
Table 6: The Pearson correlation (r) between EC and the
salt content was analyzed by auto titration.
EC
Pearson correlation
Salt (auto titration)
0.92**
Sig. (2-tailed)
0.00
**. Correlation is significant at the 0.01 level (2-tailed).
The Pearson correlation (r) between the salt content
which analyzed by auto titration and EC as 0.923
which indicated the EC values of tuna meat had a
high correlation in a positive direction with salt
content (P<0.01) as shown in Table 6.
3.4 Verification of a Prediction
Equation
A total of 100 skipjack tuna samples were used to
verification of a prediction equation by substituting
EC value in the previous equation.
Then, the difference between actual and
predicted salt content was evaluated. The significant
level was obtained at 0.27 which was higher than
chosen significance level α=0.05. It could be
concluded that the average actual and predicted salt
content was non-significantly different (Table 7).
Table 7: Actual and predicted salt content of the flesh of
skipjack tuna.
n
Actual
Predicted
% Dev.
Correlation
(r)
Sig. (2-tailed)
10
0
1.52 ±
0.70
1.55 ± 0.61
1.92
0.91
0.27
ns
n; number of tuna sample,
ns
Non-significant
Figure 3 shows the accuracy of the predicted salt
content of Skipjack tuna which estimated by EC
value of the tuna sample. The R-Square value of the
model is 0.83 which indicated that the actual and
predicted salt content have a high correlation in
positive direction
Figure 3: Accuracy in predicted salt content of Skipjack
tuna by electrical conductivity.
y = 0.1298x - 0.8186
R² = 0.85
0
1
2
3
4
5
0 5 10 15 20 25 30 35 40
Salt content (%)
Electrical conductivity (mS/cm)
y = 1,042x - 0,1
R² = 0,8281
0
1
1
2
2
3
3
4
4
5
0 1 2 3 4 5
Actual salt content
Predicted salt content (%)
Correlation between Electrical Conductivity and Salt Content in Tuna Meat
261

4 CONCLUSIONS
The size of tuna affected the chemical composition,
including moisture content, ash, fat and protein in
tuna meat. The salt content of tuna in different size
was significantly different. Small tunas are more
sensitive than large tunas. It has to because small
tunas are more sensitive to salt penetration due to a
larger surface area to volume ratio. The electrical
conductivity value of tuna in different size was
significantly different.
The source of tuna affected the chemical
composition, including moisture content, ash, fat and
protein in tuna meat. The environment and seasonal
are some of the factors which affect the chemical
composition of the fish. The salt content and
electrical conductivity value of tuna from different
source was significantly different. The Pearson
correlation (r) between the salt content had a high
correlation in positive direction with EC value.
The high R-Square value of the regression model
was obtained at 0.85. The Pearson correlation (r)
between the salt content which analyzed by auto
titration and EC have a high correlation in a positive
direction with salt content. The averages actual and
predicted salt content was non-significantly
different. Therefore, it was a possibility to use the
EC value to predict salt content in tuna meat.
ACKNOWLEDGEMENTS
This research was supported by the Food Innovation
Research Institute, Prince of Songkla University of
Thailand (grant no. FIRIn 2560/015) and Chotiwat
Manufacturing Co., Ltd.
REFERENCES
AOAC. 1999. Official Methods of Analysis. 16
th
Ed.,
Association of Official Analytical Chemists,
Washington, DC
AOAC. 2000. Official Methods of Analysis. 17
th
Ed.,
Association of Official Analytical Chemists,
Washington, DC
Balogun, A. M. and Talabi, S. O. 1985. Proximate analysis
of the flesh and anatomical weight composition of
skipjack tuna (Katsuwonus pelamis). Food
chemistry. 17(2): 117-123.
Bodin, N., Lucas V., Dewals, P., Adeline M., Esparon, J.,
and Chassot E. 2014. Effect of brine immersion
freezing on the determination of ecological tracers in
fish. European Food Research and Technology. 238:
1057–1062.
Hanna Instruments. 2016. The Complete Guide to Salt in
Food (online). Available from:
https://blog.hannainst.com/determining-salt-in-food/
#3methods (25 August 2019)
Kaewthong, P., and Wattanachant, S. 2017. Optimizing
the electrical conductivity of marinade solution for
water-holding capacity of broiler breast meat. Poultry
science. 97: 701-708.
L. D. Michaud. 2016. Volhard's method (online).
Available from: https://www.911me-
tallurgist.com/blog/volhards-silver-determination-
argentometry (25 August 2019)
Mahaliyana, A. S., Jinadasa, B. K. K. K., Liyanage, N. P.
P., Jayasinghe, G. D. T. M. and Jayamanne, S. C.
2015. Nutritional al of Skipjack Tuna (Katsuwonus
pelamis) Caught from the Oceanic Waters around Sri
Lankae. American Journal of Food and Nutrition. 3(4):
106-111.
National Food Institute. 2016. Tuna industry (online).
Available from: http://fic.nfi.or-.th/
foodsectordatabank-detail.php?id=14 (10 November
2017)
Shi, C., Lu, H., Cui, J., Shen, H. and Luo, Y. 2014. Study
on the predictive models of the quality of silver carp
(Hypophthalmichthys molitrix) fillets stored under
variable temperature conditions. J. Food Process. Pres.
38: 356-363.
Shing, G, Y. 2014. Comparison of three methods used for
determining chloride in acid copper sulfate plating
bath. Master of Science. University of Malaya.
Thai Tuna Industry Association. 2016. Guideline quality
standard for frozen raw tuna (online). Available from:
http://www.thaituna.org/ho-me/guidelinequality-stan-
dard.php (25 August 2019)
16th AFC 2019 - ASEAN Food Conference
262
