
The Analysis of Monomeric Anthocyanin by pH Differential Method
Is Not Appropriate for Certain Anthocyanins
Abdullah Muzi Marpaung and Kevin Hanandi Tjahjadi
Food Technology Department, Swiss German University Tangerang, Banten, Indonesia
Keywords: Anthocyanins, Color Intensity, Flavylium Cation, Hemiketal, pH Differential.
Abstract: The light absorbance at pH 1 and 4 of 22 anthocyanin-source plant extracts was studied. Each one gram of
fresh sample macerated in 4 ml 0.1 N HCl-Ethanol 96% (1:9) for an hour, then diluted in buffer solution pH
1 and 4 with various dilution factor. The extract spectrophotometrically scanned at visible region (400 – 700
nm), then the λmax, color intensity, browning index (BI), and violet index (VI) determined. The λmax of
extracts were widely vary from 508 nm to 548 nm. Based on the BI the relatively high color quality at pH 4
exhibited by Clitoria ternatea (CT), Dendrobium sonia (DS), Ipomoea tricolor (IT), Dianella ensifolia (DE)
and Melastoma malabathricum (MM) extract. Based on the VI, CT and DE exhibited bluish-purple color at
pH 4, while DS was redish-purple, IT was purplish-red, and MM was red. Based on the light absorbance, the
extracts might be classified into three types. The A-type exhibited very low intensity of flavylium cation
(AH
+
) species at pH 4 because of the hydration to colorless hemiketal. The B-type had relatively high intensity
of AH
+
. The C-type showed the existence of purple and blue quinonoidal base species. The measurement of
monomeric anthocyanin by pH differential method is based on assumption that the anthocyanin colorless at
pH 4.5. Therefore, the method was not suitable for the B- and C-type anthocyanin-source plant extract.
1 INTRODUCTION
Anthocyanins are the largest water-soluble pigment
that produce various color like red, purple, and blue.
There are more than 900 types of anthocyanin found
in plants (Yoshida, et al., 2009). They also provide
beneficial health effects to the human body as an
antioxidant (Gradinaru, et al., 2003; Patras, et al.,
2010), antidiabetic (Belwal, et al., 2017), anticancer
(Patras, et al., 2010) and anti-inflammatory (Lee, et
al., 2017).
The anthocyanin content in a plant extract is
commonly determined spectrophotometrically as
monomeric anthocyanin by the pH-differential
method (Lee, et al., 2005). The analysis based on the
characteristics of monomeric anthocyanin that may
appear as six different species depend on the pH. At
pH 1, anthocyanin exists as the red flavylium cation
species (AH
+
). Meanwhile, at pH 4.5 the pigment
exists as the colorless hemiketal (B). Hence, the
difference in light absorbance represent the
concentration of the pigment. The polymeric form –
the product of anthocyanin degradation – is resistant
to color change with change of pH and appear as red
both in pH 1 and 4.5 and is not measured by the pH-
differential method.
As the part of our research to find the potential
source of anthocyanins for natural food colorant, we
evaluated the light absorbance of various plant extract
at pH 1 and 4. We found that several anthocyanins
show relatively high color intensity that make them
not suitable to be analyzed by the pH differential
method.
2 MATERIALS AND METHODS
2.1 Materials
Twenty-two samples of anthocyanin-source flowers
and fruits collected from various location in
Indonesia. Seventeen flowers included in this
research were Agapanthes umbellatus, Antirrhinum
majus, Bauhinia purpurea, Clitoria ternatea,
Chrysanthemum x morifolium, Dendrobium sonia,
Dianthus caryophyllus, Gladiolus hortunalus,
Hydrangea macrophilla, Ipomoea tricolor,
Kalanchoe blossfeldiana, Petunia integrifolia,
26
Marpaung, A. and Tjahjadi, K.
The Analysis of Monomeric Anthocyanin by pH Differential Method is not Appropriate for Certain Anthocyanins.
DOI: 10.5220/0009985400002964
In Proceedings of the 16th ASEAN Food Conference (16th AFC 2019) - Outlook and Opportunities of Food Technology and Culinary for Tourism Industry, pages 26-30
ISBN: 978-989-758-467-1
Copyright
c
2022 by SCITEPRESS – Science and Technology Publications, Lda. All rights reserved

Ruellia tuberosa, Sinningia speciose, Stachytarpheta
jamaicensis, Tibouchina semidecandra, and Torenia
fournieri. Five fruits included were Clidemia hirta,
Dianella ensifolia, Melastoma malabathricum,
Rhodomyrtus tomentosa, and Vitex pinata.
The hydrochloric acid, ethanol 96%, potassium
chloride, buffer solution pH 4 (citric acid-sodium
hydroxide-hydrogen chloride) were obtained from
Merck®. All reagents were analytical grade and used
without further purification. The buffer pH 1 made
from hydrochloric acid and potassium chloride.
2.2 Maceration and Extract
Preparation
One gram of fresh sample macerated in 4 ml 0.1 N
HCl-Ethanol 96% (1:9) for an hour. The suspension
was filtered through filter paper Whatman 40 (8 µM).
The extract was diluted with buffer solution pH 1 and
4 with various dilution factor (DF) (two to twenty)
depend on the initial intensity of the extract.
2.3 Light Absorbance
The light absorbance at visible region (400 nm - 700
nm) of all extracts was scanned by UV-Vis
spectrophotometer (T60 visible PG Instrument) to
determine the wavelength with maximum absorbance
(λ
max
), relative color intensity (RCI), browning index
(BI) and violet index (VI).
The CI was (A
λmax
– A
700
) x DF (Cisse, et al.,
2012). The RCI was the CI at pH 4 divided by the CI
at pH 1. The BI determined by (A
420
-A
700
)/ (A
λmax
-
A
700
) (Cisse, et al., 2012). The VI determined by
(A
580
-A
700
)/(A
520
-A
700
) (Cisse, et al., 2012). A
λmax
was
the absorbance at wavelength with maximum
absorbance, A
420
was absorbance at wavelength 420
nm, A
580
was the absorbance at 580 nm, A
520
was the
absorbance at 520 nm, A
700
was the absorbance at 700
nm for haze correction.
3 RESULTS AND DISCUSSION
3.1 λ
max
, Browning Index, and Violet
Index
All anthocyanin-source extracts showed red color at
pH 1 that represent the presence of flavylium cation
(AH
+
) species. The λ
max
varied from 508 nm to 548
nm. The shortest λ
max
exhibited by the
Chrysanthemum x morifolium (CM) extract, while the
longest λ
max
belonged to the Clitoria ternatea (CT)
extract (Table 1). The variation was affected by the
type of anthocyanin aglycon (Bueno, et al., 2012), the
number of glycosyl group, acylation and
copigmentation (Gauche, et al., 2010) and the
presence of metal complexation (Yoshida, et al.,
2009). The presence of acyl group tends to increase
the λ
max
. The CT extract, for instance, contains 9 types
of anthocyanin that have two to four acyl groups
(Kazuma, et al., 2003). The TS extract contains
anthocyanin with one acyl group (Lowry, 1976).
Meanwhile, the main anthocyanins in MM extract
have no acyl group (Aishah, et al., 2013). The λ
max
of
the extracts were 548, 534 and 514 nm, respectively.
Figure 1 depicted the chemical structure change
of simple anthocyanin as the change of pH (Trouillas,
et al., 2016). The red AH
+
in most anthocyanin-
source extract thermodynamically hydrated to
colorless B as the pH of solution increase to 4 to 5.
As the result, the color intensity of the extract is
dramatically decrease and the λ
max
disappear. Eight of
twenty-two extracts studied exhibited no λmax at pH
4 (Table 1). Six extracts had λ
max
that similar with the
λ
max
at pH 1. The hypsochromic shift (the shift of λ
max
toward a shorter wavelength) occurred in two
extracts. Meanwhile, the bathochromic shift (the shift
of λ
max
toward a longer wavelength) appeared in six
extracts. The wide bathochromic shift occurred in CT,
DS, and DE extracts: 24, 17, and 36 nm, respectively.
The wide shift indicated the kinetic deprotonation of
AH
+
to form purple quinonidal base A (Trouillas, et
al., 2016).
Browning index (BI) is a common parameter to
measure the color quality of an anthocyanin source
extract (Cisse, et al., 2012). The increase of browning
index indicates the decrease of desirable color (red,
purple or blue) and or the increase of undesirable pale
yellow color (A420) that contributed by the chalcone
species (Reyes & Cisneros-Zevallos, 2007). The
relatively small BI (< 0.5) exhibited by CT, DS, IT,
DE, and MM extracts. The smallest BI belonged to
CT extract.
The other common parameter to determine the
color quality of anthocyanin is violet index (VI) that
measure the ratio of intensity of purple color
(represented by the absorbance at 580 nm) to the
intensity of red color (represented by the absorbance
at 520 nm). Twenty extracts exhibited red color at pH
4, that represented by the relatively low VI (< 1). The
CT, DS, and DE had VI >1 and exhibited purple to
purple blue color.
The Analysis of Monomeric Anthocyanin by pH Differential Method is not Appropriate for Certain Anthocyanins
27

Table 1: The λ
max
of all anthocyanin-source extract studied at pH 1 and 4 and their color quality at pH 4.
Plant Code λ
max
(nm) Color quality at pH 4
pH 1 pH 4 RCI BI VI
Flower
Ag
apanthes umbellatus
A
U 536 536 0.96 0.91 0.56
A
ntirrhinum ma
j
us
A
M 530 537 0.85 0.63 0.51
Bauhinia purpurea B
P
522 522 0.22 1.19 0.59
Clitoria ternatea C
T
548 572 1.28 0.16 1.94
Chr
y
santhemum
x
mori
f
olium CM 508 - 0.41 1.76 0.48
Dendrobium sonia DS 526 543 0.89 0.42 1.12
Dianthus car
y
oph
y
llus D
C
525 - 0.18 1.67 0.38
Gladiolus hortunalus G
H
520 - 0.07 2.79 0.48
Hy
dran
g
ea macrophilla
H
M 525 525 0.15 1.55 0.47
I
pomoea tricolo
r
IT
536 539 0.71 0.28 0.49
K
alanchoe bloss
f
eldiana
K
B 520 - 0.50 2.36 0.42
Petunia inte
g
ri
f
olia P
I
531 - 0.43 1.77 0.58
Ruellia tuberosa RT1 526 - 0.11 2.03 0.60
Sinnin
g
ia speciose SS 520 - 0.07 2.54 0.42
Stach
y
tarpheta
j
amaicensis SJ 527 521 0.15 1.62 0.60
Tibouchina semidecandra TS 534 - 0.15 1.94 0.65
Torenia
f
ournieri TF 532 525 0.30 1.24 0.50
Fruit
Clidemia hirta C
H
521 526 0.14 0.67 0.35
Dianella ensi
f
olia DE 532 568 1.17 0.29 1.59
M
elastoma malabathricum
M
M 514 513 0.29 0.48 0.19
Rhodom
y
rtus tomentosa RT2 511 511 0.27 0.61 0.16
Vitex pinata V
P
516 517 0.35 0.79 0.41
3.2 Classification of
Anthocyanin-source Extract based
on the Light Absorption
The light absorption of the anthocyanin-source
extracts studied might classified into three types as
shown in Figure 2. The A-type represented the most
common anthocyanin that show very low color
intensity at pH 4 as the result of the conversion of red
AH
+
to B (Lee, et al., 2005). The pale red color in the
extract at pH 4 was the polymeric form of
anthocyanin that is resistant to color change because
of the pH change (Lee, et al., 2005).
At the B-type, the CI of the extracts at pH 4 was
slightly lower than the CI at pH 1. There were three
extracts include in this group: AU, AM, IT. The
retaining color of the three extracts at pH 4 were 96%,
85%, and 71%, respectively. Probably, the relatively
high intensity indicated that the hydration of AH
+
to
B was blocked because of the presence of
intramolecular copigmentation. The occurrence of
intramolecular copigmentation involving three acyl
groups and the anthocyanin chromophore in heavenly
blue anthocyanin of IT extract was already
determined (Yoshida, et al., 2009).
An interesting characteristic shown by the C-type
extracts (CT, DS, and DE). At pH 4, all extracts
exhibit two λ
peak
and one λ
shoulder
that represent all the
colored species of anthocyanin: red AH
+
, purple A,
and blue A
-
. This unique light absorption profile was
reported as the unique characteristic of anthocyanin
that has acyl group located at the ring B (Baublis, et
al., 1994). The presence of acyl group at the ring B of
anthocyanin was identified in CT and DE extract
(Yoshida, et al., 2009; Kazuma, et al., 2003).
The CI of CT and DE extract at pH 4 was higher
than at pH 1, while the relative CI of DS extract was
0.89. The higher intensity was possible because the
purple and blue species absorb light more intense than
16th AFC 2019 - ASEAN Food Conference
28
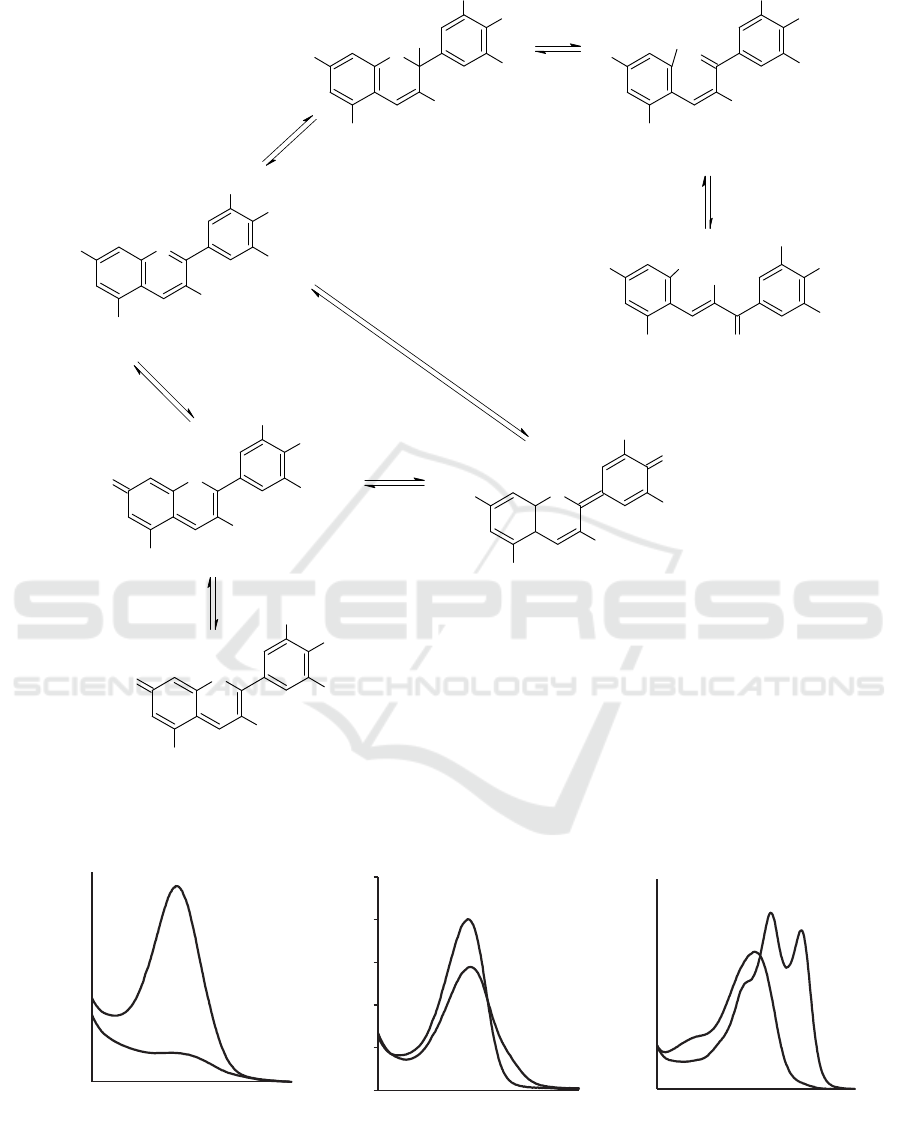
Figure 1: Chemical structures of six simple anthocyanins in aqueous solution (Trouillas, et al., 2016).
Figure. 2: Three different light absorption profile of 22 anthocyanin-source extract studied at pH 1 and 4. The A-type,
consisted of 16 sources, exhibit very low intensity at pH 4. The B-type, consisted of three sources, exhibit a slight lower
intensity at pH 4. The C-type, consisted of three sources, showed two λ
peak
and one λ
shoulder
. The color intensity at pH 4 was
higher than at pH 1.
O
+
OH
O-glu
OH
OH
OH
OH
Flavylium cation AH
+
O
OH
O-glu
OH
OH
R
R
OH
+ H
2
O
Hemiketal
B
OH
O-glu
OH
OH
R
R
OH
O
O
OH
O-glu
O
OH
R
R
O
OH
O-glu
OH
O
R
R
Quinonoidal bases
A
cis-Chalcone
Cc
trans-Chalcone Ct
OH
OH
OH
O-glu
O
R
OH
R
- H
+
- H
+
O
OH
O-glu
O
O
-
R
R
Anionic Quinonoidal bases
A
-
0.0
0.2
0.4
0.6
0.8
1.0
400 500 600 700
Absorbance (AU)
Wavelength (nm)
pH1
pH 4
A
0.0
0.2
0.4
0.6
0.8
1.0
400 500 600 700
Absorbance (AU)
Wavelength (nm)
C
pH1
pH 4
0.0
0.2
0.4
0.6
0.8
1.0
400 500 600 700
Absorbance (AU)
Wavelength (nm)
B
pH1
pH 4
The Analysis of Monomeric Anthocyanin by pH Differential Method is not Appropriate for Certain Anthocyanins
29

the red species (Yoshida, et al., 2009). 4, that
represented by the relatively low VI (< 1). The CT,
DS, and DE had VI >1 and exhibited purple to purple
blue color
3.3 Determination of Monomeric
Anthocyanin
The determination of monomeric anthocyanin by pH
differential method is a rapid method that widely
accepted to determine the anthocyanin content in a
plant extract or juice (Lee, et al., 2005). In the
method, an assumption made that the monomeric
anthocyanins exhibit little or no light absorbance at
pH 4.5. Meanwhile, the polymeric anthocyanins will
absorb at the pH.
As demonstrated in Figure 2, the A-type of
anthocyanin-source extracts we studied fit the
assumption. Hence, the monomeric anthocyanin
might appropriately be determined. However, the B-
type and C-type exhibit relatively high light
absorption at pH 4 that probably because they contain
polyacylated anthocyanins. Consequently, the use of
pH differential method to determine the monomeric
anthocyanin content in B-type and C-type
anthocyanin-source extract was not suitable.
4 CONCLUSIONS
The twenty-two anthocyanin-source plant extract
exhibit different light absorption at pH 4 that can be
classified into three types. The A-type exhibited very
low light absorption of flavylium cation (AH
+
)
species, the B-type showed relatively high intensity
of AH
+
, while in the C-type the significant amount of
purple quinonoidal base (A) and blue anionic
quinonoidal base (A
-
) observed. Therefore, the use of
pH differential method to determine the monomeric
anthocyanin content was not appropriate to be applied
to B- and C-type of anthocyanin source extract.
The spectrophotometric scan at visible light
region, both at pH 1 and 4, of an unidentified
anthocyanin-source plant extract is suggested before
the examination of pH differential method.
REFERENCES
Aishah, B. et al., 2013. Anthocyanins from Hibiscus
sabdariffa
, Melastoma malabathricum and Ipomoea
batatas
and its color properties. International Food
Research Journal
, 20(2): 827-834.
Baublis, A., Spomer, A. & Berber-Jimenez, M., 1994.
Anthocyanin pigments: comparison of extract stability.
Journal of Food Science, 59: 1219-1221.
Belwal, T., Nabavi, S. F., Nabavi, S. M. & Habtemariam,
S., 2017. Dietary Anthocyanins and Insulin Resistance:
When Food Becomes a Medicine.
Nutrients, 9(10):
1111.
Bueno, J. M. et al., 2012. Analysis and Antioxidant
Capacity of Anthocyanin Pigments. Part II: Chemical
Structure, Color, and Intake of Anthocyanins.
Critical
Reviews in Analytical Chemistry
, 42: 126–151.
Cisse, M. et al., 2012. Impact of the extraction procedure
on the kinetics of anthocyanin and colour degradation
of roselle extracts during storage.
Journal of the Science
of Food Agriculture
, 92: 1214–1221.
Gauche, C., da Silva, M. E. & Luiz, M., 2010. Effect of pH
on the copigmentation of anthocyanins from Cabernet
Sauvignon grape extracts with organic acids.
Scientia
Agricola (Piracicaba, Braz.
), 67(1): 41-46.
Gradinaru, G. et al., 2003. Thermal stability of
Hibiscus
sabdariffa
L. anthocyanins in solution and in solid state:
effects of copigmentation and glass transition.
Food
Chemistry
, 83: 423–436.
Kazuma, K., Noda, N. & Suzuki, M., 2003. Flavonoid
composition related to petal color in different lines of
Clitoria ternatea. Phytochemistry, 64: 1133–1139.
Lee, J., Durst, R. W. & Wrolstad, R., 2005. Determination
of Total Monomeric Anthocyanin Pigment Contentof
Fruit Juices, Beverages, Natural Colorants, and Wines
by the pH Differential Method: Collaborative Study.
Journal of AOAC International, 88(5): 1269-1278.
Lee, Y.-M.et al., 2017. Dietary Anthocyanins against
Obesity and Inflammation. Nutrients, 9(10): 1089.
Lowry, J., 1976. Anthocyanins of the Melastomataceae,
Myrtaceae and some allied families.
Phytochemistry,
15: 513-516.
Patras, A., Brunton, N., O'Donnell, C. & Tiwari, B., 2010.
Effect of thermal processing on anthocyanin stability in
foods; mechanisms and kinetics of degradation.
Trends
in Food Science & Technology
, 21(1): 3–11.
Reyes, L. & Cisneros-Zevallos, L., 2007. Degradation
kinetics and colour of anthocyanins in aqueous extracts
of purple- and red-flesh potatoes (
Solanum tuberosum
L.).
Food Chemistry, 100: 885-894.
Trouillas, P. et al., 2016. Stabilizing and modulating color
by copigmentation: insights from theory and
experiment.
Chemical Review, 116: 4937–4982.
Yoshida, K., Mori, M. & Kondo, T., 2009. Blue flower
colour development by anthocyanins: from chemical
structure to cell physiology.
Natural Product Reports,
26: 884–915.
16th AFC 2019 - ASEAN Food Conference
30
