
Physical Properties and Sensory Acceptability of Spent Coffee
Ground as a Food Ingredient in Edible Cups
Punya-in Sutthida
*
, Rongngam Keetakawee, Wongsuwan Thiti
and Manosan Busba
Agro Industry Department, Science and Agricultural Technology Faculty,
Rajamangala University of Technology Lanna Nan, 59 M .13 Fai Keao, Nan, Thailand
Keywords: Physical Properties, Sensory Acceptability, Edible Cups and Spent Coffee Grounds.
Abstract: This study aims to develop the optimal formula for spent coffee ground edible cups. The results indicated that
the second formula which consist of wheat flour 55.42%, butter 16.90%, ground brown sugar 14.91 %, eggs
(white and yolk) 11.92%, salt 0.60% and spent coffee ground 0.25% is the optimal ratio. The average size of
the produced spent coffee ground edible cup was present are the as 67.42±1.69, 65.11±2.46,
66.72±0.72 and 57.27±3.27 mm. of outside height, internal height, outside diameter and internal diameter of
the cup, respectively. The color parameter L*, a* and b* represented as 37.67±1.08, 7.20±0.37
and 27.63±0.63. The water activities value of products is about 0.78. The sensory evaluation was used 9
points hedonic scales by 30 examiners. The sensory score of formula 2 was demonstrated that shape, color,
aroma, flavor, texture, and overall acceptability were 7.00±1.41, 6.53±0.94, 6.20±1.38, 6.63±1.13,
6.40±1.25 and 7.03±1.13, respectively.
1 INTRODUCTION
Coffee is the most importance of food commodity.
The coffee brew and coffee beverage are important in
the economic, which are prepared from roasted coffee
bean and ground coffee. There are several health
functional components in the coffee brew for
example, caffeine, chlorogenic acid and caffeic acid.
They might cause an environmental problem (Patricia
and Victor, 2012). There are about 6 million ton of
spent coffee ground from the coffee industry annually
(Solange et al., 2011, Nuria et al., 2017 and Lina et
al., 2014). Several studies of using spent coffee
ground such as apply in cosmetic, fertilizer and
pesticide, etc. However, spent coffee ground are a
source of health benefit compounds (Rocio et al
2015).
This day, the edible packaging is useful to
conventional packaging to reduce waste and to create
a novel application. The aim of this study was to use
of spent coffee ground as the food ingredient in
innovative cups, while contributing an acceptance
product quality.
*
Corresponding author email.
2 MATERIALS AND METHODS
2.1 Spent Coffee Grounds Preparation
Spent coffee ground (SCG) were obtained from the
Rabbit coffee cafe, Nan, Thailand. The raw material
with 80% humidity approximately was dried at
70±2oC until constant weight (about 5%moisture
content). The dried SCG was stored for edible cups
processing and product quality testing.
2.2 Edible Cups Processing
The weight of ingredient of each formula were shown
in Table1. Initially, flour and SCG were sifted to
separate the impurity and make them to a smaller
particle. Salt was added into the melt butter and
stirred at room temperature until homogenous. After
that, the ground brown sugar was mixed with eggs at
room temperature until uniformly. Then, melt butter
with salt was added into the liquid mixture (the
mixture of butter, brown sugar, egg and salt). Flour
was divided into three parts. Subsequently, each part
was added little by little and mixed until homogenous.
Sutthida, P., Keetakawee, R., Thiti, W. and Busba, M.
Physical Properties and Sensory Acceptability of Spent Coffee Ground as a Food Ingredient in Edible Cups.
DOI: 10.5220/0009982200002964
In Proceedings of the 16th ASEAN Food Conference (16th AFC 2019) - Outlook and Opportunities of Food Technology and Culinary for Tourism Industry, pages 15-18
ISBN: 978-989-758-467-1
Copyright
c
2022 by SCITEPRESS – Science and Technology Publications, Lda. All rights reserved
15
Finally, the mixtures of the SCG edible cup were
baked at 120-130
o
C for 1 hour and 45 min in the
bakery oven.
2.3 Edible Cup Formulations
The formulas of SCG edible cup were illustrated in
Table1. The SCG edible cups were prepared using as
basic ingredients wheat flour, butter, brown sugar.
SCG was supplemented as coloring and flavor agents.
The amount of SCG added to edible cups between 0-
15% in order to achieve the most consumer
acceptance.
2.4 Physical Analysis
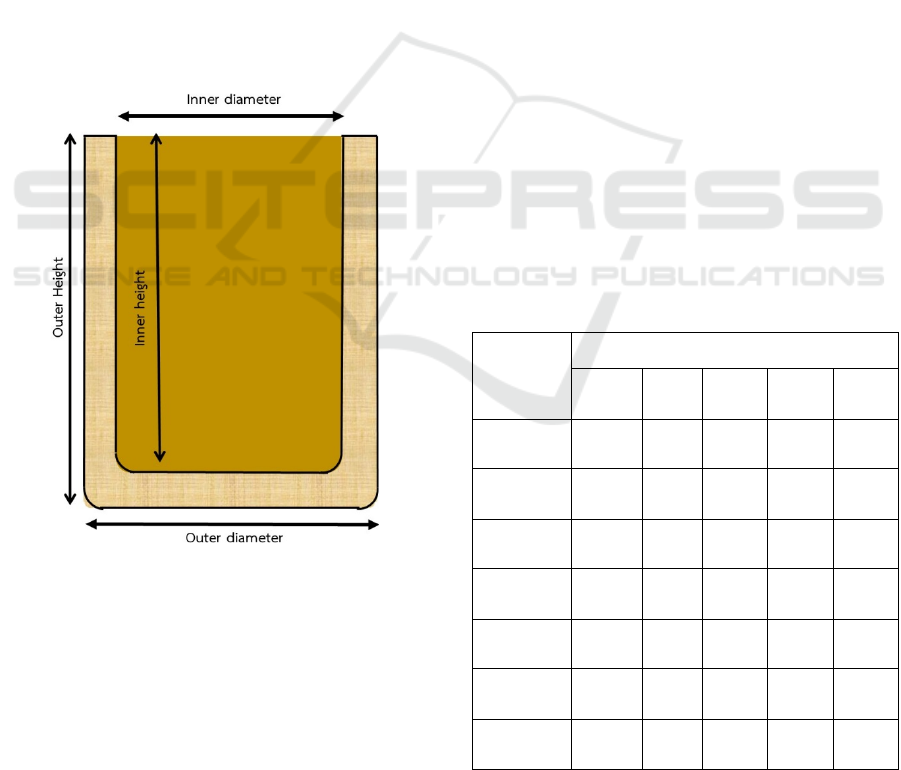
2.4.1 Size Measuring
Size of edible cups was measure for consistency
processing. The size was quantified by outer height,
inner height, outer diameter and inner diameter. Size
data are represented in the figure 1.
Figure 1: Cross section of the SCG edible cup.
2.4.2 Color Analysis
The color of SCG edible cups was determined by CIE
color scale L*, a* and b* using a Lab digital
colorimeter (Model CR-10, Minolta, Japan). Color
values were recorded as L*= Lightness (0=black,
100= white); a* (-a*= greenness, +a*=redness); b* (-
b*= blueness, +b*=yellowness).
2.4.3 Water Activity (a
w
) Analysis
It was measured in a water activity system at 25
o
C.
The calibration was carried out as indicated by the
manufacturer. Water activity (a
w
) was as certain by
the chilled mirror technique using an Aqua lab (C3
TE, USA).
2.4.4 Sensory Evaluation
Sensory evaluation of SCG edible cups (SEC1, SEC2,
SEC3, SEC4 and SEC5) was carried out applying a
hedonic sensory test. Sensory evaluation was
performed in the same session involving in total 30
untrained panelists. Shape, color, aroma, flavor,
texture and overall acceptance of the selected SCG
edible cup were observed. The results of rhetorical
scale test were converted into a 9-point scale scoring
1 (lowest) – 9 (highest) and the average of the
panelists' score was calculated.
2.4.5 Statistical Analysis
The data were expressed as the mean value ± standard
deviation (SD). Analysis of variance (ANOVA) and
Duncan’s post hoc test was applied to establish
differences between means. The differences were
examined to be significant at p<0.05. IBM SPSS
version 17.0 was used for data processing. The
physical properties data was using a completely
randomized design (CRD).
Table 1: SCG edible cups formulations.
Ingredients
(g)
Treatments
SEC 1
SEC
2
SEC 3 SEC 4 SEC 5
Wheat flour 55.67 55.42 55.17 54.42 54.17
Butter 16.90 16.90 16.90 16.90 16.90
Brown
sugar
14.91 14.91 14.91 14.91 14.91
Egg 11.92 11.92 11.92 11.92 11.92
Salt 0.60 0.60 0.60 0.60 0.60
SCG 0 0.25 0.5 1.25 1.50
Total 100 100 100 100 100
16th AFC 2019 - ASEAN Food Conference
16
3 RESULTS AND DISCUSSION
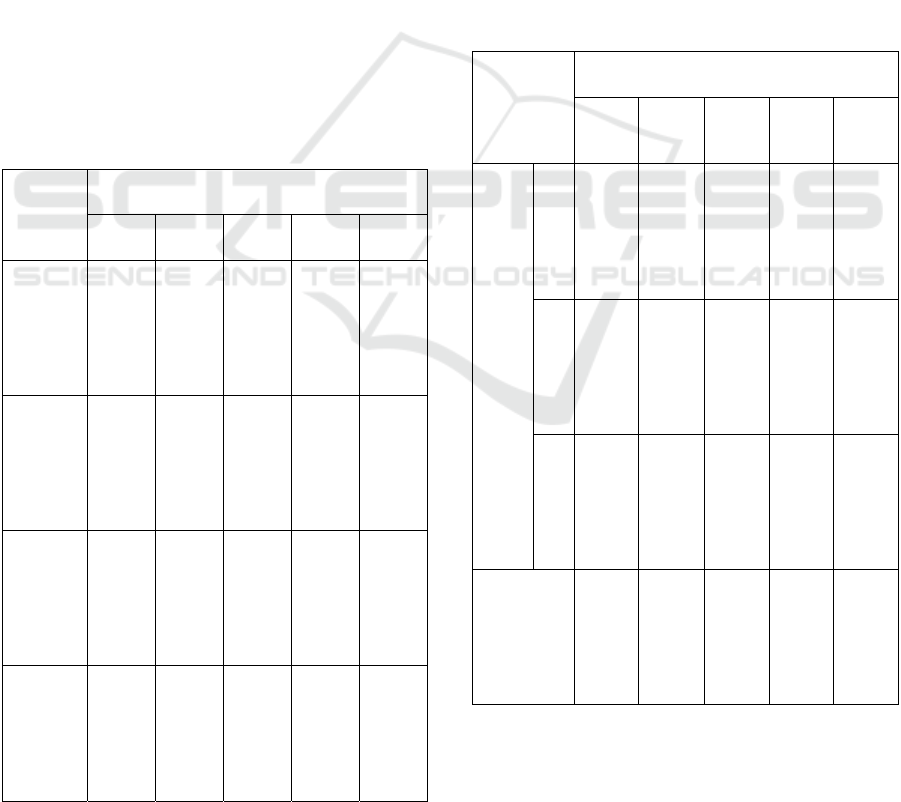
3.1 The SCG Edible Cups Size
The size of the cups is represented in table 2. All the
formulas, size was consistency. As a result, the outer
height was in rage 67.29 to 69 mm. The inner height
was present from 62.37 to 65.11 mm. Moreover, the
outer diameter and the inner diameter were in
between 66.40 to 68.13 mm. and 57.27 to 58.94
respectively.
3.2 The Color of SCG Edible Cups
Physiochemical properties are illustrated in table 3.
The lightness (*L) lowest is formula 4 and 5, which
evidence the more darkness of these products.
However, the (*a) values were in between 2.69 to
8.53 in formula 5 and 1 respectively. These represent
more SCG therefore, redder products. The (*b) values
were low in formula 4 and 5 as 21.79 and 21.83
respectively, which represent more yellowish in the
more SCG in products.
Table 2: Size of SCG edible cups (mm.)
Treatments
SEC 1 SEC 2 SEC 3 SEC 4 SEC 5
Outer
height
67.29
±
1.51
67.42
±
1.69
69.33
±
1.22
68.89
±
1.29
69.00
±
1.46
Inner
height
62.85
±
2.49
62.37
±
2.62
65.11
±
2.46
64.75
±
1.53
62.71
±
3.24
Outer
diameter
66.71
±
1.63
66.72
±
0.72
66.40
±
1.43
66.49
±
0.48
68.13
±
1.74
Inner
diameter
58.94
±
2.12
57.27
±
3.27
57.38
±
0.63
57.45
±
0.76
58.34
±
2.02
Results are expressed as mean (n=3)
3.3 Water Activity (a
w
) of the SCG
Edible Cups
Water activity (a
w
) content ranging from 0.68 to 0.78.
Therefore, these might spoil from the microorganism.
3.4 Sensory Evaluation of the SCG
Edible Cups
Shape, color, aroma, flavor, texture and overall liking
were evaluated as present in table 4. All properties
were given a score higher than six. As a result, the
shape of the formula 2 present the highest points. The
color of formula 1 indicated the highest. The aroma,
flavor, texture and overall acceptance were present no
significant outcome. However, formula 2 illustrates
the highest point.
Table 3: Physical characterization: color value, water
activity (a
w
).
Treatments
SEC
1
SEC
2
SEC
3
SEC
4
SEC
5
color
value
L*
39.45
±
2.50
a
37.67
±
1.0.8
b
35.46
±
0.86
c
33.13
±
0.87
d
32.44
±
0.65
d
a*
8.53
±
0.45
a
7.20
±
0.37
b
4.97
±
0.40
c
3.06
±
041
d
2.69
±
0.39
c
b*
29.41
±
1.07
a
27.63
±
0.63
b
24.73
±
0.99
c
21.79
±
0.70
d
21.83
±
0.72
d
water
activity
(a
w
)
0.77
±
0.02
a
0.78
±
0.02
a
0.75
±
0.01
a
0.77
±
0.08
a
0.68
±
0.07
b
Data are present as mean ± standard deviation (n=3).
Different letters indicate significant differences (p<0.05)
between the samples of the same column.
Physical Properties and Sensory Acceptability of Spent Coffee Ground as a Food Ingredient in Edible Cups
17
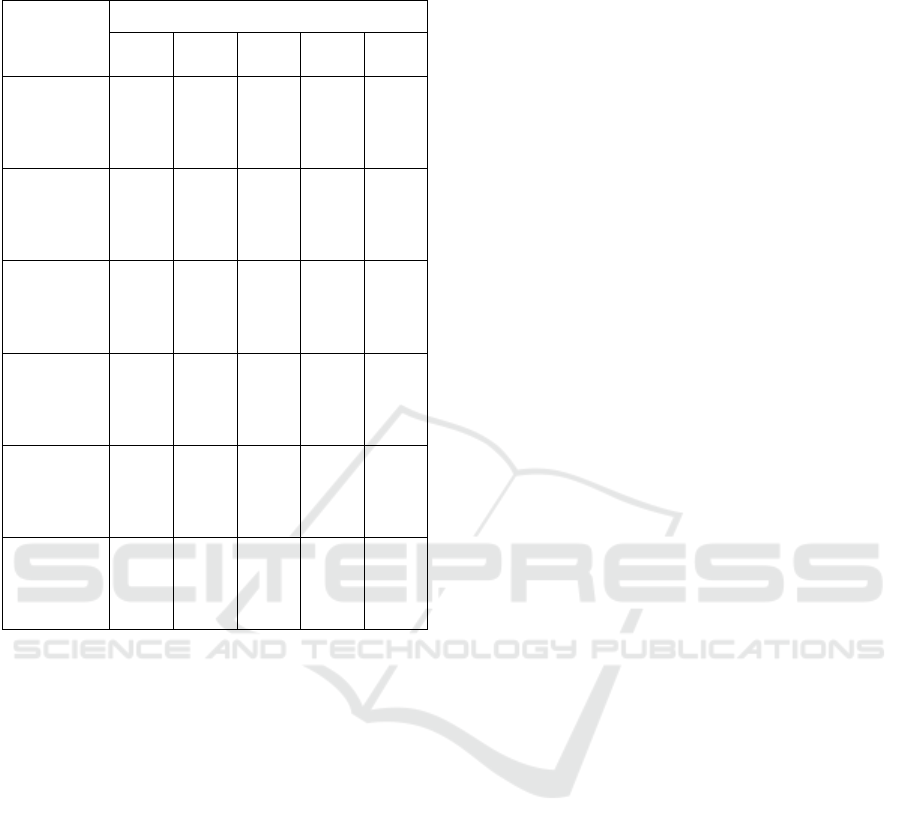
Table 4: Sensory evaluation (1-9 scale) of different SCG
edible cup.
Treatments
SEC1 SEC2 SEC3 SEC4 SEC5
Shape
6.93
±
1.36
b
7.00
±
1.41
a
6.13
±
1.66
b
6.53
±
1.63
ab
6.70
±
1.49
ab
Color
6.87
±
1.35
a
6.53
±
0.94
ab
6.10
±
1.19
ab
6.40
±
1.71
ab
6.03
±
1.83
ab
Aroma
ns
6.13
±
1.43
6.20
±
1.38
6.17
±
1.32
6.43
±
1.33
6.20
±
1.42
Flavor
ns
6.17
±
1.42
6.63
±
1.12
6.43
±
1.43
6.83
±
1.46
6.53
±
1.85
Texture
ns
6.10
±
1.62
6.40
±
1.25
6.13
±
1.46
6.43
±
1.43
6.17
±
1.82
overall
accepatnce
ns
6.67
±
1.09
7.03
±
1.13
6.73
±
1.23
6.80
±
1.32
6.77
±
1.71
Data are present as mean ± standard deviation (n=30).
Different letters indicate significant differences (p<0.05)
between the samples of the same column. The ns indicated
non-significant data.
4 CONCLUSIONS
This study has demonstrated the potential of using
SCG to apply the edible cup. The most proper
formula of SCG edible cup is formula 2. Due to the
highest sensory score such as shape, color, aroma,
flovor, texture and overall acceptance. There are also
the appropriate of water activity value and color
value. This may present a value-added
opportunity
for SCG which is coffee by-products.
ACKNOWLEDGEMENTS
The authors gratefully acknowledge financial support
from the Rajamangala University of Technology
Lanna, via the otop mentor project. In addition, we
also thank for the rabbit café and the Thanamol
Limited partnership for SCG supply.
REFERENCES
Inkum, R, Namkane, K, Ramsiri, P & Punya-in, S, (2018)
“Chemical Attractant to Trap Bactrocera latifrons
(Diptera: Tephritidae) in Chilli Field” Journal of
Advanced Agricultural Technologies [online] 5(4),
298-301. Available from http://www.joaat.com/
uploadfile/2018/1218/20181218103028979.pdf
[Accessed 8th March 2019]
Lina, F.B., Jose, A.T. and Solange, I.M., 2014. Chemical,
Functional, and Structural Properties of Spent Coffee
Grounds and Coffee Silver skin. FOOD BIOPROCESS
TECH. 7(2014). 3493-3503. https://link.springer.com/
article/10.1007/s11947-014-1349-z. Accessed March
18, 2019
Nuria, M., Alba, T.G., Ines, D.P., Miguel, R., Marta, M.,
Francisco, J.M., Maria, A.M. and Maria, D.C., 2017.
Use of spent coffee grounds as food ingredient in
bakery products. FOOD CHEM. 216(2017). 114-122.
https://www.sciencedirect.com/science/article/pii/S030
8814616312067. Accessed March 16, 2019
Patricia, E. and Victor M.J., 2012. Functional properties of
coffee and coffee by-product. FOOD RES INT.46 (2012).
488-495. https://www.sciencedirect.com/science/article/
pii/S0963996911003449. Accessed March 14, 2019
Punyain., S. 2014. Effects of Postharvest Processing on the
Bioactive Compounds in Arabica Coffee. Doctor of
Philosophy Thesis, The University of New South
Wales. Australia.
Punya-in, S, Koonsena, N & Kanauey, S, (2015)
“Comparison of physical properties and Sensory
evaluation of Suan Ya Luang coffee with other brands”
The 6th Rajamangala University of Technology
International Conference 2015, 1st-3rd September,
2015, Rajamangala University of Technology Isan,
Nakhonratchasima, Thailand
. (Poster presentation).
Punya-in, S, Sitichai, R & Seantui, B, (2017) “Study on
Optimization of Drying Temperature of Sterculia
Monosperma, ventenat Flour” The 8th Rajamangala
University of Technology International Conference
2017, 7th-9th August, 2017, Bangkok, Thailand (Poster
presentation).
Rocio, C.V., Guadalupe, L., Hayde A.V. and Dave, O.,
2015. Spent coffee grounds: A review on current
research and future prospects. TRENDS FOOD SCI
TECH. 45(2015). 24-36. https://www.sciencedirect.
com/science/article/pii/S0924224415001193.
Accessed March 18, 2019
Solange, I.M., Livia M.C., Joao P.A.S., Ines C.R. and Jose
A.T., 2011. A study on chemical constituents and
sugars extraction from spent coffee grounds.
CARBOHYD POLYM. 83(2011). 368-374.
https://www.sciencedirect.com/science/article/pii/S014
4861710006119. Accessed March 16, 2019
16th AFC 2019 - ASEAN Food Conference
18
