
Extraction Optimization of Total Phenolic Content and
Antioxidant Activity from Teaw (Cratoxylum Formosum)
by Central Composite Design
Nuttakarn Somarrom and Varipat Areekul
Faculty of Agro-industry, King Mongkut's Institute of Technology Ladkrabang, Bangkok, Thailand
Keywords: Antioxidants, Central Composite Design, Extraction, Optimization, Teaw, Total Phenolic Content.
Abstract: The extraction of bioactive compounds from Teaw (Cratoxylum formosum (Jack) Dyer) was carried out based
on the central composite design and response surface methodology to optimize the three variables: solvent
polarity index (5.5-9.0), temperature (50-70°C) and extraction time (35-55 min). The optimization condition
was based on yield, total phenolic content (TPC), DPPH radical scavenging (DPPH), ABTS radical
scavenging (ABTS) and thiobarbituric acid reactive substances (TBARs) assay. From five variables, only two
responses (yield and TPC) were fitted to a quadratic equation with R-square of 0.8479 and 0.8891,
respectively. DPPH response was not quite fitted (R
2
= 0.4420) while ABTS and TBARs were insignificantly
fitted (p>0.05). The optimal extraction condition was obtained with a solvent polarity index of 8.64 at 70°C
for 55 min. The software predicted under these optimal conditions that yield was 28.58% whereas the TPC
and DPPH, were 289 and 402 mg/g dry sample, respectively. The desirability value was 0.933. The proposed
method proves to be simple, cheap and good for natural bioactive extraction from Teaw, being a potential
approach for natural antioxidants.
1 INTRODUCTION
Plants has recently been focused as good sources of
phytochemicals with strong antioxidant activity. The
major responsible compounds are phenolic
compounds which are abundantly contained in
vegetable, fruits, berries, tea leaves, and herbs
(Altermimi et al., 2017). A phenolic hydroxy group
in the phenolic structure can donate a hydrogen atom
to interrupt the propagation of free radical in
oxidation processes (Altermimi et al., 2017;
Kaur and
Kapool, 2002). Therefore, the antioxidant can inhibit
or delay the oxidation of molecules. From its activity,
it can reduce the oxidative damage in foods ultimately
increasing the shelf-life and quality of these foods
(Lattanzio, 2013). It is a role not only for food
preservation, but also for the defense of living
systems and environmental stresses such as high
light, low temperatures, pathogen infection,
herbivores, and nutrient deficiency. These stresses
can lead to increase production of free radicals and
other oxidative species in plants (Altermimi et al.,
2017).
Teaw (Cratoxylum formosum) is a native plant
mostly grown in the North and North-Easts of
Thailand and tolerates drought well. This plant is
typically consumed as fresh shoots and young leaves.
It tastes sour and slightly astringent due to phenolic
components (Nakahara et al., 2002). It also found that
plant have been reported as a medicinal plant. Fresh
shoot and young leaves are used as a laxative. Root
and leaves help a stomachache and skin disease
(Areekul et al., 2009). The extract of Teaw
(C.formosum) leaves showed strongly antioxidant
and antimutagenic properties when compared with
108 species of indigenous Thai plants (Nakahara et
al., 2002).The 80% methanol plant extract effectively
scavenged DPPH radicals and contained many total
polyphenol and flavonoids
(Maisuthisakul et al., 2007).
The different extraction conditions including
solvent, time and temperature affected on the yield of
total phenolic and antioxidant activity due to different
properties of each bioactive compound, a
biomolecule from plants are chosen based on the
polarity of the solute of interest. A solvent of similar
polarity to the solute will properly dissolve the solute
(Altermimi et al., 2017). In this situation, the many
Somarrom, N. and Areekul, V.
Extraction Optimization of Total Phenolic Content and Antioxidant Activity from Teaw (Cratoxylum formosum) by Central Composite Design.
DOI: 10.5220/0009980700002964
In Proceedings of the 16th ASEAN Food Conference (16th AFC 2019) - Outlook and Opportunities of Food Technology and Culinary for Tourism Industry, pages 119-125
ISBN: 978-989-758-467-1
Copyright
c
2022 by SCITEPRESS – Science and Technology Publications, Lda. All rights reserved
119

variables influenced the response. The response
surface methodology (RSM) based on the central
composite design (CCD) is an effective technique for
optimizing the extraction with the various factors and
the number of experiments are more useful for
modeling (Bas and Boyaci, 2007; Sebswree, 2009).
The aim of this study is to optimize the extraction
process from Teaw using central composite design.
Three variables were used in this study: solvent
polarity index (5.5-9.0), temperature (50-70°C) and
extraction time (35-55 min). The optimization
condition was based on yield, total phenolic content
(TPC), DPPH radical scavenging (DPPH), ABTS
radical scavenging (ABTS) and thiobarbituric acid
reactive substances (TBARs) assay.
2 MATERIALS AND METHODS
2.1 Materials
Ethyl acetate was purchased from Honeywell
(USA).2, 2- diphenyl- 1- picrylhydrazyl(DPPH), Gallic
acid (C
7
H
6
O
5
), 2,2-Azinobis (3-ethylbenzothiazoline-
6-sulfonic acid) (ABTS) and Linoleic acid were
purchased from Sigma-Aldrich (USA).6-hydroxy-
2,5,7,8tetramethylchroman-carboxylic acid (Trolox)
was purchased from BBL (USA). Folin–Ciocalteu
reagent was purchased from VWR- Prolabo. Sodium
Carbonate (Na
2
CO
3
) was purchased from Ajax-
Finechem (Australia). Thiobarbituric acid (TBA),
1,1,3,3-Tetraethoxypropane (MDA) and Tween 40
were purchased from Merck (USA), Trichloroacetic
acid (TCA) and Ethanol were purchased from RCI-
Labscan (Iceland).
Teaw (C. formosum) was collected from Ubol
Ratchathani province, Thailand. The sample was
cleaned and selected fresh leaves and dried at 40°C in
hot air oven for 24 hours. The dried Teaw was ground
and passed through a sieve with mesh number 40 and
frozen at -20°C.
2.2 Extraction Procedure
In this study, three variables, polarity index of solvent
(5.5-9.0), temperature (50-70°C) and extraction time
(35-55 min) were designed by using the Central
Composite Design. The extraction conditions are
shown in Table 1. The solvent preparation was
calculated by using equation 1 (Poole, 1998).
P
'
= ∑
i
P
'
i
Ø
i
(1)
Where, P
'
i
is the polarity index of solvent i
Ø
i
is the quantity of solvent i
The polarity index of ethyl acetate, ethanol and
water are 4.4, 5.2 and 10.2, respectively (Katz, 1998;
Harris, 2015). These solvents were used for preparing
the polarity index as calculated from the formula
above. From this, it has five varying solvent including
ethyl acetate, 95%ethanol, 60% ethanol, 25% ethanol
and water (Table1). For extraction, 200 ml of solvent
was placed in the waterbath to obtain the targeted
temperature and then mixed with 10 g of plant
powder. The sample was set for certain extraction
time, cooled with the tap water and filtered through
Whatman No. 4. The filtrate was concentrated by
rotary evaporator at 35±1 °C, vacuum pressure 50
mbar. After that, the concentrated extract was
dehydrated by using freeze-dryer at -80°C for 50
hours and extract powder was kept at -20°C. The
moisture content was determined by AOAC method
966.02 (2000).
2.3 Analytics Method
2.3.1 Yield (%)
The percentage ration of total solid of Teaw extract
and plant was calculated by using the equation 2.
% Yield =
()
()
× 100
(2)
2.3.2 Total Phenolic Content (TPC)
The total phenolic content was determined by the
Folin–Ciocalteu method (Shaghaghi et al., 2008).
The 40 µl extract was mixed with 100 µl deionized
water, 20 µl Folin–Ciocalteau reagent and 40 µl
sodium carbonate (10% Na
2
CO
3
). Then, it was kept
at room temperature for 30 minutes in the dark.
Absorbance was measured at 765 nm. Results were
expressed as mg of gallic acid per gram dry sample.
2.3.3 DPPH Radical Scavenging (DPPH)
The radical-scavenging activity was determined by
the DPPH method (Murakami et al., 2004). Aliquot
of 50 µl of extract was mixed with 150 µl of 0.22 M
DPPH (in 95% ethanol) and incubated at room
temperature in the dark for 30 minutes. The
Absorbance was measured at 517 nm using Trolox as
a standard. Results were expressed as mg of Trolox
per gram dry sample.
16th AFC 2019 - ASEAN Food Conference
120
Table 1: Experimental designs using central composite designs (CCD) and results of the response variables studied.
Independent Variables Response Variables
Polarity:X
1
(Solvent)
Time:X
2
(min)
Temp:X
3
(°C)
Yield
(%)
TPC
(mg/g)
DPPH
(mg/g)
ABTS
(mg/g)
TBARs
(mg/g)
1 4.4(Ethyl acetate) 45.0 60 13.30 195.34 297.10 123.49 348.29
2 5.45(25% Ethanol) 35.0 50 19.33 207.49 271.46 227.29 272.40
3 5.45(95% Ethanol) 35.0 70 16.23 227.83 262.88 144.73 278.76
4 5.45(95% Ethanol) 55.0 50 19.04 208.41 267.42 141.55 423.49
5 5.45(95% Ethanol) 55.0 70 19.27 275.15 349.12 196.98 302.71
6 7.2(60% Ethanol) 28.2 60 23.96 264.37 379.55 233.10 285.50
7 7.2(60% Ethanol) 45.0 43 24.63 272.71 372.98 276.43 294.57
8 7.2(60% Ethanol) 45.0 60 19.27 275.15 349.12 196.98 302.71
9 7.2(60% Ethanol) 45.0 60 25.22 280.66 388.76 177.44 289.07
10 7.2(60% Ethanol) 45.0 60 27.16 288.23 390.15 172.95 324.42
11 7.2(60% Ethanol) 45.0 77 28.65 273.55 394.32 180.00 311.47
12 7.2(60% Ethanol) 61.8 60 28.90 283.49 372.10 288.91 317.60
13 8.95(25% Ethanol) 35.0 50 25.04 282.49 382.32 203.57 315.74
14 8.95(25% Ethanol) 35.0 70 29.77 297.63 402.40 213.33 296.74
15 8.95(25% Ethanol) 55.0 50 25.70 297.63 406.44 224.88 297.75
16 8.95(25% Ethanol) 55.0 70 27.03 289.98 409.47 203.49 295.89
17 10.2 (water) 45.0 60 21.81 244.72 335.48 177.60 322.17
2.3.4 ABTS Radical Scavenging (ABTS)
The ABTS was determined by ABTS method (Zhou
and Yu, 2004). Aliquots of 50 µl extract and 100 µl
of 5 mM ABTS solution was mixed and kept in the
dark for 5 minutes. The Absorbance was measured at
734 nm and compared with Trolox standard. Results
were reported as mg of Trolox per gram dry sample
2.3.5 Thiobarbituric Acid Reactive
Substances (TBARs) Assay
The Oxidation resistance was determined by the Ant-
TBARs method (McDonald and Hultin, 1987).
Briefly, aliquots of 0.2 ml samples and 0.8 ml
linolenic acid (1%) was mixed and placed in a water
bath at a temperature of 50 ± 1 °C for 18 hours. After
that, 2 mL of TCA-TBA-HCl solution was added and
boiled in the boiling water for 15 minutes. The sample
was cooled with the tap water and centrifuged at a
speed of 5,500 rpm for 5 minutes. The supernatant
was measured the absorbance at 520 nm and
compared to Butylated Hydroxy Toluene (BHT)
standard.
2.4 Experimental Designs and
Statistical Analysis
A Central composite (CCD) experimental design was
used to investigate the effects of three independent
variables, namely polarity index of solvent (X
1
)
extraction time (min; X
2
), and temperature (°C; X
3
).
A total of 17 experimental runs are listed in Table 1
The influence of extraction factors was optimized
using Response Surface Methodology (RSM) using
by design expert software (Design Expert 7.0 trial).
3 RESULTS AND DISCUSSION
3.1 The Yield, TPC, DPPH, ABTS and
TBARs
The response variables of Teaw extract obtained from
17 experiments from extraction factors values were
yield (13.30 - 29.77%), TPC (195-297 mg GAE/g dry
sample), DPPH (263-409 mg Trolox/g dry sample ),
ABTS (123-289 mg Trolox/g dry sample) and
TBARs (272-424 mg BHT/g dry sample). The data of
experiment were statistically tested for analysis of
variance (ANOVA) for regression model which are
shown in Table 2.
Extraction Optimization of Total Phenolic Content and Antioxidant Activity from Teaw (Cratoxylum formosum) by Central Composite
Design
121

Table 2: Analysis of variance (ANOVA) for regression model.
Response Source of variation Sum of squares df Mean square F-value p- value
Yield Model 308.45 9 34.27 4.33 0.0331
Residual 55.35 7 7.91
Lack of fit 21.50 5 4.30 0.25 0.9060
Pure error 33.85 7 7.91
Corr total 363.80 16
R
2
= 0.8479 Adj.R
2
= 0.6522
TPC Model 15635.64 9 1737.29 6.24 0.0124
Residual 1949.85 7 278.55
Lack of fit 1863.68 7 287.55
Pure error 86.17 2 43.08
Corr total 17585.49 16
R
2
= 0.8891 Adj.R
2
= 0.7466
DPPH Model 21209.40 3 7069.80 4.72 0.0193
Residual 19472.50 13 1497.88
Lack of fit 18368.61 11 1671.51 3.08 0.2706
Pure error 1084.89 2 542.95
Corr total 40681.90 16
R
2
= 0.5213 Adj.R
2
= 0.4109
ABTS Model 22651.62 9 2516.85 2.14 0.639
Residual 8227.19 7 1175.31
Lack of fit 7900.75 5 1580.15 9.68 0.0963
Pure error 326.44 2 163.22
Corr total 30878.80 16
R
2
= 0.7336 Adj.R
2
= 0.3910
TBARs Model 13866.30 9 1540.70 2.07 0.1755
Residual 5220.07 7 745.72
Lack of fit 4584.47 5 916.89 2.89 0.2772
Pure error 635.60 2 317.80
Corr total 19086.37 16
R
2
= 0.7265 Adj.R
2
= 0.3749
The result showed that 3 of 5 response variables
including yield, TPC and DPPH were significant
difference (p≤0.05). This indicated that 3 extraction
factors; polarity index of solvent, extraction time and
temperature affected on their values. On the other
hand, ABTS and TBARs showed insignificant
difference (p>0.05).
For extraction yield, response model was fitted to
a quadratic equation with correlation coefficient (R
2
)
of 0.8479 (p=0.0331). In addition, the lack of fit value
was insignificantly (p-lack of fit = 0.9060)
indicating
that model was suitable and no other model could
explain this response. The yield regression equation
is shown in equation (3).
Yield = 17.528 + 11.968X
1
- 0.343X
2
-
1.337X
3
-0.0351X
1
X
2
+ 0.0639X
1
X
3
-
0.0000962X
2
X
3
- 0.844X
1
2
+ 0.00736X
2
2
+
0.00795X
3
2
(3)
The correlation coefficient of this equation was
0.8891. The TPC value was good fitted to a quadratic
model with R
2
of 0.8891 that mean a model was
effective to explain 88.91% of this result. Moreover,
the lack of fit value was insignificantly (p-lack of fit
> 0.05) representing a suitable model for TPC. The
TPC regression equation is presented in equation (4).
16th AFC 2019 - ASEAN Food Conference
122
TPC = -586.204 + 162.768X
1
+ 1.892X
2
+
5.042X
3
+ 0.291X
1
X
2
- 0.568X
1
X
3
+ 0.0295X
2
X
3
- 7.014X
1
2
– 0.0102X
2
2
– 0.0131X
3
2
(4)
The DPPH response was not quite fitted to linear
equation due to R
2
of 0.5231 which means that linear
model was able to explain only 52.31% of this result.
Despite, the lack of fit this model was insignificantly
(p-lack of fit > 0.05) which means no other models
fit. Therefore, this linear model was proper. The TPC
regression equation is presented in equation (5).
DPPH = 108.461 + 21.546X
1
+ 0.738X
2
+ 0.961
X
3
(5)
For the ABTS regression model, the ABTS data is
a quadratic model has a R
2
of 0.7336 and lack of fit
was insignificantly (p-lack of fit > 0.05).
Additionally, the ABTS data was insignificantly (p >
0.05) with any model. This means that the polarity
index of solvent, extraction time and temperature had
no influence on the ABTS. Similar result was
observed in TBARs. The TBARs response was
insignificantly fitted in any
model (p > 0.05).
Although, in a quadratic model the TBARs result
performed R
2
of 0.7265 with lack of fit of 0.2772 The
ABTS and TBARs regression equation was are
shown in Equation 6 and 7 respectively.
ABTS = 1303.183 + 66.614X
1
- 30.881X
2
-
22.271X
3
+ 0.321X
1
X
2
+ 0.110X
1
X
3
+ 0.133X
2
X
3
- 5.396X
1
2
+ 0.234X
2
2
– 0.1162X
3
2
(6)
TBARs = - 143.818 - 30.549X
1
+ 21.749X
2
+
2.568X
3
- 1.384X
1
X
2
+ 0.668X
1
X
3
- 0.137X
2
X
3
+ 3.309X
1
2
-0.22X
2
2
– 0.016X
3
2
(7)
3.2 Analysis of Response Surface
Equations from mathematical models of three response
variables were plotted to a contour plot. The contour
plot present two factors between a response and
another one factor specifying at central value. Yield,
TPC and DPPH were response variables (Y) and a
polarity index of solvent (X
1
), extraction time (X
2
) and
temperature (X
3
) where independent variables.
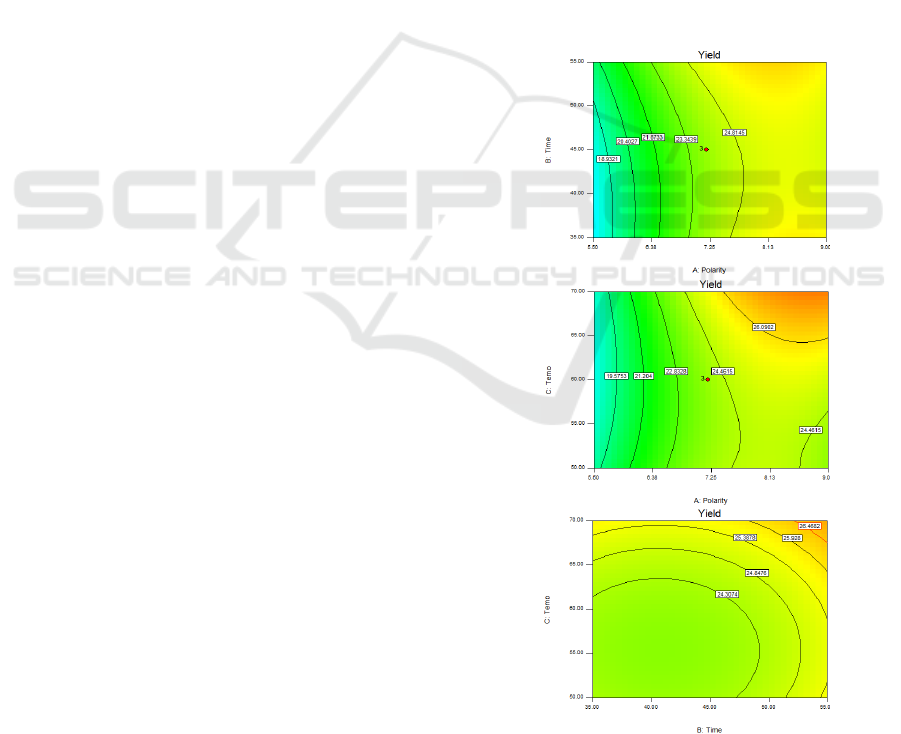
Figure 1 shows a contour plot of yield of
extraction depending on the solvent polarity, time and
heating treatment. It is known as that polarity of
solvent is the most important factors under the same
extraction time and temperature (Ju et al., 2014).
Considering, the effect of polarity index of solvent
and extraction time in Figure 1a, yield increased by
increasing the polarity solvent and time. Yield for
24.81% was the highest yield by increasing 7.5-9 for
polarity index of solvent with time in range 35-55
minutes. These results suggested that increasing
polarity or water concentration in the solvent raised a
yield which may cause of the higher solubility of
proteins and carbohydrate in water (10.2 for polarity
index) than a low polarity index of solvent (Zielinski
and Kozlowska, 2000). That why a yield was
increased by increasing polarity solvent. Figure 1b
show the effect of polarity index of solvent and
temperature. Yield was increased by increasing
polarity solvent. The highest value was 26.09%
among 7.5-9 for polarity index of solvent with
temperature 63-70°C, but it decreased at low
temperature (< 63 °C). Thus, yield of Teaw extract
affected by temperature. The higher temperature may
improve the solubility of antioxidant compounds
(Liang et al., 2017). The effect of extraction time and
temperature with 7.25 for polarity index of solvent
was shown in contour plot Figure 1c. Yield of extract
was increased by increasing extraction time and
temperature. This result confirmed that extraction
time and temperature influenced the yield.
Figure 1: Contour plot for yield (%) as a function of (a)
polarity index of solvent and extraction time, (b) polarity
index of solvent and temperature, (c) extraction time and
temperature of Teaw extract.
(a)
(b)
(c)
Extraction Optimization of Total Phenolic Content and Antioxidant Activity from Teaw (Cratoxylum formosum) by Central Composite
Design
123
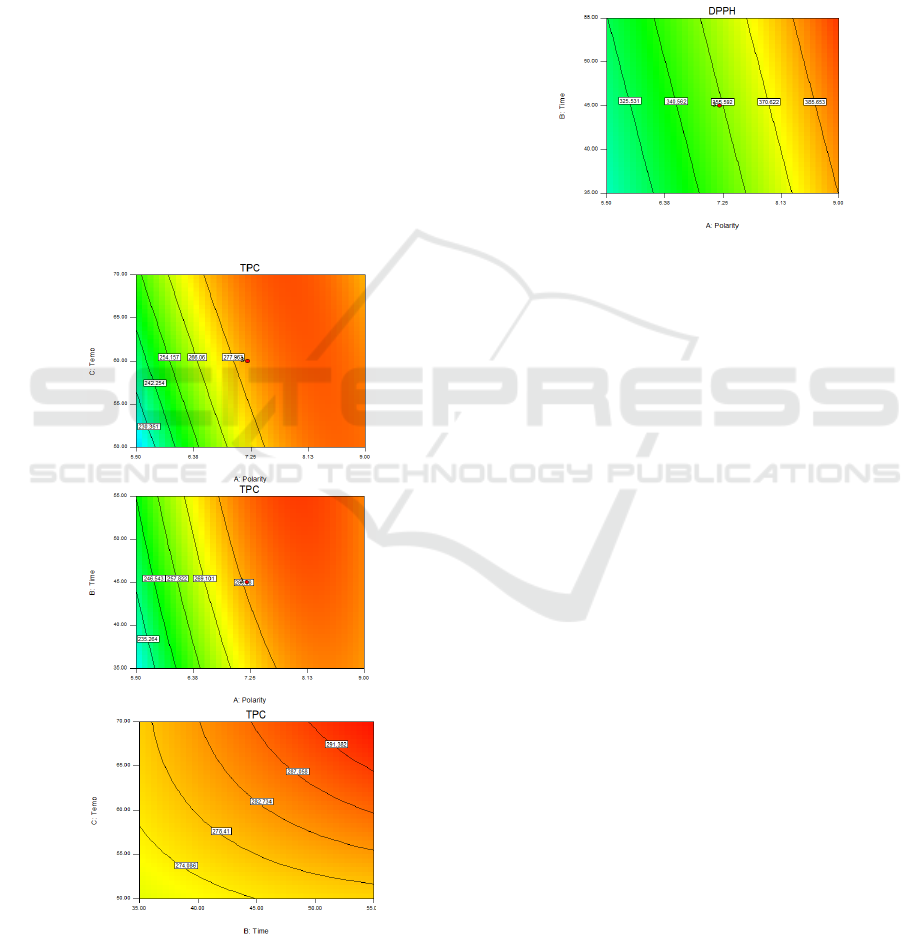
Influence of extraction factors on a TPC is
presented in contour plot (Figure.2). The TPC value
increased by increasing a polarity index of solvent
from 7.25 until almost 9 after that slightly decreased
(Figure.2a). TPC increased by increasing a polarity
index of solvent at higher 7.25 and the highest TPC
value was inspected at 8.13 to 9 for polarity index.
These results confirmed the polarity of solvent greatly
influence on the TPC value. On the other hand, when
temperature increasing the TPC value had a slightly
decrease as a result of high temperature. The
temperature was an important factor affecting of the
extract due to thermal degradation or loss of the
antioxidant compounds. It suggests molecular change
inside the antioxidant compounds structure (Sahin,
2018). In addition, the TPC increased by increasing
time and temperature (Figure.2c). High temperature
and time might soften the plant tissue and waken the
phenol-polysaccharide and phenol-protein inter-
actions in plant therefore, the polyphenol would
migrate into solvent (Youseff and Adawi, 2006).
Figure 2: Contour plot for TPC (mgTrolox/g dry sample) as
a function of (a) polarity index of solvent and extraction
time, (b) polarity index of solvent and temperature, (c)
extraction time and temperature of Teaw extract.
Figure 3 shows the contour plot of Teaw extract
on DPPH. The DPPH values were fitted to linear
model. This meant factors had not interaction term on
this result (Equation 5). However, each factor was
effective to DPPH value. It increased by increasing
the polarity index of solvent, extraction time and
temperature. Polarity of solvent was vastly influent
factor. When polarity index increased at 8.95, DPPH
was highest value. Then, polarity index at 10.2 DPPH
was slightly decreased.
Figure 3: Contour plot for DPPH (mgTrolox/g dry sample)
of Teaw extract.
3.3 The Optimum Extraction
Using the design expert software 7.0 trial, the
computer program calculated the optimal conditions
which was solvent polarity index of 8.64 at 70°C for
55 min. The yield, TPC and DPPH were predicted to
be 28.58%, 289 mg/g dry sample and 402 mg/g dry
sample, respectively with the desirability value of
0.933. The desirability represents the correlation of
independent and response. In this experiment, it was
correlation of 93.3% which a “very good” correlation
level (Lazic, 2004).
4 CONCLUSIONS
Three extraction factors including polarity index of
solvent and extraction condition (temperature and
time) significantly pronounced the effect on yield and
TPC while the other three variables were
insignificant. The central composite design as an
experimental design using by design expert program
could be used for optimizing the Teaw extraction. The
optimum condition was a solvent polarity index of
8.42 at 70°C for 55 min with desirability of 0.933.
This technique is simple, cheap and good for natural
bioactive extraction from Teaw being a potential
approach for natural antioxidants.
(a)
(b)
(c)
16th AFC 2019 - ASEAN Food Conference
124

REFERENCES
Altermimi, A., Lakhssassi, N., Baharlouei, A., Watson,
D.G., Lightfoot, D. A., 2017. Phytochemicals:
Extraction, Isolation, and Identification of Bioactive
Compounds from Plant Extracts. Plants. Volume 6(4),
pp. 2-23.
Areekul, S., Inthorn, J., Thakaew, S., Nunthakeaw, 2009. A.
Knowledge about wild plants and utilized in northern
Thailand volume 1. Bankok: Amarin printing
plublising.
Bas, D., Boyaci, I.H.,2007. Modeling and optimization I:
Usability of response surface methodology. Journal of
Food Engineering. Volume. 78, pp. 836-845.
Harris, D., 2015. Quantitative Chemical Analysis. 9th
edition. United States of America: W. H. Freeman and
Company.
Ju, Y., Do, Q.D., 2014. Angkawijaya A.E., Tran-Nguyen
P.L., Huynh L.H., Soetaredjo F.E., Ismadji S. Effect of
extraction solvent on total phenol content, total
flavonoid content, and antioxidant activity of
Limnophila aromatica. Journal of food and drug
analysis. Volume 22, pp. 296-302.
Katz, E., 1998. Handbook of HPLC. New York: Marcel
Dekker.
Kaur, C., Kapoor, H.C., 2002. Antioxidants in fruits and
vegetables-the millennium's health. International
Journal of Food Science and Technology. Volume 36,
pp. 703-725.
Lattanzio, V., 2013. Phenolic Compounds: Introduction In:
Ramawat K.G., Me´rillo J.M. Natural products .Sprin-
ger-Verlag Berlin Heidelberg https://www.resear-
chgate.net/publication/249970213_qPhenolic_Compo
unds_Introduction.
Lazic, Z.R., 2004. Design of experiment in chemical
engineering. Mörlenbach: Wiley-VCH.
Liang, H., Wang, W., Xu, J., Zhang, Q., Shen, Z., Zeng, Z.,
Li. Q., 2017. Optimization of ionic liquid-based
microwave-assisted extraction technique for curcumi
noids from Curcuma longa L. Food and Bioproducts
Processing. Volume 104, pp. 57-65.
Maisuthisakul, P., Pongsawatmanit, R., Gordon, M.H.,
2007. Characterization of the phytochemicals and
antioxidant properties of extracts from Teaw
(Cratoxylum formosum Dyer). Food Chemistry.
Volume 100, pp. 1620-1629.
McDonald, R. E., Hultin, H.O., 1987. Some Characteristics
of the Enzymic lipid peroxidation system in the
microsomal fraction of flounder skeletal muscle.
Journal of Food Science. Volume 52, pp. 15–21.
Murakami, M., Shukla, Y.N., Jain, S.P., Kumar, S., 2004.
Effect of thermal treatment on radical-scavenging
activity of single and mixed polyphenolic compounds.
Journal of Food Science. Volume 69, pp. 7-10.
Nakahara, K., Trakoontivakorn, G., Alzoreky, N.S., Ono,
H., Kameyama, M.O., Yoshida, M., 2002.
Antimutagenicity of Some Edible Thai Plants, and a
Bioactive Carbazole Alkaloid, Mahanine, Isolated from
Micromelum minutum. Journal of Agricultural and
Food Chemistry. Volume 50, pp 4796-4802.
Poole, C.F., Poole, S.K., 1999. Chromatography Today.
Amsterdam: Elsevier Science Publishers.
Sahin, S., 2018. Optimization of ultrasonic-assisted
extraction parameters for antioxidants from Curcuma
longa L. Trakya University Journal of Natural
Sciences. Volume 19(2), pp.121-128.
Sebswree, J., 2009. DOE chapter: Central composite
design. Production quality. Volume.145, pp. 72-74.
Shaghaghi, M., Manzoori, J.L., 2008. Jouyban, A.,
Determination of total phenols in tea infusions tomato
and apple juice by terbium sensitized fluorescence
method as an alternative approach to the Folin-
Ciocalteu spectrophotometric method. Food Chemistry.
Volume 108, pp. 695-701.
Youseff, D., Adawi, H. E., 2006. Study on grap seeds
extraction and optimization: An approach. Journal of
Applied Sciences. Volume 6(14), pp. 2944-2947.
Zhou, K., Yu, L., 2004. Antioxidant properties of bran
extracts from Trego wheat grown at different location.
Journal of Agricultural and Food Chemistry. Volume
52, pp. 1112-1117.
Zielinski, H., Kozlowska, H., 2000. Antioxidant activity
and total phenolics in selected cereal grains and their
different morphological fractions. Journal of
Agricultural and food Chemistry. Volume 48(6), pp.
2008-2016.
Extraction Optimization of Total Phenolic Content and Antioxidant Activity from Teaw (Cratoxylum formosum) by Central Composite
Design
125
