
Estimation of Calcium, Magnesium and Sulfur Content in Oil Palm
using Multispectral Imagery based UAV
Muyassar Allam Suyuthi
1,*
, Kudang Boro Seminar
1
and Sudradjat
2
1
Department of Mechanical and Biosystem Engineering, IPB University, Bogor, Indonesia
2
Department of Agronomy Horticulture, IPB University, Bogor, Indonesia
Keywords: Oil Palm, Multispectral Images, Nutrition, UAV.
Abstract: Oil palm is a commodity which contributes to the largest foreign exchange. In Indonesia, the area of oil palm
plantations has a large area compared to other commodities. Proper and efficient fertilization is needed to
reduce production costs. This study aims to estimate the nutrient content of calcium, magnesium, and sulfur
in oil palm plants using UAV-based multispectral cameras. The method used is divided into three stages, data
preparation, pre-processing, and data analysis. At the data preparation stage, the things done are leaf sampling,
sample coordinate points, and multispectral image capture. In the pre-data processing stage the things done
are stitching, georeferencing, and digitizing. The last stage is data analysis like multiple linear regression
analysis to get a model of the relationship of multispectral images and actual nutrition of lab test results. The
results of this study obtained a model for predicting of calcium content Ca = 0.994+0.00723*GREEN-
0.00863*RED EDGE, for magnesium content is Mg = 0.693+0.00531*RED-0.00541*RED EDGE, and for
sulfur content is S = -0.222+0.00338*RED EDGE. The results of overall accuracy using a confusion matrix
of 66.7% in the calcium model, 63.3% in the magnesium model, and 36.6% in the sulfur model.
1 INTRODUCTION
Oil Palm (Elaeis guineensis Jacq.) is a commodity of
plantation crops that contributes to the country's
largest foreign exchange because oil palm
commodities have high economic value in
agribusiness. Palm oil has benefits and advantages
compared to other commodity vegetable oils.
Indonesia is the country with the largest palm oil
production in the world with a contribution of 44.46%
of the total world CPO. This contributes to the quite
large Gross Domestic Product (GDP) reaching
13.14% in 2017. In Indonesia, the area of oil palm
plantations in 2017 according to the Central Statistics
Agency (BPS) in 2018 is estimated to reach more than
twelve million hectares, so to increase productivity
requires proper fertilization. Fertilization on oil palm
plants aims to provide nutrient needs for plants so that
plants can grow well and be able to produce optimally
and produce good quality oil (Adiwiganda and
Siahaan 1994). To get the right fertilization results,
fertilizer recommendations for the palm oil
commodity are needed. Fertilization
recommendations are to apply fertilization in a
manner and dose that have been determined in the
plantation area so that the most efficient absorption of
nutrients occurs in plants and can integrate the use of
mineral fertilizers and oil palm residues and minimize
environmental impacts associated with excessive
fertilization such as land degradation (Goh and
Hardter 2003). In addition to maximizing the
nutrients absorbed, it can also save production costs,
because according to Gerendas and Heng (2011) a
large proportion of the total production costs is
fertilization costs.
Essential nutrients are essential nutrients for
plants and their functions cannot be replaced by other
elements so plants cannot grow normally if they are
not available in sufficient quantities in the soil. The
essential nutrients studied in this research are calcium,
magnesium, and sulfur. Sudradjat (2016) states that
the main macro-nutrients needed by oil palm plants
are nitrogen, phosphorus, potassium, and magnesium.
While the micro-nutrient that often become obstacles
are copper, iron, manganese, and boron.
Chlorophyll greatly affects the level of light
reflectance in leaves. The reflectance of plants in
visible light (red, green, blue) (400-700 nm) and NIR
(700-900 nm) are strongly influenced by chlorophyll
and leaf cell structure (Stark et al. 2006). The light
Suyuthi, M., Seminar, K. and Sudradjat, .
Estimation of Calcium, Magnesium and Sulfur Content in Oil Palm using Multispectral Imagery based UAV.
DOI: 10.5220/0009978700002833
In Proceedings of the 2nd SEAFAST International Seminar (2nd SIS 2019) - Facing Future Challenges: Sustainable Food Safety, Quality and Nutrition, pages 127-134
ISBN: 978-989-758-466-4
Copyright
c
2022 by SCITEPRESS – Science and Technology Publications, Lda. All rights reserved
127

reflectance pattern can be used to assess plant health
conditions related to the available of calcium,
magnesium and leaf sulfur nutrients. In this research,
parrot sequoia cameras are used to capture the light
reflectance of the leaves. The Phantom 4 Pro drone
with a Parrot Sequoia camera is used to take
multispectral images that can capture 4 color
spectrum bands (green, red, red edge, and near-
infrared). Table 1 shows the specifications of the
Parrot Sequoia camera.
Table 1 Specifications of Parrot Sequoia cameras.
Spesifikasi kamera Parrot Sequoia
Pixel 1.2 mp (1280x960)
Field of View 61.9
o
Green ban
d
530
–
570n
m
Red ban
d
640
–
680 n
m
Red Ed
g
e ban
d
730
–
740 n
m
Near Infrared ban
d
770
–
810 n
m
RGB 400
–
700 n
m
Sumber: Parrot SA (2017)
Aerial photography using Unmanned Aerial
Vehicles (UAV) is an alternative technology to get
more detailed, real-time, fast and cheaper data
(Shofiyati, 2011). UAV is a flying robot with remote
control that is able to carry payloads according to its
purpose and designation. This drone is capable of
carrying cameras to photograph and record and can be
flown to reach certain locations by remote control by
pilots. Many advantages if monitoring is carried out
with UAVs, including low investment and
operational prices, fast and flexible information
acquisition times, and information generated can be
more detailed than satellite data. In addition, the UAV
in transition flies under the cloud so that its image is
cloud free when compared to satellite imagery which
depends more on atmospheric conditions (Dony
2014).
This research was conducted to estimate the
calcium, magnesium, and sulfur macro-nutrient
content of oil palm plants quickly and accurately by
utilizing phantom drones 4. Taking images using
multispectral parrot sequoia cameras that have high
resolution. As well as leaf analysis to determine the
nutrient content of calcium, magnesium, and sulfur in
oil palm. The results of the image and nutrient content
are correlated and interpreted in the form of a model.
2 RESEARCH METHODS
2.1 Time and Location
The study was conducted from February 2019 to
April 2019 at the IPB-Cargill Oil Palm Education and
Research Plantation, Singasari, Jonggol, Bogor, West
Java with coordinates 06
0
28,319' South Latitude,
107
0
01.103' East Latitude and located 116 m above
sea level. The research was also conducted at the
Bioinformatics Engineering Laboratory of
Mechanical and Biosystem Engineering, Faculty of
Agricultural Technology, IPB University and Testing
Laboratory of the Department of Agronomy and
Horticulture, Faculty of Agriculture, IPB University.
2.2 Materials and Tools
The tool used in this research is a computer with i7
processor speed of 2.4 GHz and has 8 GB of RAM.
Software used to process data are Microsoft Excel,
Microsoft Word, QGIS 2.18, Pix4DMapper, Agisoft
PhotoScan, and Minitab 18. Primary data used in this
study were leaf nutrition obtained from leaf analysis
testing at the Testing Laboratory of the Department of
Agronomy and Horticulture, Faculty Agriculture,
Bogor Agricultural University. Another primary data
used is aerial photography from a 0.076 resolution
Parrot Sequoia multispectral camera with the help of
a Phantom 4 Pro drone.
2.3 Research Stages
The research began with the preparation phase of the
data consisting of leaf sampling, leaf sample
coordinate points and Ground Control Point (GCP),
and drone image capture. Then the leaf samples were
analyzed at the Laboratory to determine the nutrient
content used as the dependent variable. The drone
image data obtained must be carried out in the pre-
data processing stage. This stage consists of photo
stitching, georeferencing, and digitization of garden
boundaries and canopy of sample plants. The results
of the pre-processing data are in the form of reflectant
values in each sample plant and will be used as an
independent variable. After that the data analysis is
processed by multiple linear regression with stepwise
methods using independent variables and dependent
variables. The results of the regression model are then
displayed in the form of an nutrient estimation layer.
2nd SIS 2019 - SEAFAST International Seminar
128

2.3.1 Data Preparation Stage
In the data preparation stage, several things are
carried out, namely literature study, method
determination, discussion, and data collection. After
the research planning is done, the data collection
stage is carried out. The data collection phase is done
by three things, namely sampling, drone imagery, and
GCP. Leaf sampling is carried out in a spread where
the sample plants are proportionally determined.
Guidelines for sampling leaves on oil palm plants
based on Winarna et al. (2005) where the leaves used
as the main sample must meet a number of provisions,
namely they are not the mains of inserts, grow
normally, do not lie adjacent to roads or ditches/rivers,
do not coexist with insertion trees and are not attacked
by pests or diseases.
Leaf samples taken were leaves from the 17th
midrib. According to Chapman and Gray (1949) in
Pahan (2006) said that the leaves of the 17th midrib
are the most sensitive leaves because they show the
greatest difference in nutrient levels. In addition,
nutrient status on the 17th leaf has a better correlation
to crop production when compared to other younger
leaves. The leaves of the 17th midrib are taken by six
leaflets (three strands on the left and three strands on
the right at the meeting point of the two sides of the
midrib). Leaves that have been taken are stored in
envelopes that have been labeled according to the
location of the sample. The selected sample plants
were given raffia to indicate the tree was a sample
plant. Then the sample plants are marked on GPS
which will be used to correct the geometry between
the map and the image results. Samples that have been
obtained were analyzed for nutrients of calcium,
magnesium, and sulfur in the Testing Laboratory of
the Department of Agronomy and Horticulture.
Multispectral image capture using a Phantom 4
drone with a Parrot Sequoia camera. Drone flight
planning automatically uses the Pix4D Mapper
application which is adjusted to the taking land area
and hours of time that can be taken by the drone.
According to Kasih (2012) the optimum shooting is
done in the morning because the effect of reflected
light from the sun is still weak. Besides the wind
speed in the morning still tends to be low, thereby
reducing the risk of UAV shake while shooting which
can cause poor quality captured images.
GCP determination aims to reduce errors or
changes in position when integrating the results of the
image into a map that can make the data change. GCP
can be in the form of objects, buildings, or forms of
certain locations that can be clearly seen on the image
so that the coordinates of the object can be measured
to be used as a reference point when uniting images
into a complete map. (Adillah 2018). A tool to draw
GCP coordinates can be by using a handheld GPS.
2.3.2 Pre-processing Stage
The objectives of the pre-processing stage such as
normalization and noise reduction are to produce
clean and ready-to-use data (Nanda et al. 2019; Nanda
et al. 2018a; Nanda et al. 2018b). At this stage, the
stitching and georeferencing process is performed
using pix4Dmapper software. The stitching process is
basically a combination or combination of two or
more different images to create or form one image
called a panorama (Kale and Singh 2015). Before
stitching, georeferencing needs to be done, namely
the process of giving geographic references to raster
or images that do not yet have a coordinate system
reference. The coordinate reference used is WGS 84 /
UTM zone 48S with EPSG: 32748.
Then do bordering of the garden and canopy of the
sample plants done using QGIS software. The results
of the bordering of the sample plant canopy are used
to extract the reflectance value in the form of a digital
number at each pixel. The tool used to extract these
values is Zonal Statistics on the Raster menu.
2.3.3 Data Analysis Stage
Estimation using multiple linear regression analysis
with the stepwise method is performed by Minitab
which aims to determine the factors that effect and
make a estimation model of calcium, magnesium, and
sulfur nutrition. At this stage two types of variables
are needed, namely the independent variable and the
dependent variable. The independent variable
contains the reflectance value data which is the
average value of the drone image in the digitizing
attribute of the sample plant. While the dependent
variable contains the actual calcium, magnesium, and
sulfur nutrition data from the 17th midrib nutrient
analysis results in the sample plants.
The model obtained is then evaluated to see the
strength of the estimator model. The method used to
evaluate the model is the Mean Absolute Percentage
Error (MAPE). MAPE shows how big the difference
between the actual results and the predicted results.
Table 2 shows the criteria used to decide the
predictive power of an estimator model.
Estimation of Calcium, Magnesium and Sulfur Content in Oil Palm using Multispectral Imagery based UAV
129
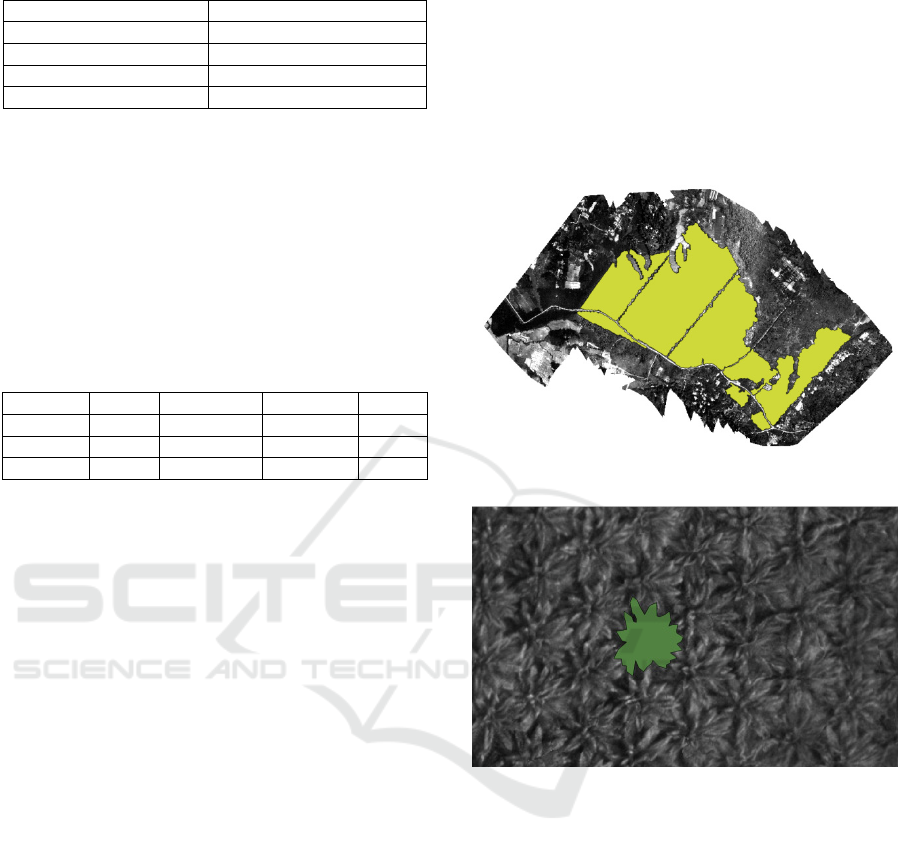
Table 2: Criteria for estimating the strength of the model.
MAPE
(
%
)
Power of
p
rediction
<10 Ver
y
Goo
d
10
–
20 Goo
d
20-50 Moderate
>50 Ba
d
Source: Wang et al. (2012)
After that, the nutrient estimation layer is made
which contains the estimated nutrient value for each
pixel. The estimated nutritional value is the
application of the model obtained using the raster
calculator tool in the QGIS application. Then the
estimate value is classified based on the criteria in
Table 3.
Table 3: Nutrition concentration of 17th fronds on the age
of oil palm is more than 6 years.
Nutrition Unit Deficienc
y
Optimu
m
Excess
Ca %DM <0.25 0.50-0.75 >1.00
Mg %DM <0.20 0.25
–
0.40 >0.70
S %DM <0.20 0.25-0.35 >0.60
Source: Von Uexkull and Fairhurst 1991
The results of the nutrient estimation layer that has
been classified will be tested for accuracy to see the
size of the miscalculation of nutrient estimates so that
it can be determined the percentage of accuracy of
nutrient estimation. Accuracy tests are performed
using a confusion matrix.
3 RESULT AND DISCUSSION
Overall data were collected on 6 February 2019 at the
Cargill IPB Oil Palm Education and Research
Plantation. The oil palm plantation, which was
cultivated starting in 2012, has an area of 59 hectares
which is divided into 5 plantation blocks. There are 3
types of data taken in this study, namely the 17th
frond leaf sample, the coordinates of the sampling
location and GCP, and the multispectral image.
Retrieval of data is done in a day because the data
needed is dynamic. Retrieval of image data using a
DJI Phantom 4 drone with a Parrot Sequoia
multispectral camera. The drone was flown in
accordance with the Parrot Sequoia handbook, which
is 110 meters above the ground, with a drone speed of
10 m/s and a pause time of 2.1 seconds for shooting.
The next step is the pre-processing of data in the form
of stitching, georeferencing and bordering. Before
that stage aerial photo printing results are selected
first using Agisoft PhotoScan then stitching and
georeferencing using QGIS. Restrictions on oil palm
plantations and sample canopy are done manually
using the add feature tool after creating a new
polygon layer in QGIS software. Figure 1 and Figure
2 show the results of bordering the sample plant
canopy digitized to extract the average value of the
digital number (DN) at each pixel. The extraction
process is carried out on all layers of stitches using
Zonal Statistics in QGIS. Extraction results can be
seen in appendix 1.
Figure 1: Results of the borderingon oil palm plantations.
Figure 2: Results of the bordering canopy of sample plants.
Nutrition estimation is represented in the form of
mathematical models. Modeling uses the Minitab 18
application with stepwise multiple linear regression
analysis. Modeling involves 23 samples from 30
samples. While the remaining 7 samples are used for
model validation. The independent variable used is
the average DN value of each pixel obtained from the
digitized of the plant canopy sample and the
dependent variable is the nutrient content of calcium,
magnesium, and sulfur laboratory test results. The
results of the stepwise multiple linear regression
model are as follows:
Ca= 0.994 + 0.00723 GREEN- 0.00863 RED EDGE
Mg= 0.693 + 0.00531 RED- 0.00541 RED EDGE
S = -0.222 + 0.00338 RED EDGE
The model obtained is then predicted with stat>
Regression> Regression> Predict. Table 4 shows a
2nd SIS 2019 - SEAFAST International Seminar
130

comparison of actual and predicted nutrition.
Evaluate the model using Mean Absolute Percentage
Error (MAPE). Evaluation of the model is done to see
how strong the estimation of the model is made. The
results of the model evaluation obtained the value of
MAPE in the Ca model, Mg model, and the S model
respectively 22.72%, 11.62%, and 46.5%. Based on
the strength estimation criteria of the model according
to Wang et al (2012) in table 2, the evaluation results
show that the Ca and S models are categorized as
medium and the Mg model is categorized as good.
The model obtained is then interpreted in the form of
an estimated nutrient layer that has been processed
and classified according to table 3. Classification of
nutritional assumptions is presented in the form of a
color that matches the nutrient content. The red color
indicates that the oil palm tree on the grid lacks
nutrients, yellow under optimal conditions, green at
optimum conditions, light blue at above optimum
conditions, and dark blue at excess nutrient conditions.
Figure 3 shows the results of the calcium nutrient
estimation layer, Figure 4 for magnesium nutrition,
and Figure 6 for sulfur nutrition.
The result of nutrient estimation layer is
performed by accuracy test using a confusion matrix.
In the confusion matrix the predicted nutrition of the
model results is compared with the actual nutrition of
the lab test results. From the results of the accuracy-
test using a confusion matrix, Overall Accuracy
obtained in the nutrients of calcium, magnesium, and
sulfur was 66.6%, 63.3%, and 36.7%. According to
Jaya (2015) a good accuracy value is an accuracy
value that has reached a score of> 85%, so the
estimation of calcium and magnesium nutrients has
moderate accuracy and for sulfur has poor accuracy.
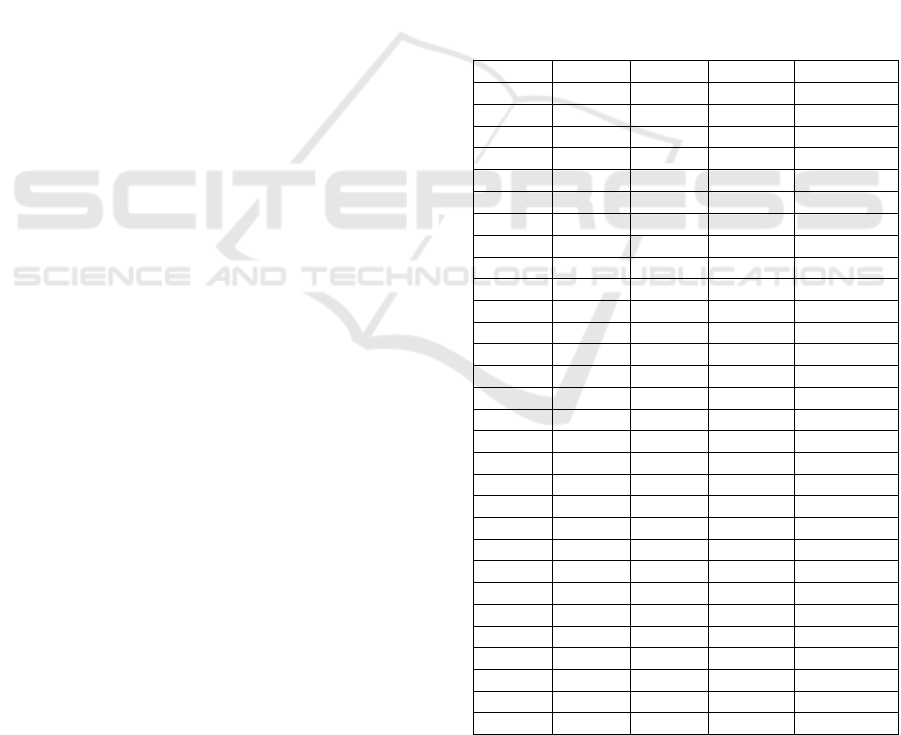
Table 4: Comparison of actual nutrition and prediction of the 17th midrib leaf laboratory results.
Sample
Ma
g
nesium
(
%DM
)
Kalsium
(
%DM
)
Sulfur
(
%DM
)
Actual Prediction Actual Prediction Actual Prediction
1A 0.36 0.296 0.51 0.643 0.15 0.231
1B 0.34 0.296 0.69 0.594 0.17 0.282
1C 0.19 0.304 0.53 0.616 0.17 0.266
1D 0.32 0.316 0.82 0.668 0.13 0.193
1E 0.32 0.284 0.69 0.622 0.43 0.264
2A 0.32 0.383 0.39 0.621 0.18 0.193
2B 0.42 0.356 0.59 0.642 0.14 0.218
2C 0.32 0.378 0.69 0.649 0.13 0.184
2D 0.41 0.390 0.91 0.658 0.40 0.167
2E 0.39 0.353 0.79 0.651 0.17 0.203
2F 0.35 0.351 0.68 0.638 0.17 0.233
2G 0.34 0.379 0.67 0.683 0.07 0.156
2H 0.44 0.386 0.42 0.668 0.09 0.181
3A 0.40 0.357 0.48 0.632 0.46 0.220
3B 0.38 0.370 0.68 0.603 0.40 0.265
3C 0.36 0.424 0.82 0.671 0.16 0.125
3D 0.30 0.375 0.79 0.615 0.14 0.236
3E 0.40 0.385 0.61 0.633 0.22 0.192
3F 0.41 0.389 0.66 0.661 0.34 0.157
3G 0.47 0.355 0.62 0.647 0.23 0.202
3H 0.45 0.416 0.55 0.629 0.20 0.182
3I 0.41 0.461 0.60 0.582 0.23 0.218
3J 0.49 0.458 0.51 0.583 0.28 0.221
3
K
0.44 0.410 0.70 0.570 0.19 0.286
3L 0.33 0.375 0.67 0.591 0.36 0.263
4A 0.48 0.362 0.56 0.608 0.26 0.247
4B 0.50 0.423 0.72 0.634 0.10 0.147
4C 0.37 0.387 0.87 0.625 0.17 0.169
4D 0.43 0.413 0.45 0.619 0.15 0.165
4E 0.40 0.382 0.52 0.577 0.15 0.243
Estimation of Calcium, Magnesium and Sulfur Content in Oil Palm using Multispectral Imagery based UAV
131
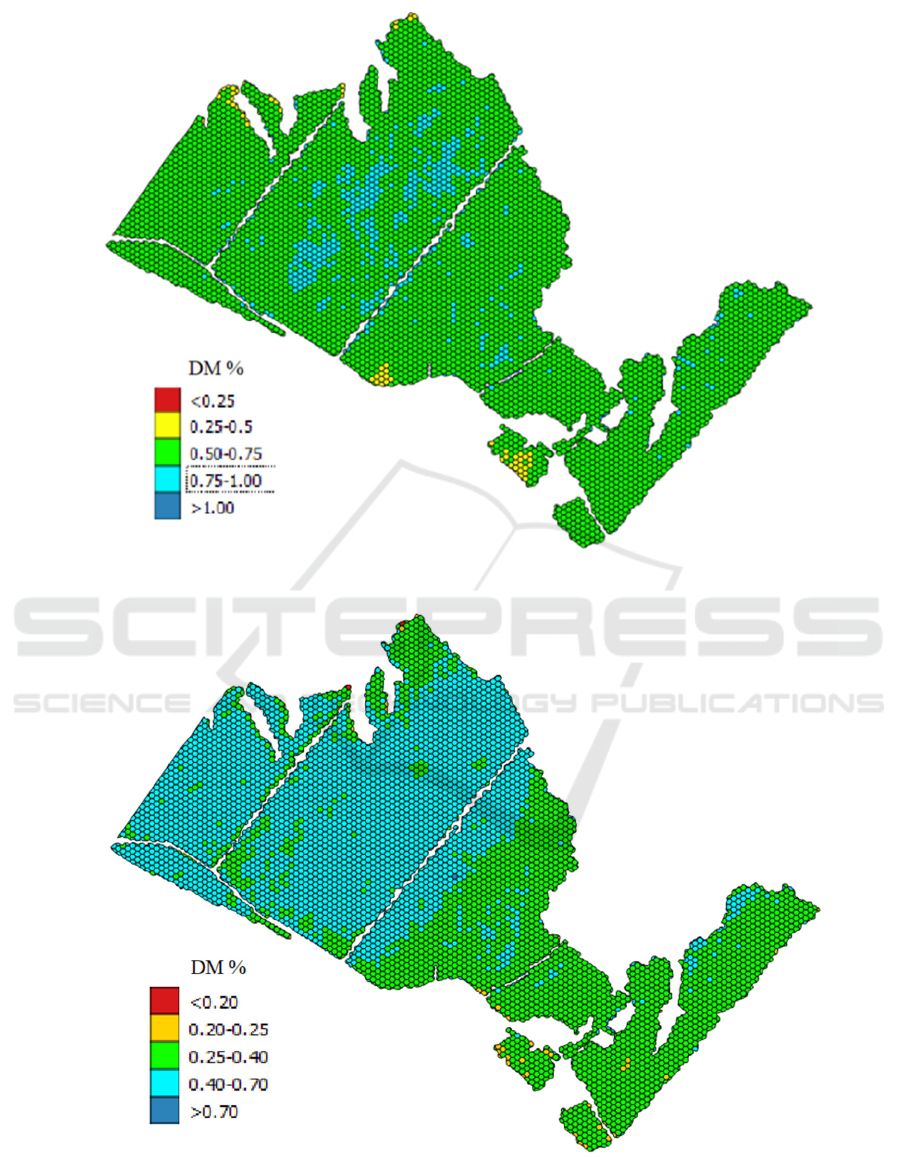
Figure 3: The calcium nutrient estimation layer.
Figure 4: The magnesium nutrient estimation layer.
2nd SIS 2019 - SEAFAST International Seminar
132
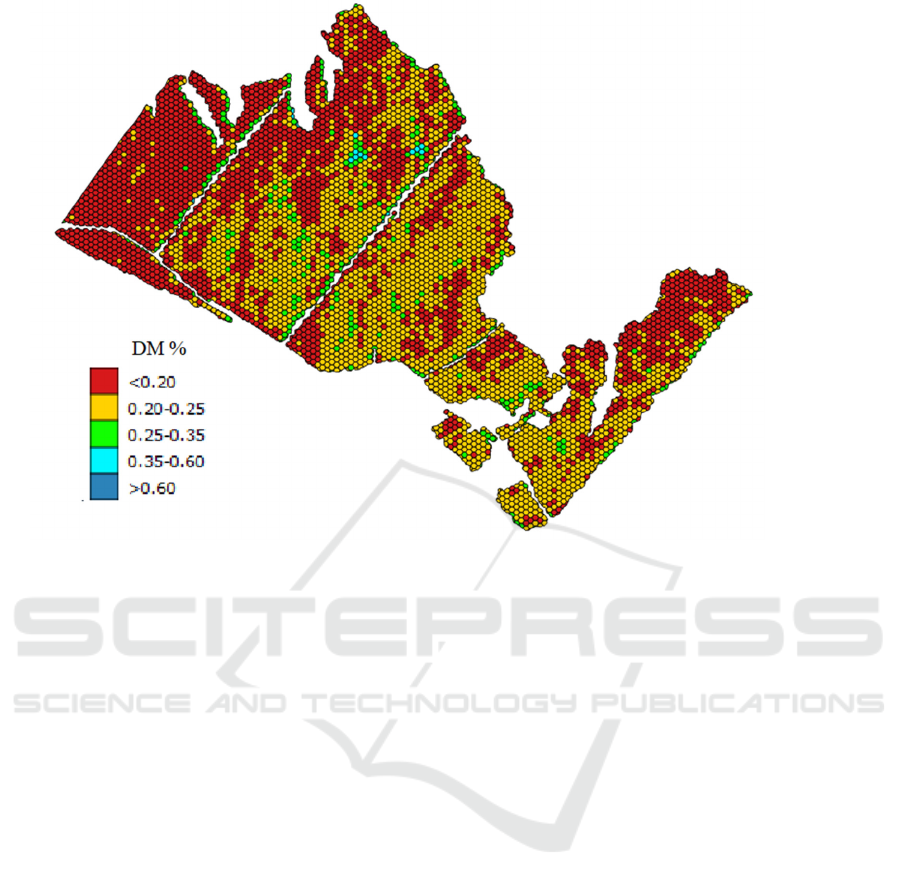
Figure 5: The sulfur nutrient estimation layer.
4 CONCLUSION
The nutritional estimation model was made by using
stepwise multiple linear regression analysis. The
independent variable used is the average
multispectral reflectance value in the form of a digital
number in the canopy of the sample plant and the
dependent variable used is the nutrient content of
calcium, magnesium, and sulfur on the 17th midrib
leaf obtained from analysis in the testing laboratory
of the Department of Agronomy and Horticulture,
IPB. The model obtained from multiple regression
analysis for calcium nutrition is Ca= 0.994 + 0.00723
*GREEN - 0.00863*RED EDGE, for magnesium
nutrition is Mg= 0.693 + 0.00531*RED - 0.00541
*RED EDGE, and for sulfur nutrition is S= -0.222 +
0.00338*RED EDGE . Evaluate the model using
Mean Absolute Percentage Error (MAPE). MAPE
values in the Ca, Mg, and S models are respectively
22.72%, 11.62%, and 46.57%. The results of the
model evaluation show that the strengths of the Ca
and S models are in the moderate category and the Mg
model is in a good category. While the accuracy of
the nutrient estimation layer using confusion matrix
obtained Overall Accuracy value for estimating
calcium nutrition by 66.7%, magnesium nutrition by
63.3%, and sulfur nutrition by 36.7%. The results
show the accuracy of estimation of calcium and
magnesium nutrition including moderate grade, while
the estimation of sulfur nutrition is poor.
REFERENCES
Adillah, Y. (2018). Analisis Pertumbuhan dan
Produktivitas Padi dengan Nilai Indeks Vegetasi
Menggunakan Kamera Multispektral UAV (Analysis of
Growth and Productivity of Rice with Vegetation Index
Values Using UAV Multispectral Cameras.) Master.
IPB University.
Badan Pusat Statistik. (2018). Statistik Kelapa Sawit
Indonesia 2017 (Indonesian Oil Palm Statistics 2017).
Indonesia: Badan Pusat Statistik.
Adiwiganda, R. and Siahaan, M.M. (1994). Kursus
Manajemen Perkebunan Dasar Bidang Tanaman
(Basic Plantation Management Course in Plant Fields).
Medan, Indonesia: Lembaga Pendidikan Perkebunan
Kampus Medan, p. 68.
Chapman, G.W. and Gray, H.M. (1949). Leaf Analysis and
the Nutrition of Oil Palm. Annals of Botany, 13(4), pp.
415-433.
Dony, K. (2014). Teknologi Akuisisi Data Pesawat Tanpa
Awak dan Pemanfaatannya untuk Mendukung Produksi
Informasi Penginderaan Jauh (The Unmanned Aerial
Vehicles Data Acquisition Technology and Its
Estimation of Calcium, Magnesium and Sulfur Content in Oil Palm using Multispectral Imagery based UAV
133
Utilization to Support the Production of Remote
Sensing Information). Inderaja, 5(7), pp. 24-31.
Goh, K.J., Hardter, R. (2003). General Oil Palm Nutrition.
In: Fairhust T.H., Hardter, ed., Oil Palm: Management
for Large and Sustainable Yield. Switzerland: PPI., pp.
191-230.
Gerendas, J. and Heng, A. (2010). Oil Palm Fertilization –
Sharing Some Perspectives. Plantation Industry:
Competitive Strategies In Achieving A Sustainable
Future. Selangor, Malaysia, pp. 1-6.
Jaya, I.N.S. (2015). Analisis Citra Digital: Perspektif
Penginderaan Jauh untuk Pengelolaan Sumberdaya
Alam (Digital Image Analysis: A Remote Sensing
Perspective for Natural Resource Management). Bogor,
Indonesia: IPB Press.
Kale, P. and Singh, K.R. (2015). A Technical Analysis of
Image Stitching Algorithm. International Journal of
Computer Science and Information Technologies, 6(1),
pp. 284-288.
Kasih, L.S.B. (2012). Penentuan Iluminansi dan Ketinggian
Terbang Pesawat Optimum untuk Pemetaan Tingkat
Warna Daun Padi (Determination of Optimum Aircraft
Illuminance and Altitude for Mapping the Color of Rice
Leaves). Bachelor. Bogor, Indonesia: IPB University.
Nanda, M. A., Seminar, K. B., Nandika, D., & Maddu, A.
(2019). Development of Termite Detection System
Based on Acoustic and Temperature Signals.
Measurement, 147, 106902.
Nanda, M. A., Seminar, K. B., Nandika, D., & Maddu, A.
(2018a). A Comparison Study of Kernel Functions in
the Support Vector Machine and Its Application for
Termite Detection. Information, 9(1), 5.
Nanda, M. A., Seminar, K. B., Nandika, D., & Maddu, A.
(2018b). Discriminant Analysis as a Tool for Detecting
the Acoustic Signals of Termites Coptotermes
curvignathus (Isoptera: Rhinotermitidae). International
Journal of Technology, 9(5): pp. 840-851.
Pahan, I. (2006). Panduan Lengkap Kelapa Sawit
(Complete Palm Oil Guide). Jakarta, Indonesia:
Penebar Swadaya.
Parrot, S.A. (2017). Parrot Sequoia Capture the Iinvisible
Monitor Your Crops. [Online]. Avaiable at:
https://www.parrot.com/us/business-solutions/parrot-
sequoia [Accessed 1 January 2018].
Pusat Data dan Sistem Informasi Pertanian. (2014). Outlook
Komoditi Kelapa Sawit (Palm Oil Commodity
Outlook). Jakarta, Indonesia: Pusat Data dan Sistem
Informasi Pertanian Sekretariat Jenderal-Kementerian
Pertanian.
Shofiyati, R. (2011). Teknologi Pesawat Tanpa Awak untuk
Pemetaan dan Pemantauan Tanaman dan Lahan
Pertanian (Unmanned Aerial Vehicles Technology for
Mapping and Monitoring Crops and Agricultural Land).
Informatika Pertanian, 20(2):,pp. 58–64.
Starks, P.J., Zhao, D., Phillips, W.A. and Coleman, S.W.
(2006). Development of Canopy Reflectance
Algorithms for Realtime Prediction of Bermuda Grass
Pasture Biomass and Nutritive Values. J. Crop Sc,.
46(2), pp. 927-934.
Sudradjat. (2016). Kelapa Sawit: Peningkatan
Produktivitas(Palm Oil: Increased Productivity).
Bogor, Indonesia: IPB Press, p. 68.
Von Uexkull, H.R. and Fairhurst, T.H. (1991). Fertilizing
for High Yield and Quality. Basel, Switzerland:
International Potash Institute.
Wang, F., Hsiao, Y. and Chang, K. (2012). Combining
Diffusion and Grey Models Based on Evolutionary
Optimization Algorithms to Forecast Motherboard
Shipments. Journal of Mathematical Problems in
Engineering, pp 1-10.
Winarna, Sutarta, E.S. and Sugiono. (2005). Pedoman
Pengambilan Contoh Daun dan Tanah pada Tanaman
Kelapa Sawit (Guidelines for Sampling Leaves and
Soils in Palm Oil Plants). Medan, Indonesia: Pusat
Penelitian Kelapa Sawit.
APPENDIX
Digital number values of digitization of the sample plant
canopy.
Sample Green NIR Re
d
Red Edge
1A 97.696 150.290 55.234 126.499
1B 99.226 162.430 60.269 128.360
1C 107.011 158.916 62.020 128.823
1D 100.055 149.172 54.509 120.953
1E 101.391 162.627 55.288 125.934
2A 92.608 131.776 71.301 127.583
2B 110.319 123.704 75.585 139.960
2C 103.668 124.700 73.264 132.114
2D 104.833 123.975 73.732 129.730
2E 107.398 130.823 70.143 133.121
2F 118.497 135.772 75.499 137.183
2G 112.261 130.371 69.891 125.834
2H 122.389 129.942 77.669 131.776
3A 107.613 133.104 73.033 134.595
3B 125.211 138.418 85.341 141.739
3C 102.690 124.847 73.835 121.059
3D 114.509 134.506 80.459 137.144
3E 103.420 133.144 73.862 128.594
3F 101.884 131.221 69.520 123.551
3G 105.717 133.299 69.451 131.241
3H 108.704 131.464 80.579 128.028
3I 121.342 135.507 97.446 132.733
3J 122.091 132.585 98.171 135.082
3
K
134.299 137.072 99.472 146.368
3L 114.651 134.315 84.555 141.575
4A 111.116 137.428 77.785 136.967
4B 90.891 131.026 72.818 119.278
4C 79.805 129.379 66.129 122.606
4D 85.741 126.997 73.204 123.770
4E 96.247 141.433 77.157 131.028
2nd SIS 2019 - SEAFAST International Seminar
134
